Breakpoints
Breakpoints are special markers that suspend program execution at a specific point. This lets you examine the program state and behavior. Breakpoints can be simple, for example, suspending the program on reaching some line of code, or involve more complex logic, such as checking against additional conditions, writing to a log, and so on).

Once set, a breakpoint remains in your project until you remove it explicitly, except for temporary breakpoints.
Types of breakpoints
The following types of breakpoints are available in WebStorm:
Line breakpoints: suspend the program upon reaching the line of code where the breakpoint was set. This type of breakpoints can be set on any executable line of code.
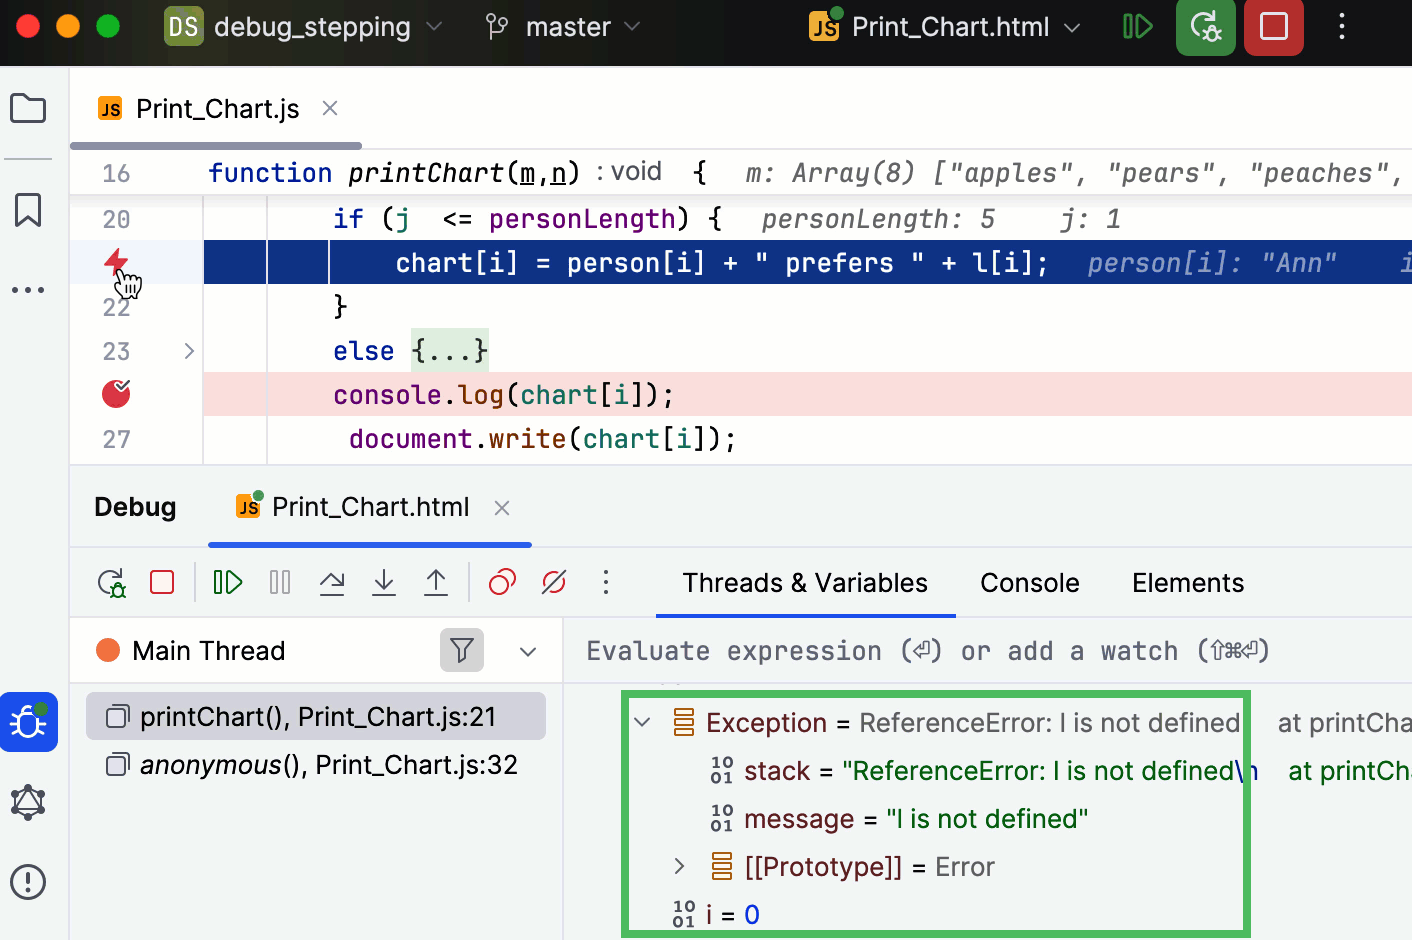
Exception breakpoints: suspend the program when the specified JavaScript exception is thrown. Unlike stack traces, suspending an application on an exception allows you to examine the surrounding context or data while it is still available.
Set breakpoints
Set line breakpoints
Click the gutter at the executable line of code where you want to set the breakpoint. Alternatively, place the caret at the line and press Ctrl+F8.
To set a temporary line breakpoint, press Ctrl+Alt+Shift+F8. Alternatively, hold Alt and click the gutter. This breakpoint will be removed from your project right after it is hit.
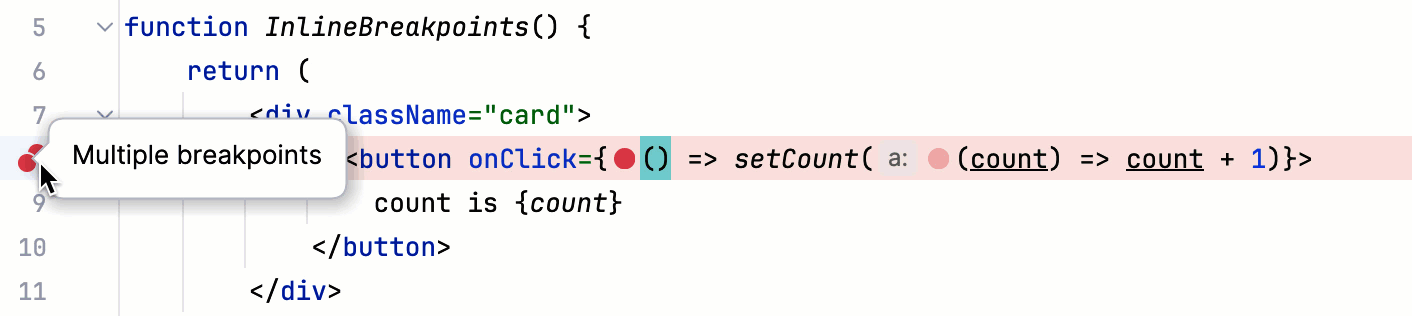
For arrow functions, you can set multiple breakpoints within a single line. When you click the gutter, WebStorm displays hints where you can set breakpoints in that line. Click the relevant hints.
Set exception breakpoints
Press Ctrl+Shift+F8 or select from the main menu.
In the Breakpoints dialog, press Alt+Insert or click
 , and select JavaScript Exception Breakpoints.
In the Add Exception Breakpoint dialog, specify the exception class from a library or from your project.

To have the debugger stop every time an exception is thrown, select the Any exception checkbox.

Manage breakpoints
Remove breakpoints
For non-exception breakpoints: click the breakpoint in the gutter.
For all breakpoints: go to Ctrl+Shift+F8 in the main menu, select the breakpoint, and click Remove or press Delete.
To avoid accidentally removing a breakpoint and losing its parameters, you can choose to remove breakpoints by dragging them to the editor or clicking the middle mouse button. To do this, go to and select Drag to the editor or click with the middle mouse button. Clicking a breakpoint will then enable or disable it.
Mute breakpoints
If you don't need to stop at your breakpoints for some time, you can mute them. This allows you to resume normal program operation without leaving the debugger session. After that, you can unmute breakpoints and continue debugging.
Click the Mute Breakpoints button
 in the toolbar of the Debug tool window.
Enable/disable breakpoints
When you remove a breakpoint, its internal configuration is lost. To temporarily turn an individual breakpoint off without losing its parameters, you can disable it:
For non-exception breakpoints: right-click it and set the Enabled option as required. Alternatively, you can do this by clicking a breakpoint while holding Alt or clicking it with the middle mouse button. For the middle mouse button, check that removing breakpoints is not assigned to it.
For all breakpoints: click Run | View Breakpoints Ctrl+Shift+F8 and check/uncheck the breakpoint on the list.
Move/copy breakpoints
To move a breakpoint, drag it to another line.
To copy a breakpoint, hold Ctrl and drag a breakpoint to another line. This creates a breakpoint with the same parameters at the destination.
View all set breakpoints
You can view the list of all breakpoints in the Bookmarks tool window. Breakpoints are automatically added to the dedicated list in the tool window once you place them in your code.
In the main menu, go to or press Alt+2 and expand the Breakpoints list.

Group breakpoints
You can organize breakpoints into groups, for example, if you need to mark out breakpoints for a specific problem.
In the Breakpoints dialog Ctrl+Shift+F8, select a breakpoint you want to place in a group and select from the menu.
Configure breakpoints' properties
Depending on the breakpoint type, you can configure additional properties which allow you to tailor its operation for specific needs. The most used options are available via intentions.
Basic breakpoint properties are available via intentions. Place the caret at the line with the breakpoint and press Alt+Enter:

To access the full list of properties, right-click the breakpoint and click More or press Ctrl+Shift+F8.

Intentions reference
Intention | Description |
|---|---|
Remove breakpoint | Removes the breakpoint at the selected line. |
Disable Breakpoint | Disables the breakpoint at the selected line. |
Edit Breakpoint | Opens a dialog with the most used breakpoint properties. For more properties, click More or press Ctrl+Shift+F8. |
Breakpoints' properties reference
In this chapter, you can find information on the features available for breakpoints.
Enabled
Clear the checkbox to temporarily disable a breakpoint without removing it from the project. Disabled breakpoints are skipped during stepping.
You can configure WebStorm to enable/disable breakpoints on clicking rather than removing them altogether. To do this, go to and set the Remove breakpoint option to Drag to the editor or click with middle mouse button.
Suspend
Specifies whether to pause the program execution when the breakpoint is hit.
Non-suspending breakpoints are useful when you need to log some expression without pausing the program (for example, when you need to know how many times a method was called) or if you need to create a trigger breakpoint that will enable dependent breakpoints when hit.
Condition
Select this checkbox if you want the debugger to stop at the breakpoint only when a certain condition is met. Define the condition through a JavaScript boolean expression that evaluates to true or false, for example, fruit == "grapes". This expression must be valid at the line where you set the breakpoint.
You can type multiline expressions, for example:
Optionally, specify the actions that you want WebStorm to perform if the condition is met and the debugger stops at the breakpoint, learn more from Log below.

When the debugger reaches the line with a conditional breakpoint, the specified boolean expression is evaluated. If the expression evaluates to true, the program is suspended.

If you selected any logging actions in the Log area, the Console tab shows the corresponding message:

The result of the expression is taken from the return statement. When there is no return statement, the result is taken from the last line of code.
When evaluating expressions, make sure you are aware of their possible side effects as they may potentially affect the behavior and the result of the program.
Logging options
When a breakpoint is hit, the following can be logged to the console:
"Breakpoint hit" message: a log message like
Breakpoint reached at ocean.Whale.main(Whale.java:5).Stack trace: the stack trace for the current frame. This is useful if you want to check what paths have led to this point without interrupting the program execution.
Evaluate and log: the result of an arbitrary expression, for example,
"Initializing"orusers.size().The result of the expression is taken from the return statement. When there is no return statement, the result is taken from the last line of code, which doesn't have to be an expression: a literal works too. This can be used to produce a custom message or to keep track of some values as the program executes.
When evaluating expressions, make sure you are aware of their possible side effects as they may potentially affect the behavior and the result of the program.
Set a logging breakpoint
(optional) If the expression that you want to log is in front of you in the editor, select it.
Hold Shift and click the gutter.
Remove once hit
Specifies whether the breakpoint should be removed from the project after it has been hit once.
Disable until hitting the following breakpoint
When a breakpoint is selected in the Disable until hitting the following breakpoint box, it acts as a trigger for the current breakpoint. This disables the current breakpoint until the specified breakpoint has been hit.
You can also choose whether to disable it again after this has happened or leave it enabled.
This option is useful when you only need to suspend the program under certain conditions or after certain actions. In this case, the trigger breakpoint usually isn't required to stop the program execution and is made non-suspending.
Breakpoint statuses
Breakpoints can have the following statuses:
Status | Description |
|---|---|
Verified | After you have started a debugger session, the debugger checks whether it is technically possible to suspend the program at the breakpoint. If yes, the debugger marks the breakpoint as verified. |
Warning | If it is technically possible to suspend the program at the breakpoint, however there are issues related to it, the debugger sets the breakpoint status to warning. This may happen, for example, when it is impossible to suspend the program at one of the method's implementations. |
Invalid | If it is technically impossible to suspend the program at the breakpoint, the debugger marks it as invalid. This often happens because there is no executable code on the line. |
Inactive/dependent | A breakpoint is marked as inactive/dependent when it is configured to be disabled until another breakpoint is hit, and this has not happened yet. |
Muted | All breakpoints are temporarily inactive because they have been muted. |
Disabled | This breakpoint is temporarily inactive because it has been disabled. |
Non-suspending | The suspend policy is set for this breakpoint so that it does not suspend the execution when hit. |
Breakpoint icons
Depending on their type and status, breakpoints are marked with the following icons:
Line | Exception | |
|---|---|---|
Regular |
|
|
Disabled |
|
|
Verified |
| |
Muted |
| |
Inactive/dependent |
| |
Muted disabled |
| |
Non-suspending |
| |
Verified non-suspending |
|
Productivity tips
- Use breakpoints for "printf" debugging
Use non-suspending logging breakpoints (sometimes referred to as watchpoints in other debuggers) instead of inserting print statements in your code. This provides a more flexible and centralized way of handling debug log messages.
- Set logging breakpoints more quickly
To set a non-suspending logging breakpoint, hold Shift and click the gutter. This will not suspend the program execution and instead log a message like
Breakpoint reached at ocean.Whale.main(Whale.java:5). If you want to log some expression that is in front of you in the editor, select it before holding Shift and clicking the gutter.- Add breakpoint descriptions
If you have many breakpoints in your project, you can add descriptions to breakpoints for ease of search. To do this, right-click a breakpoint in the Breakpoints dialog Ctrl+Shift+F8 and select Edit description from the menu. Now when you start typing the breakpoint name, it gets the focus.
- Jump to source
To jump from the Breakpoints dialog to the line of code where the selected breakpoint is set, press F4.