Live Edit in HTML, CSS, and JavaScript
With the Live Edit functionality, the changes you make to your HTML, CSS, or JavaScript code are immediately shown in the browser without reloading the page.
Live Edit works for other file types that contain or generate HTML, CSS, or JavaScript. You can also use Live Edit when debugging a Node.js application. For more information, refer to Live Edit in Node.js application.
By default, Live Edit is enabled only for HTML and CSS files.
Before you start
Make sure the JavaScript and TypeScript, JavaScript Debugger, and Live Edit bundled plugins are enabled in the settings.
Configure the built-in debugger as described in Configuring JavaScript debugger.
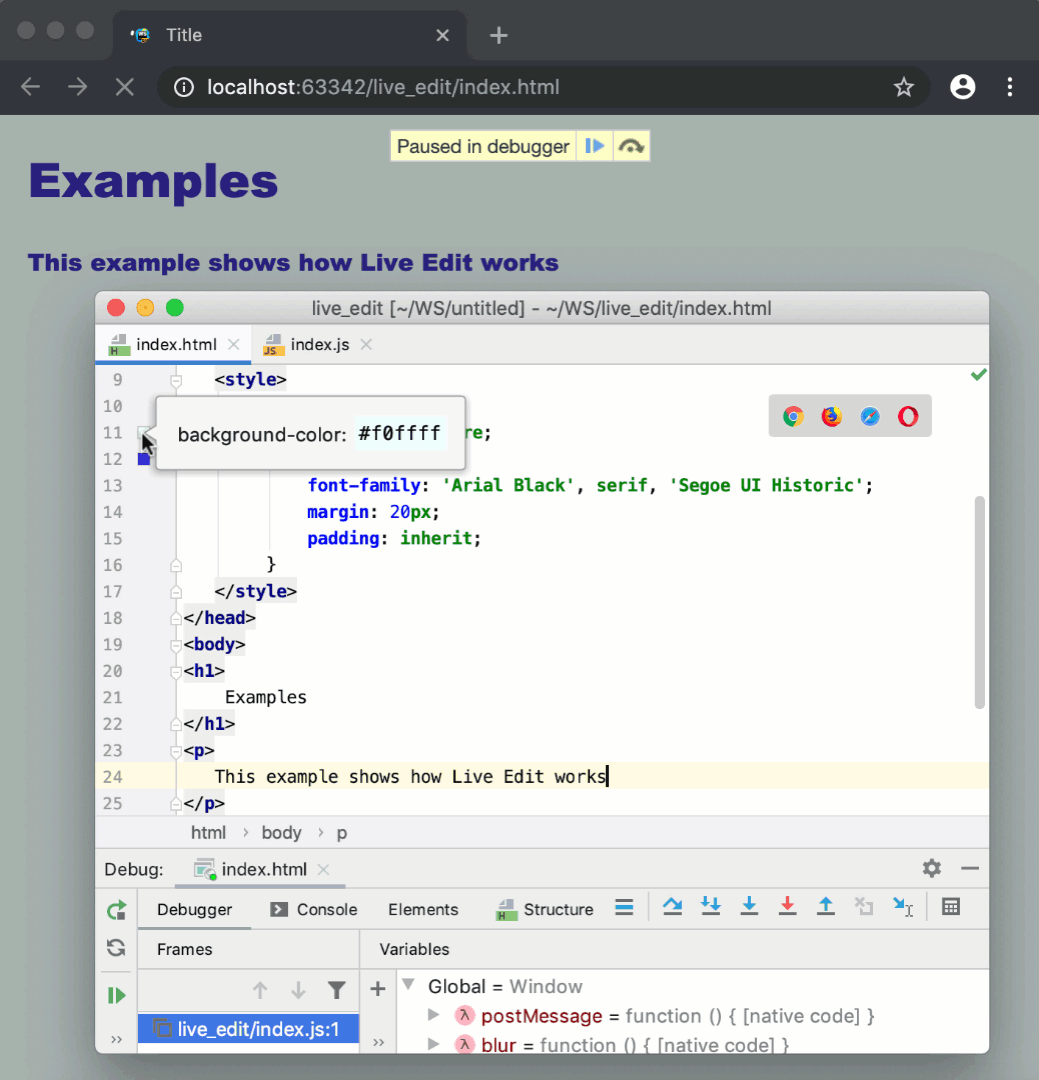
To have the changes you make to your HTML, CSS, or JavaScript code immediately shown in the browser without reloading the page, activate the Live Edit functionality.
Activate and configure Live Edit in JavaScript
In the Settings dialog (Ctrl+Alt+S) , go to .
On the Live Edit page that opens, select the Update application in Chrome on changes in checkbox.
By default, WebStorm shows on-the-fly preview only for HTML and CSS code. To enable Live Edit in JavaScript, select the JavaScript, HTML and CSS option.
Specify the time-delay between changing the code in the editor and showing this change in the browser: accept the default value
300 msor specify a custom value using the spin box next to the corresponding field.To enable reloading of JavaScript files that are executed by Node.js, select the Update Node.js application on change checkbox. Use the spin box to specify the elapsed time for upload, the default value is 300.
To enable Live Edit in code that can be compiled into JavaScript, HTML, or CSS, for example, in TypeScript, Pug, or SCSS, select the Track changes in files compiled to JavaScript, HTML or CSS checkbox.
All the changes made in such files are automatically saved to trigger compilation and then appear in the browser.
Note that a changed file is saved shortly after the update, contrary to regular autosave triggered by closing a file, a project, or WebStorm, or by other events.
Select the Restart if hotswap fails checkbox to allow WebStorm to reload the page automatically if the changes couldn't be applied without that.
To configure highlighting, go to and select the Highlight current element in browser on caret change checkbox in the Debugger area. Otherwise, during a debugging session, you will have to hold Shift and hover over the element in the editor to highlight it in the browser.
Use Live Edit
Update your HTML, CSS, or JavaScript code as necessary. The changes are reflected in the browser immediately without reloading the page.