V8 CPU and memory profiling
With WebStorm, you can capture and analyze CPU profiles and heap snapshots for your Node.js applications using V8’s sample-based profiler.
You can also open and explore snapshots captured in Google Chrome DevTools for your client-side code.
Before you start
Make sure the Node.js plugin is enabled in the settings. Press Ctrl+Alt+S to open settings and then select . Click the Installed tab. In the search field, type Node.js. For more information about plugins, refer to Managing plugins.
CPU profiling
CPU profiling helps you get a better understanding of which parts of your code take up the most CPU time, and how your code is executed and optimized by the V8 JavaScript engine.
Node.js CPU profiling in WebStorm is based on the V8 built-in CPU profiler, which provides information about the execution of your code and the behavior of the JavaScript engine itself including garbage collection cycles, compilation and re-compilation, and code optimization.
The profiler takes snapshots at certain intervals that are called ticks. Measurements are made not only for the work of your code, but also for the activities performed by the engine itself, such as compilation, calls of system libraries, optimization, and garbage collection.
Enable CPU profiling
To invoke V8 CPU profiling on application start, you need to specify additional settings in the Node.js run configuration.
Go to . Alternatively, select Edit Configurations from the Run widget on the toolbar.

In the Edit Configurations dialog that opens, click the Add button (
) on the toolbar and select Node.js from the list.
From the list, select the Node.js run configuration to activate CPU Profiling in or create a new configuration as described in Running and debugging Node.js.
Switch to the V8 Profiling tab and select the Record CPU profiling info checkbox. In the Log folder field, specify the path to the folder where the recorded logs will be stored, log files are named
isolate-<session number>.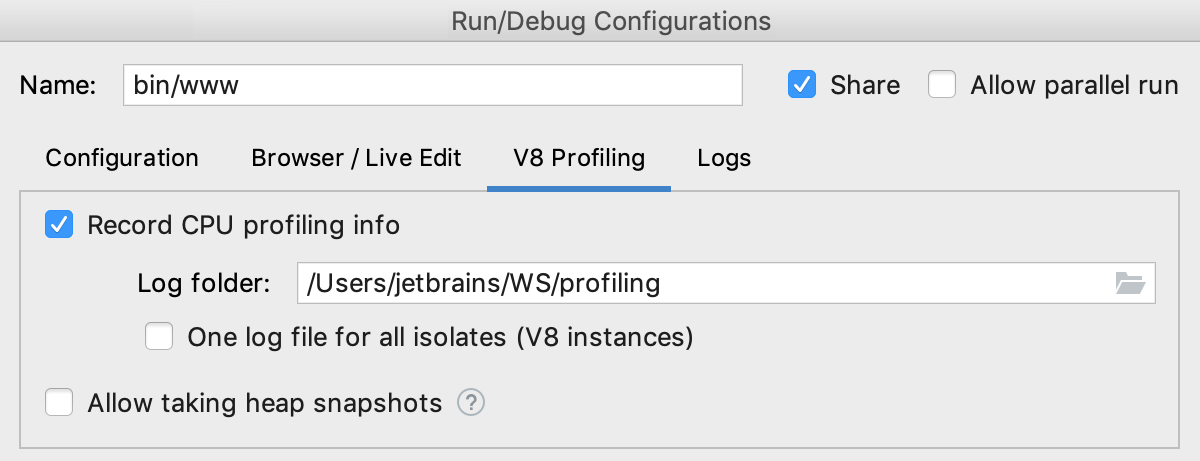
Collect CPU profiling information
Select the run configuration from the list on the main toolbar and click
or select from the main menu.
When the scenario that you need to profile is executed, stop the process by clicking
on the toolbar.
Analyzing CPU profiling logs
When you stop your application, WebStorm automatically opens the V8 Profiling tool window and shows the collected profiling data in it. If the window is already open and shows the collected data for another session, WebStorm opens a new tab. Tabs that were opened automatically are named after the run configurations that control execution of the applications and collecting the profiling data.
To open and analyze some previously saved profiling data, go to (or press Ctrl+Shift+A), start typing V8, and select Analyze V8 Profiling Log from the list.

Then select the relevant V8 log file isolate-<session number>. WebStorm creates a separate tab with the name of the selected log file.
Based on the collected profiling data, WebStorm builds three call trees and displays each of them in a separate pane. With these call trees you can analyze the application execution from two different points of view: on the one hand, which calls were time-consuming ("heavy"), and on the other hand, "who called whom".
Understanding the metrics in the call trees
The call trees use the Total and Self metrics that present the number of ticks in a function or its ratio to the total execution time:
Total shows how much time was spent inside a function and the functions it called.
Self shows how much time was spent only inside a function itself without taking into account its child nodes.
The Of Parent metric shows the ratio of the pure execution time of a function to the execution time of the function that called it (Parent).
V8 optimiser
In some cases, V8 can optimize your code. For more information, refer to Optimizing for V8.
An asterisk
*before the name of a function indicates that the function has been optimized.A tilde
~indicates that the function possibly requires optimization but has not been optimized. The engine may postpone optimization or skip it if the code is short-running, however a tilde points at the place where the code can be rewritten to achieve better performance.
Top Calls tree
The Top Calls pane lists the performed activities in the descending order sorted by the Self metrics. For each activity, its Total, Total%, and Self% metrics are shown. For each function call, WebStorm displays the name of the file, the line, and the column where the function is defined.
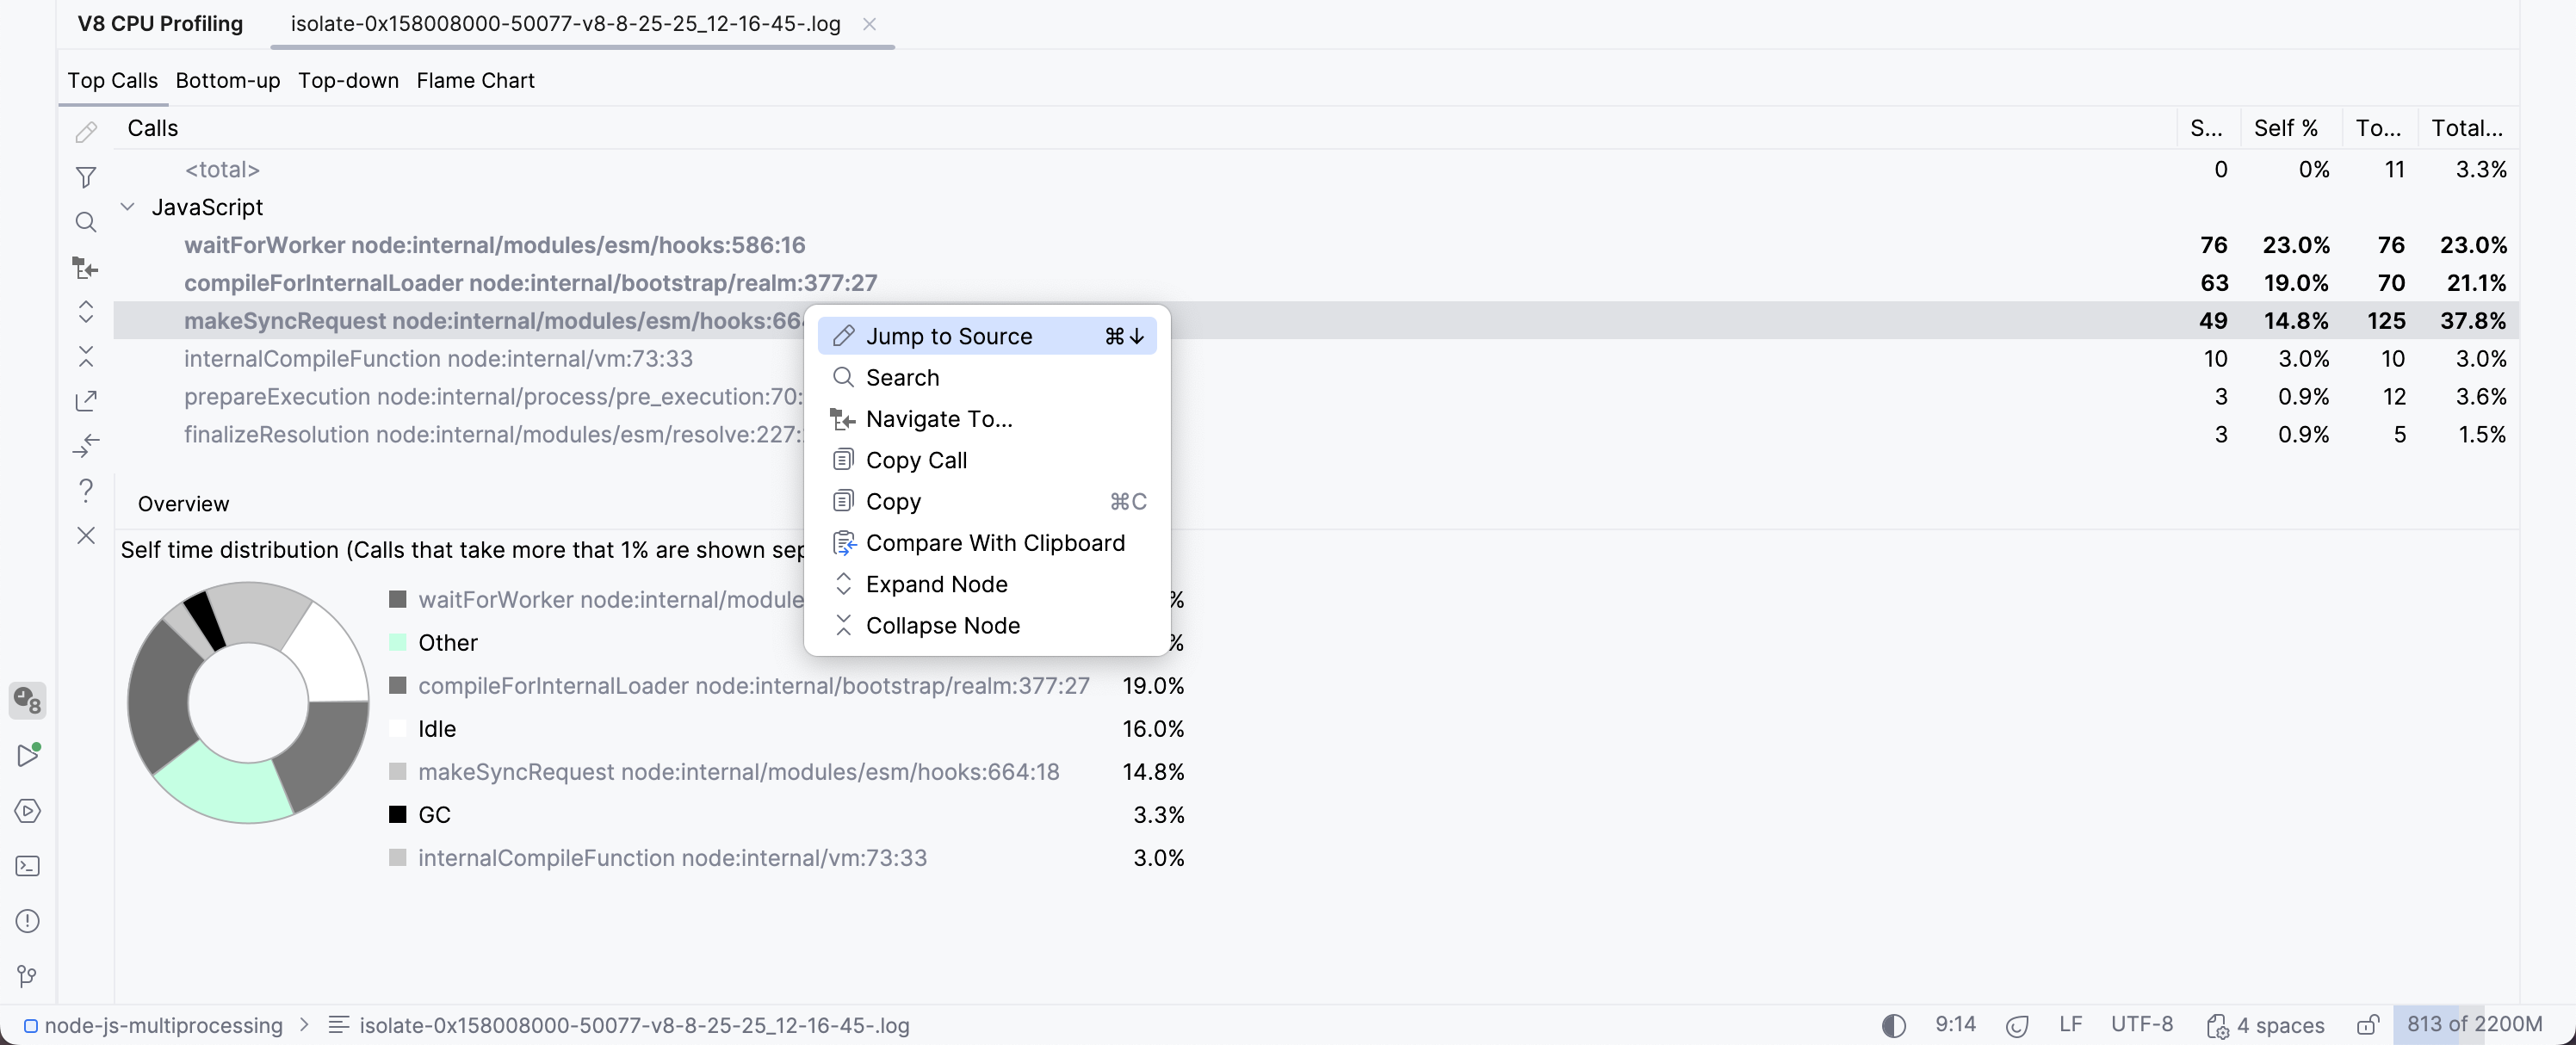
The diagram in the Overview pane shows distribution of Self time for calls with the Self% metrics above 1%.
Bottom-up tree
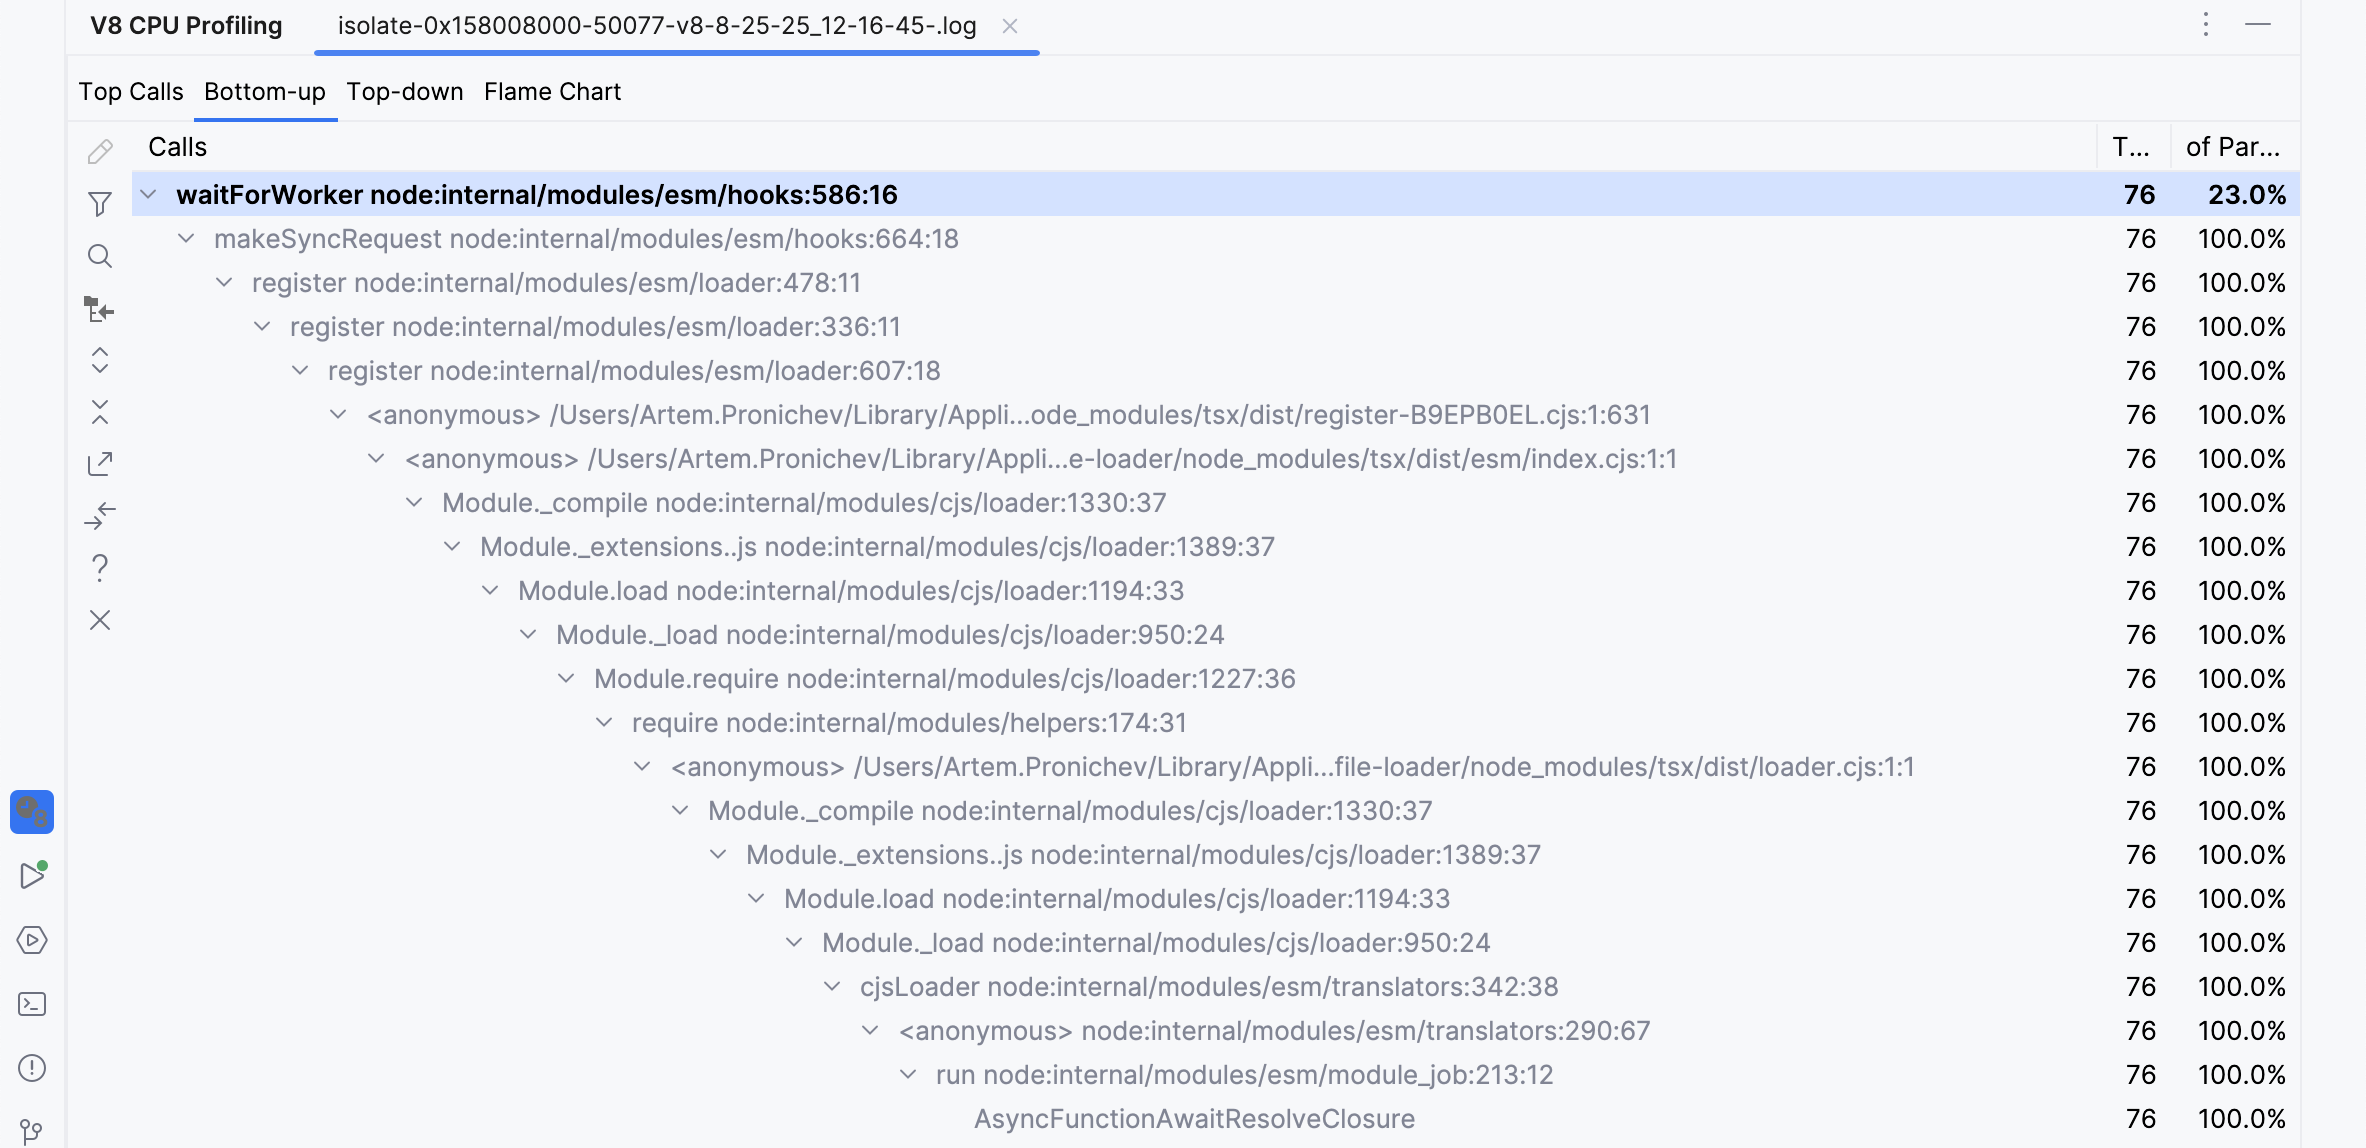
The Bottom-up pane also lists the performed activities sorted in the descending order by the Self metrics. Unlike the Top Calls pane, the Bottom-up pane shows only the activities with the Total% metrics above 2 and the functions that called them.
For each activity, its execution time in ticks and the Of Parent metrics are shown.
For each function call, WebStorm displays the name of the file, the line, and the column where the function is defined.
Top-down tree
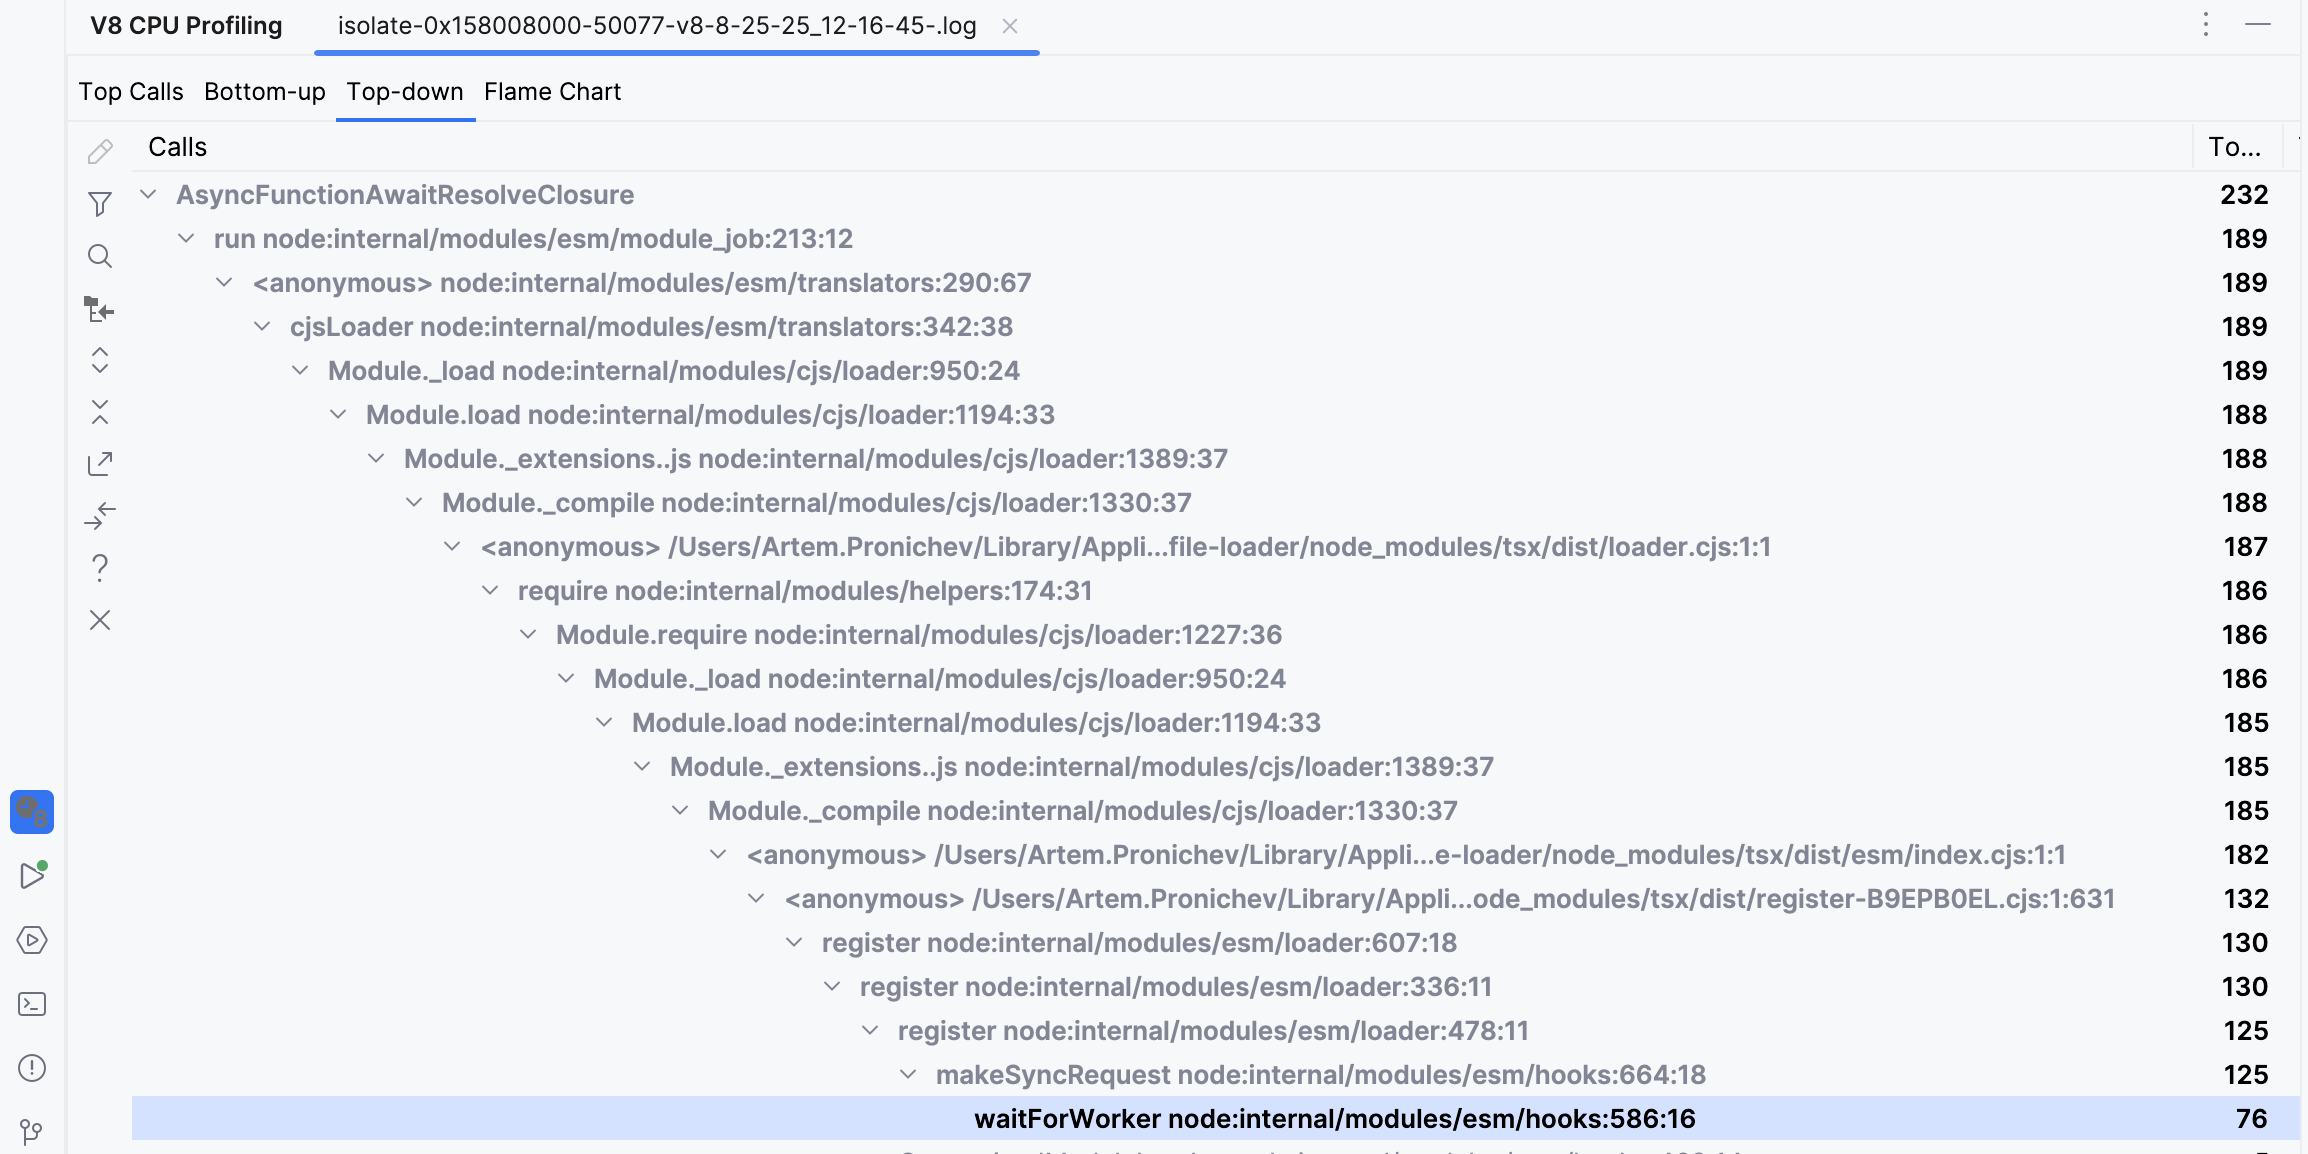
The Top-down pane shows the entire call hierarchy with the functions that are execution entry points shown at the top. For each activity, its Total, Total%, Self, and Self% metrics are shown. For each function call, WebStorm displays the name of the file, the line, and the column where the function is defined.
Navigate through the call trees
To navigate to the source code of a function, select this function and press F4 or
on the toolbar or select Jump to source from the context menu.
To switch to another pane and examine a call from another perspective, select the call and select Navigate To from the context menu of the call, and then select the destination. WebStorm switches to the selected pane and moves the focus to the call.
Expand or collapse nodes
When WebStorm opens a tab for a profiling session, by default it expands the nodes with the heaviest calls. While exploring the trees, you may like to fold some of these nodes or expand other ones.
To expand or collapse a node, select Expand Node or Collapse Node from its context menu.
To collapse all the nodes in the active pane, click
on the toolbar.
To restore the original tree presentation, click
.
Filter out light calls
Do this to see only the calls that actually cause performance problems.
Click
on the toolbar, then, using the slider, specify the minimum Total% or Parent% value for a call to be displayed, and click Done.
Save and compare profiling data
To save a line with a function and its metrics, select Copy from the context menu of the function. This may be helpful if you want to compare the measurements for a function from two sessions, for example, after you make some improvements to the code.
To save only the function name and the name of the file where it is defined, select Copy Call from the context menu of the function.
To compare an item with the contents of the Clipboard, select Compare With Clipboard from the context menu of the item. WebStorm opens the Diff Viewer.
To compare the current log with another isolate, click
on the toolbar. In the dialog that opens, select the isolate to compare the current one with. To narrow down the search, specify whether the target isolate was taken before or after the current one.
Export call trees
To save the call tree in the current pane to a text file, click
on the toolbar and specify the target file in the dialog that opens.
Analyzing the Flame Chart
Use the multicolor Flame Chart to find where the application paused and explore the calls that provoked these pauses.
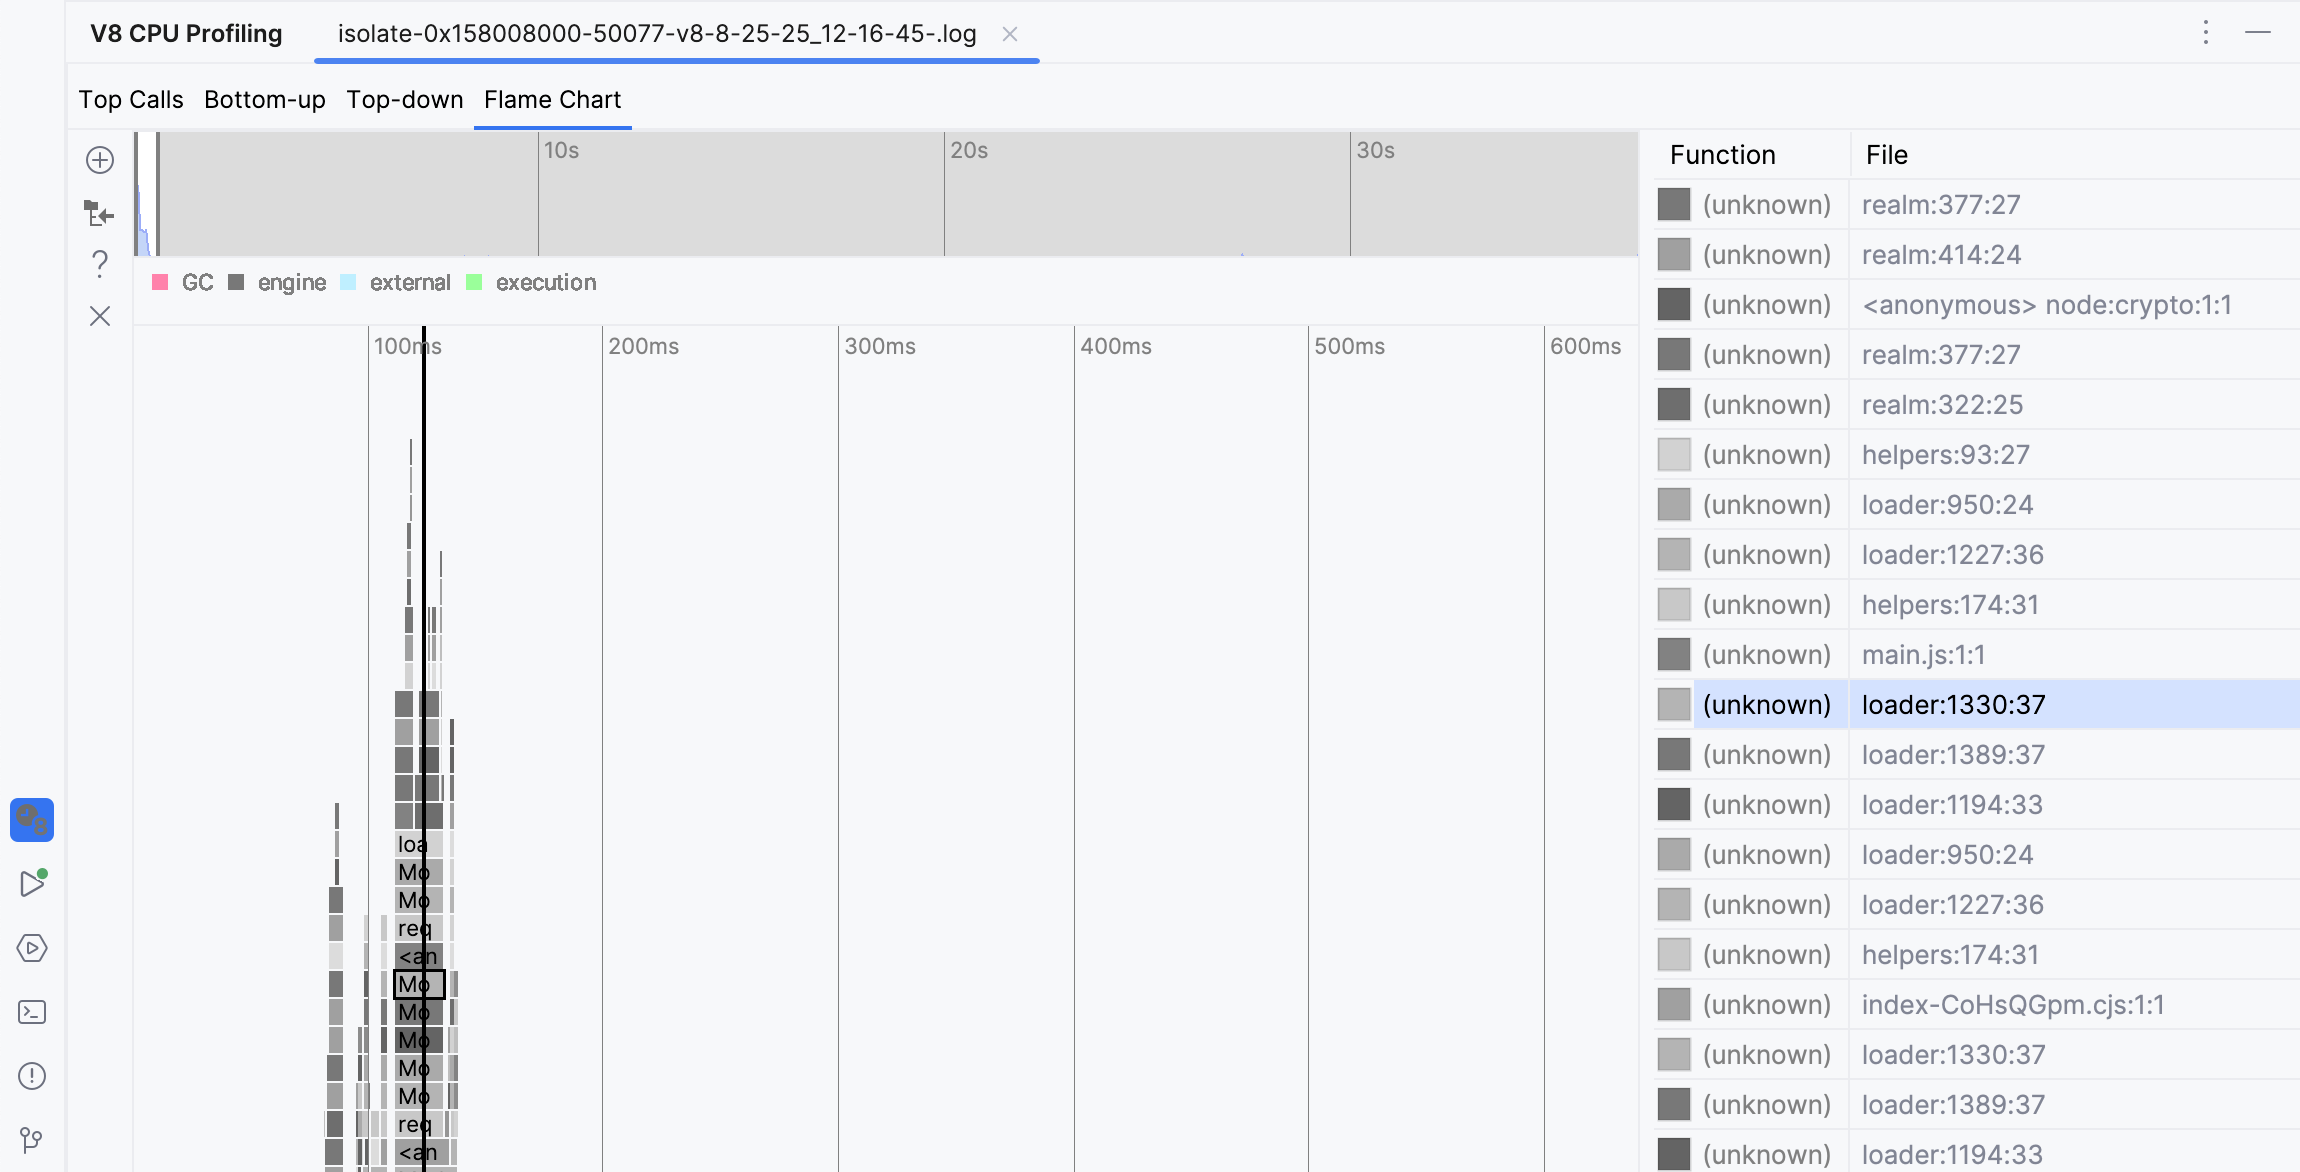
The chart consists of four areas:
The upper area shows a timeline with two sliders to limit the beginning and the end of a fragment to investigate.
The bottom area shows a stack of calls in the form of a multicolor chart. When called for the first time, each function is assigned a random color, whereupon every call of this function within the current session is shown in this color.
The middle area shows a summary of calls from the Garbage Collector, the engine, the external calls, and the execution itself. The colors reserved for these activities are listed on top of the area.
The right-hand pane lists the calls within a selected fragment, for each call the list shows its duration, the name of the called function, and file where the function is defined.
The bottom and the right-hand areas are synchronized: as you drag the slider in the bottom area through the timeline, the focus in the right-hand pane moves to the call that was performed at each moment.
Moreover, if you click a call in the bottom area, the slider moves to it automatically and the focus in the right-hand pane switches to the corresponding function, if necessary the list scrolls automatically. And vice versa, if you click an item in the list, WebStorm selects the corresponding call in the bottom area and drags the slider to it automatically:
Select fragments in the Timeline
To explore the processes within a certain period of time, you need to select the corresponding fragment in the timeline. To do that, drag the sliders or click the window between two sliders and drag it to the required fragment.
In either case, the multicolor chart below shows the stack of calls within the selected fragment.
To enlarge the chart, click the selected fragment and then click
on the toolbar. WebStorm opens a new tab and shows the selected fragment enlarged to fit the tab width, so you can examine the fragment with more details.
Navigate through the Flame Chart
From the calls in the right-hand area, you can jump to the source code of called functions, to the other panes of the tool window, and to the areas in the flame chart with specific metrics.
To jump to the source code of a called function, select Jump to Source from the context menu of the call.
To have the flame chart zoomed at the fragments with specific metrics of a call, select the call and select Navigate To from the context menu of the call, and then select the metrics.
You can also navigate to the stack trace of a call to view and analyze exceptions. To do that, select Show As Stack Trace from the context menu of the call. WebStorm opens the stack trace in a separate tab, to return to the Flame Chart pane, click the V8 CPU Profiling tool window button in the bottom.
Memory profiling
Memory profiling lets you detect memory leaks and dynamic memory problems and locate the fragments of code that caused them.
Enable memory profiling
To invoke taking memory snapshots on application start, you need to specify additional settings in the Node.js run configuration.
Go to . Alternatively, select Edit Configurations from the Run widget on the toolbar.

In the Edit Configurations dialog that opens, click the Add button (
) on the toolbar and select Node.js from the list.
From the list, choose the Node.js run configuration to activate CPU Profiling in or create a new configuration as described in Create a Node.js run/debug configuration.
Switch to the V8 Profiling tab and select the Allow taking heap snapshots checkbox.
Collect memory profiling information
Select the run configuration from the list on the main toolbar and click
or select from the main menu.
At any time during the application execution, click
on the toolbar of the Run tool window.
In the dialog that opens, specify the name for the snapshot and the path to the folder where it will be stored. To start analyzing the snapshot immediately, select the Open snapshot checkbox.
Analyzing memory snapshots
When you take a snapshot and choose to analyze it, WebStorm opens the V8 Heap tool window with the collected data. If the window is already open and shows the collected data for another session, WebStorm opens a new tab.
To open and analyze some previously saved memory profiling data, go to (or press Ctrl+Shift+A, start typing V8, and select Analyze V8 Heap Snapshot from the list.

Then select the relevant .heapsnapshot file. WebStorm creates a separate tab with the name of the selected file.
The tool window has three tabs that present the collected information from different points of views.
The Containment tab shows the objects in your application grouped under several top-level entries: DOMWindow objects, Native browser objects, and GC Roots, which are roots the Garbage Collector actually uses. For more information, refer to Containment View.
For each object, the tab shows its distance from the GC root, that is the shortest simple path of nodes between the object and the GC root, the shallow size of the object, and the retained size of the object. Besides the absolute values of the object's size, WebStorm shows the percentage of memory the object occupies.
The Biggest Objects tab shows the most memory-consuming objects sorted by their retained sizes. In this tab, you can spot memory leaks provoked by accumulating data in some global object.
The Summary tab shows the objects in your application grouped by their types. The tab shows the number of objects of each type, their size, and the percentage of memory that they occupy. This information may be a clue to the memory state.
Each tab has a Details pane, which shows the path to the currently selected object from GC roots and the list of object’s retainers, that is, the objects that keep links to the selected object. Every heap snapshot has many “back” references and loops, so there are always many retainers for each object.
Mark objects with text labels
Labels help you differentiate objects and move from one to another without losing the context.
To set a label to an object, select the object and click
on the toolbar or select Mark from the context menu. Then specify the text label in the dialog that opens.
Navigate through snapshots
To navigate to the function or variable that corresponds to an object, select this object and click
on the toolbar or select Edit Source from the context menu. If the button and the menu option are disabled, this means that WebStorm has not found any functions or variables that correspond to the selected object.
If several functions or variables are found, WebStorm shows them in a suggestion list.
To help you investigate objects from the containment point of view and concentrate on the links between objects, WebStorm lets you jump from an object in the Biggest Objects or Summary tab or in the Occurrences view to the same object in the Containment tab.
To do that, select the object and select Navigate in Main Tree from the context menu.
Search through snapshots
In the Containment tab, click
on the toolbar.
In the V8 Heap Search dialog that opens, specify the search pattern and the scope to search in. The available scopes are:
Everywhere: select this checkbox to search in all the scopes. When this checkbox is selected, all the other search types are disabled.
Link Names: select this checkbox to search among the object names that V8 creates when calling the C++ runtime.
In the V8 Heap tool window, link names are marked with the
%character%<link name>.Class Names: select this checkbox to search among functions-constructors.
Text Strings: select this checkbox to perform a textual search in the contents of the objects.
Snapshot Object IDs: select this checkbox to search among the unique identifiers of objects. V8 assigns such a unique identifier in the format to each object when the object is created and preserves it until the object is destroyed. This means that you can find and compare the same objects in several snapshots taken within the same session.
In the V8 Heap tool window, object IDs are marked with the
@character@<object id>.Marks: select this checkbox to search among the labels you set to objects manually by clicking
on the toolbar of the Containment tab.
The search results are displayed in the Details pane, in a separate Occurrences of '<search pattern>' view. To have the search results shown grouped by the search scopes you specified, press the Group by Type toggle button on the toolbar.
When you open the dialog next time, it will show the settings from the previous search.