Getting Started with WebStorm
WebStorm is a powerful IDE for modern JavaScript development. WebStorm provides full support for JavaScript, TypeScript, HTML, CSS as well as for frameworks such as React, Angular, and Vue.js right out of the box, no additional plugins are required.
Besides client-side applications, WebStorm helps you develop server-side applications with Node.js, mobile apps with React Native or Cordova, and desktop apps with Electron. Note that having Node.js is highly recommended although the core WebStorm features are still at your disposal without it.
Open, check out, or create a project
A project in WebStorm is a folder with the source code your edit, the libraries and tools you use (for example, in the node_modules subfolder), and various app configuration files (for example, package.json or .eslintrc). In the .idea subfolder, WebStorm stores its internal configuration settings, for example, for the project code style or the version control system.
To open a project
- On the Welcome Screen, click Open and then select the folder with your application in the dialog that opens.
To check out a project from a version control system
- Click Check out from Version Control on the Welcome screen or choose on the main menu.
- Select your version control system from the list.
- In the VCS-specific dialog that opens, type your credentials and the repository to check out the application sources from.

To create an empty WebStorm project
- Choose on the main menu or click Create New Project on the Welcome screen. The Create New Project Dialog opens.
- In the left-hand pane, choose Empty Project. In the right-hand pane, specify the application folder and click Create.
To create a new file in a project
- In the Project Tool Window, select the folder where you want to create a new file and press Alt+Insert.
- Alternatively, choose on the context menu of the selection and then choose the file type from the list:

Get familiar with the WebStorm user interface
The WebStorm window consists of the Editor where you read, create, and modify your code, menus and toolbars, a navigation bar, a status bar, and a number of WebStorm tool windows. These secondary windows are attached to the bottom and to the sides of your workspace and let you debug your code, run tests, interact with your version control system, etc. 
You can organize the layout of WebStorm as you like. For example, if you want to focus on writing your code, try the Distraction Free Mode. It removes all toolbars, tool windows, and editor tabs, so you have more free space. To switch to this mode, choose on the main menu.
An alternative to the Distraction Free Mode may be hiding all tool windows by pressing Ctrl+Shift+F12. You can restore the layout to its default by pressing this shortcut once again.
When the tool windows are hidden, you can access any of them via a shortcut - the input focus moves to the tool window and you can use any keyboard command in its context. To get back to the editor, just press Escape. Below is a list of shortcuts that invoke the tool windows you will most often need:
| Tool Window | Shortcut |
|---|---|
| Project | Alt+1 |
| Version Control | Alt+9 |
| Run | Alt+4 |
| Debug | Alt+5 |
| Terminal | Alt+F12 |
| Editor | Escape |
The Navigation Bar is a compact alternative to the Project Tool Window. To access the Navigation Bar, press Alt+Home. 
In most tool windows and pop-up windows, WebStorm supports speed search which lets you filter a list or navigate to a particular item by using a search query. 
Find your way through
WebStorm comes with a set of search and navigation features that will help you find your way through any code no matter how tangled it is.
Find usages of your project symbols
To find where a particular symbol is used in your project, WebStorm suggests full-scale search via Find Usages (Alt+F7): 
Find your project symbols by their names
You can navigate to a Class (Ctrl+N), a File (Ctrl+Shift+N), or a Symbol (Ctrl+Shift+Alt+N) by its name, see Navigating to Class, File or Symbol by Name.
Search for text fragments
- To find a text fragment in the current file, press Ctrl+F and type the search pattern.
- To search within a directory, any arbitrary scope, or the entire project, press Ctrl+Shift+F and specify the search pattern and the scope.
Go to declaration of a symbol
Go to Declaration (Ctrl+B, Ctrl+Click for Windows and Linux or ⌘+Click for macOS) brings you to the location where a particular symbol is first declared. This type of navigation works from any place in the source code.
Navigate through the timeline
WebStorm automatically keeps track of the changes you make to the source code, the results of refactoring, etc. in the Local History. To view it for a file or a folder, choose on the main menu. Here you can review the changes, revert them (![]() ), or create a patch (
), or create a patch (![]() ):
): 
Complete your code
WebStorm automatically completes keywords, symbols from standard language API's and from the project dependencies. Press Ctrl+Space to get the code completion options for the current context, the members of the current type are shown in bold: 
Inspect and fix your code on the fly
WebStorm monitors your code and tries to keep it accurate and clean. It detects potential errors and problems and suggests quick-fixes for them. Every time WebStorm finds unused code, an endless loop, a missing import statement for a symbol, and many other things that probably require your attention, you’ll see a highlight and a light bulb. Click this bulb or press Alt+Enter to apply a fix.
You forgot an import statement? 

For ES6 and TypeScript symbols, WebStorm can add missing import statements on code completion: 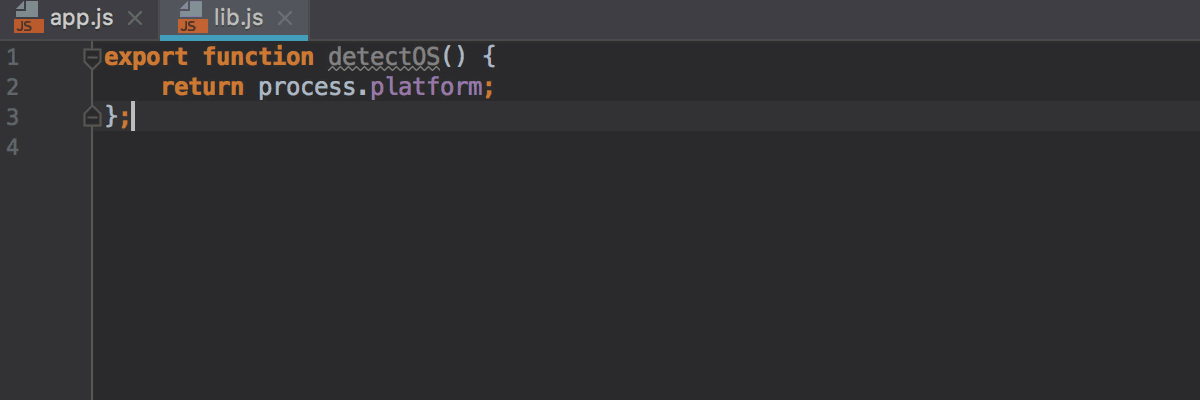
To see the full list of available inspections, in the Settings dialog (Ctrl+Alt+S), click Inspections under Editor. You can disable some of them, or enable others, plus you can adjust the severity of each inspection. You decide whether it should be considered an error or just a warning.
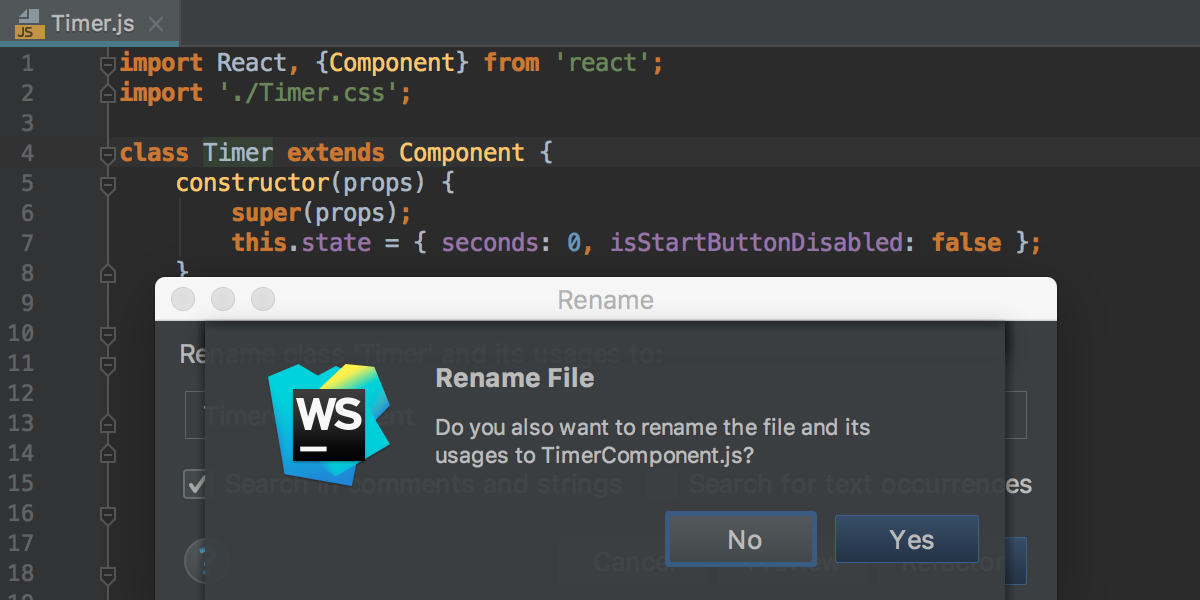
Refactor your code
Refactoring means updating the source code without changing the behaviour of the application. Refactoring helps you keep your code solid, dry, and easy to maintain. WebStorm ensures that after refactoring the code works in the same way as before it, because changes are made smartly to the whole project. For example, if you rename a class, WebStorm automatically renames all its usages and import statements.
- In the editor or in the Project tool window, select the expression or symbol to refactor, and press Ctrl+Shift+Alt+T
- From the Refactor This pop-up list, choose the required refactoring.
Run and debug your application
In WebStorm, the entry point to running or debugging an application is a run/debug configuration. WebStorm comes with a number of predefined run/debug configuration templates for different types of applications and files. The information you need to provide in a configuration depends on its type, it can be a file to run or a test. Some configurations can attach to already running applications, in this case you need to specify the URL and port to attach to.
To run your application
- Create a run configuration of the type that fits your app and click
 .
. - In some cases, you can run your app or file without creating a run configuration, WebStorm can do it for you. For example, to run any file with Node, just choose Run <file_name> on its context menu or press Ctrl+Shift+F10. This also works for an HTML file, WebStorm just opens it in the browser.
- If your project has an npm script that starts your application in the development mode or builds it, just open your project
package.jsonin the editor, click in the gutter next to the starttask, and choose Run 'start' from the list:
To start debugging
With WebStorm, you can debug various kinds of applications - client-side applications, Node.js applications, tests, etc. Here's how you can debug client-side JavaScript running on an external development web server, e.g. powered by Node.js.
- Set the breakpoints in the JavaScript code, as required.
- Run the application in the development mode, possibly with
npm startas described above, and copy the URL address at which the application is running in the browser. - Choose on the main menu, click
 on the toolbar and select JavaScript Debug from the pop-up list. In the Run/Debug Configuration: JavaScript Debug dialog that opens, specify the URL address at which the application is running. This URL can be copied from the address bar of your browser as described in Step 2 above.
 - Choose the newly created configuration in the Select run/debug configuration drop-down list on the toolbar and click
 . The URL address specified in the run configuration opens in the browser and the Debug tool window appears.
 - In the Debug tool window, proceed as usual: step through the program, stop and resume the program execution, examine it when suspended, view actual HTML DOM, etc.
Follow your code style standards
WebStorm automatically formats all the new code according to the code style settings that are specific to each language. You can configure the code style yourself or apply the code style rules from the TSLint or ESLint configuration files. Learn more from Activating and configuring TSLint in WebStorm and Importing code style from ESLint.
To reformat your code according to the project code style settings, select a code fragment or an entire file and press Ctrl+Alt+L.
Keep your source code under Version Control
If you are keeping your source code under version control, you will be glad to know that WebStorm integrates with many popular version control systems, like Git (or GitHub), Mercurial, Perforce, TFS, Subversion and CVS. In most cases WebStorm detects your VCS automatically. To specify your credentials and any settings, go to Version Control page of the Settings dialog (Ctrl+Alt+S).
The menu will give you a clue about what commands are available. In the Version Control Tool Window (Alt+9), you can view and track the changes you and your teammates make, crate changelists, commit and push your changes, and much more.
The most used operations, like Commit, Push, View History are also available from the VCS Operations popup (Alt+`).
Customize your environment
Feel free to tweak WebStorm so it suits your needs perfectly and is as helpful and comfortable as it can be.
Appearance
The first thing to fine-tune is the general "look and feel". The default WebStorm theme is light. If you prefer a darker environment, in the Settings/Preferences dialog (Ctrl+Alt+S), click Appearance under Appearance and Behavior, and then choose Darcula.
Editor
You can also adjust every aspect of the editor’s behavior, for example, enable or disable Drag'n'Drop, customize the behavior of editor tabs, configure highlighting for each supported language, edit the code folding settings, change the code completion policy, and much more. To customize an editor's feature, press Ctrl+Alt+S and in the Settings/Preferences dialog, choose the relevant page under Editor.
Keymap
WebStorm is a keyboard-centric IDE, which means that almost any action in it is mapped to a keyboard shortcut. WebStorm comes with a default keymap which you can always change it to fit your habits as described in Configuring Keyboard Shortcuts, just press Ctrl+Alt+S and choose Keymap under Appearance and Behavior.