Debugging
This section describes the procedures that are common for various types of applications.
WebStorm provides a full range of facilities for debugging your source code:
Breakpoints in HTML and JavaScript.
Multiple simultaneous debugging sessions.
Customizable breakpoint properties: conditions, pass count, and so on.
Runtime evaluation of expressions.
If you want to see the list of all currently debugging applications, select from the main menu. Refer to the Viewing Running Processes section for details.
Start a debugging session
To debug CoffeeScript, TypeScript, and Dart code, you need to generate a source map for it. This will set the correspondence between lines in your original code and in the generated JavaScript code. If no source map is generated, your breakpoints will not be recognized and processed correctly.
Define a run/debug configuration for the application to be debugged.
Create a breakpoint.
Click the Debug <configuration_name> button
 . Learn more from Starting the Debugger Session.

After you've started a debug session, the ![]() icon that marks the Debug tool window toggles to
icon that marks the Debug tool window toggles to ![]() to indicate that the debug process is active.
to indicate that the debug process is active.
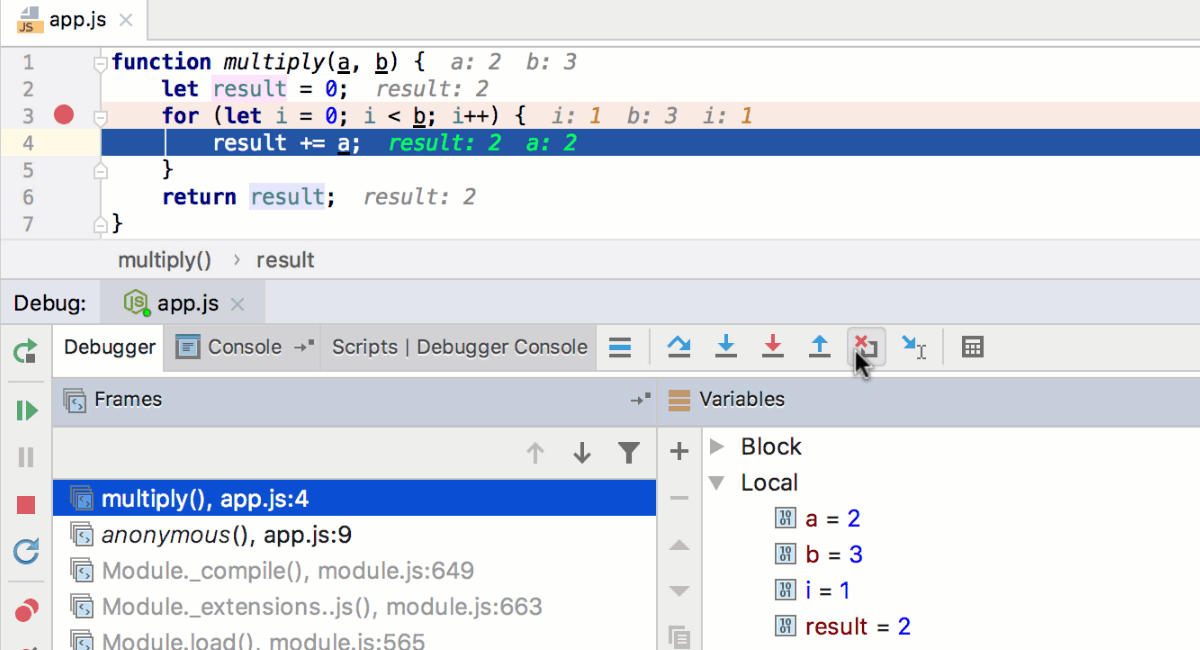
During a debugging session, you can pause or resume the application, step through the breakpoints, evaluate expressions, change values on-the-fly, examine the suspended program, and set watches.
Debugger session
Drop frame
In case you want to “go back in time” while debugging JavaScript or Node.js you can do it via the Drop Frame action. This is a great help if you mistakenly stepped too far. This will not revert the global state of your application but at least will get you back by stack of frames.
Run to cursor
Create a breakpoint.
Run a debugging session. To run a debugging session, click the Run Application icon (
 ) in the gutter area and select Debug <configuration_name>.
To stop code execution at the cursor position without adding another breakpoint, click the Run to cursor icon (![]() ) or press Alt+F9. Alternatively, you can click the line number in the gutter area.
) or press Alt+F9. Alternatively, you can click the line number in the gutter area.

The icon ![]() is described in the toolbar reference of the Debug tool window.
is described in the toolbar reference of the Debug tool window.
Mark object
To add a colored label to an instance, press F11 or the context menu in the Variables and Watches tabs.

The next time this instance appears in Watches, Variables or Evaluate expression, you will see the label:

Evaluate expression
In the debug mode, you can evaluate an expression by pressing Alt+F8.

The Evaluate dialog supports code completion.
To see how the behavior of various function calls changes during your debugging session, set custom watches. You can read more about watches in Adding, editing and removing watches.

If you have any instances marked with labels, code completion will offer you its names so you can evaluate them:

Refer to the section Evaluating Expressions for details.
Configuring debugger settings
To change debugger settings, click . In the Settings menu, click .
Useful debugger shortcuts
Action | Hotkey |
|---|---|
| Toggle breakpoint | Ctrl+F8 |
| Resume program | F9 |
| Step over | F8 |
| Step into | F7 |
Stop | Ctrl+F2 |
| View breakpoint details/all breakpoints | Ctrl+Shift+F8 |
Debug code at caret | Shift+F9 (within the main method), or Shift+Alt+F9 |