Step through the program
Stepping is the process of controlling step-by-step execution of the program.
WebStorm provides a set of stepping actions, which are used depending on your strategy (for example, whether you need to go directly to the next line or enter the methods invoked on your way there).
The stepping buttons are located on the Debug tool window toolbar.

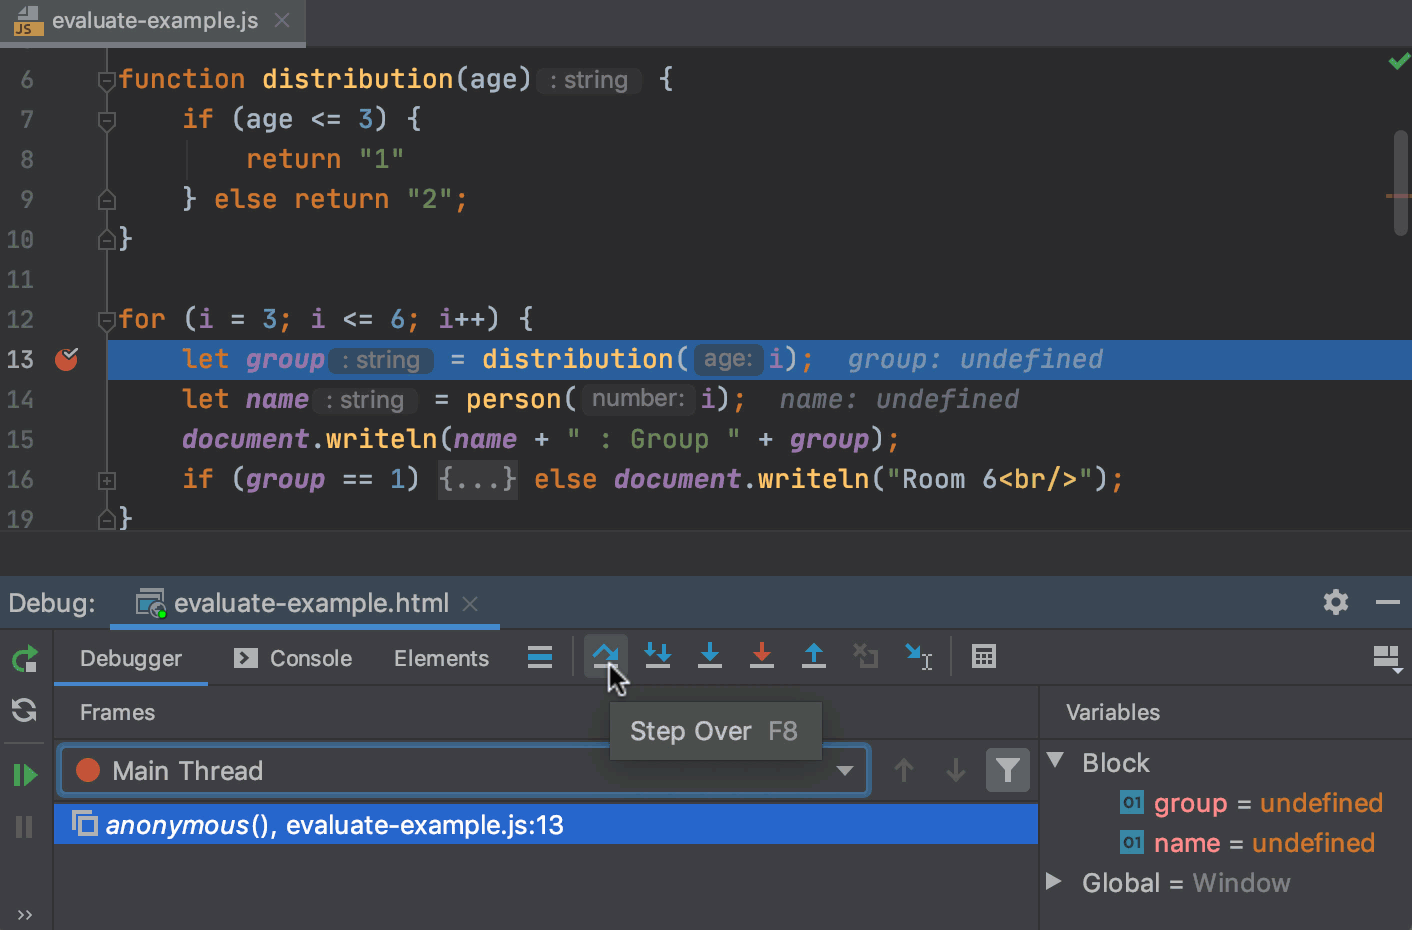
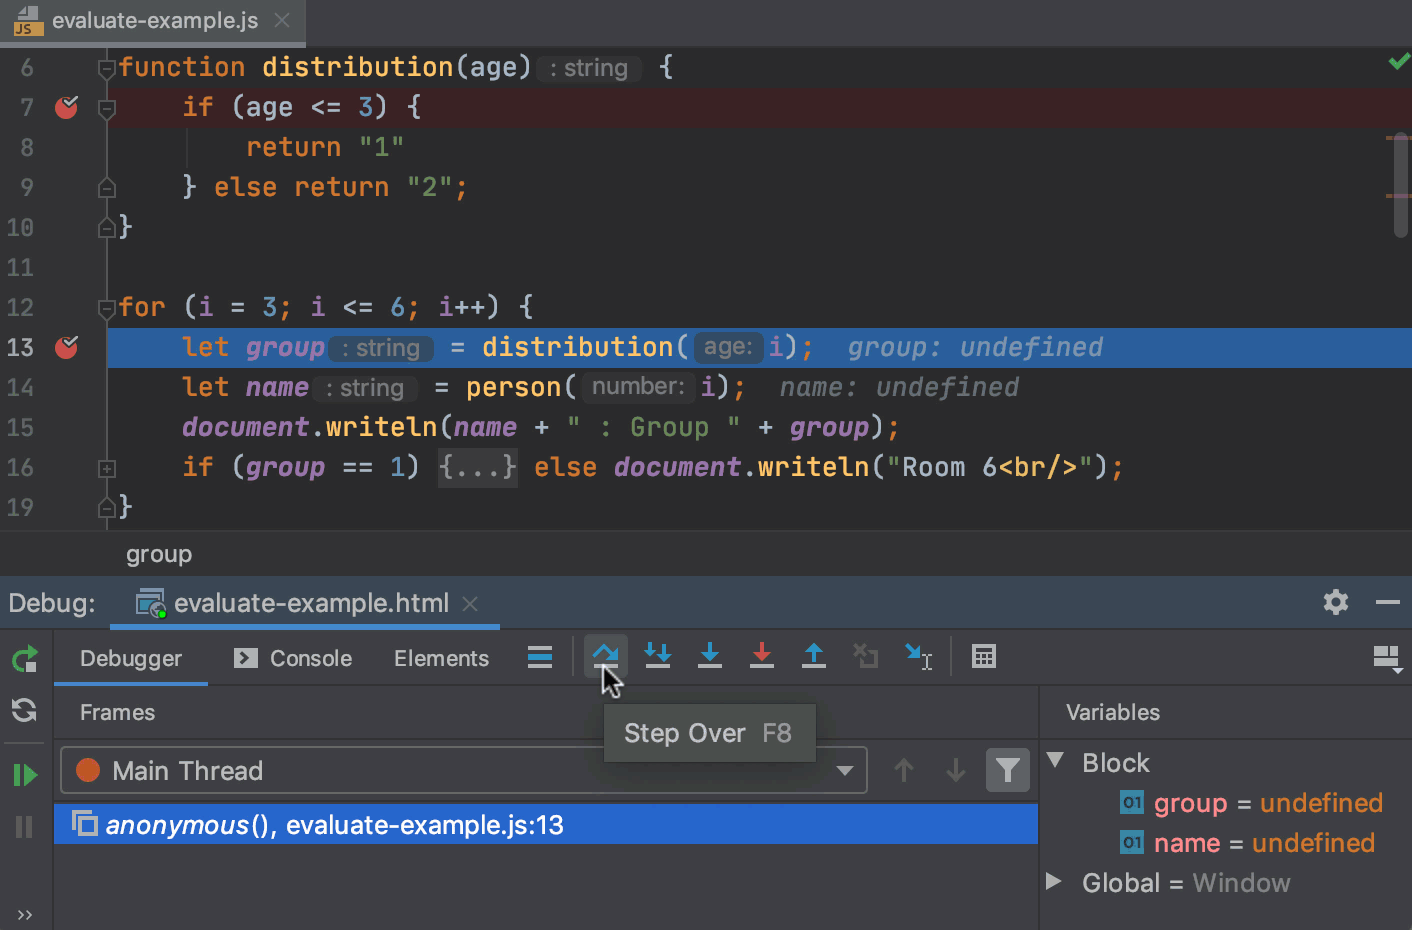
Step over
Steps over the current line of code and takes you to the next line even if the highlighted line has method calls in it. The implementation of the methods is skipped, and you move straight to the next line of the caller method.
-
Click the Step over button
 or press F8.
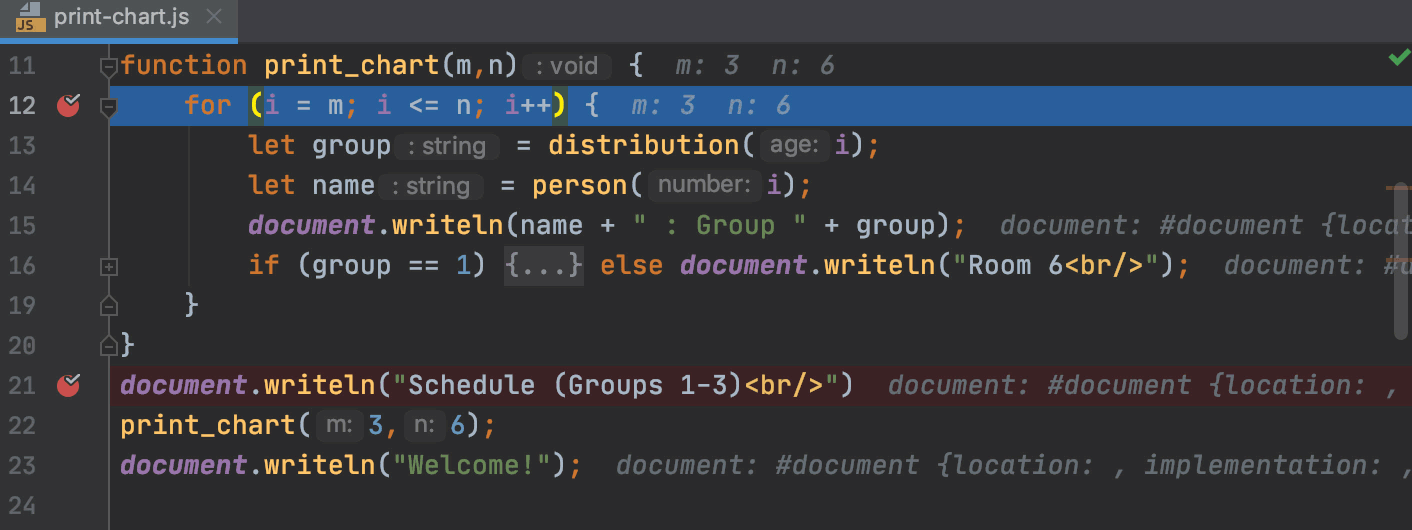
In the example, line 13 is about to be executed. If you step over, the debugger will move straight to line 14 without jumping into the distribution() method.
If there are breakpoints inside the skipped methods, the debugger will stop at them. To skip any breakpoints on the way, use Force step over.
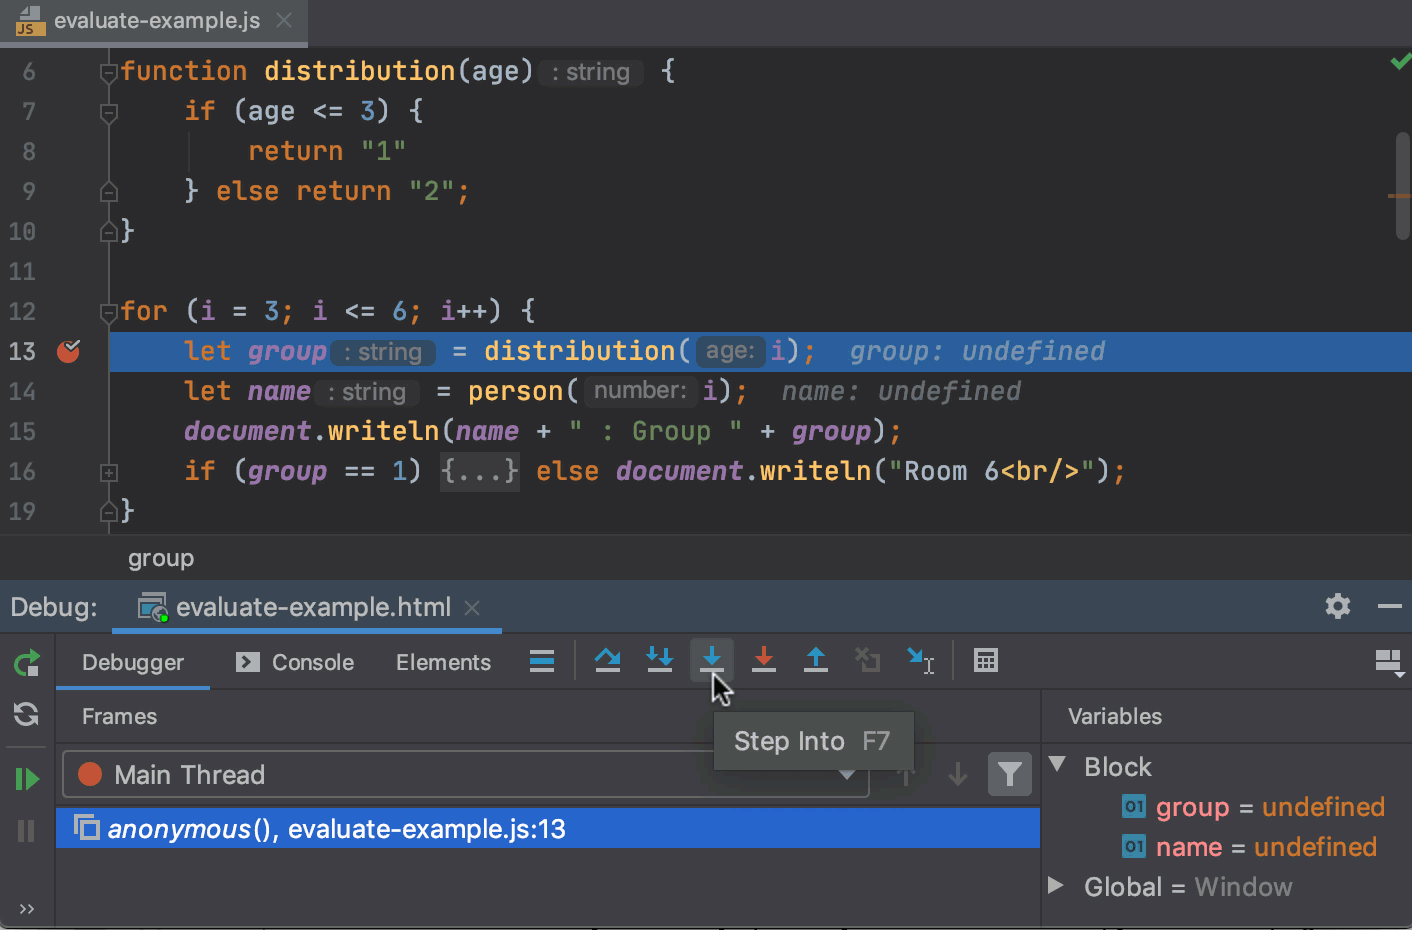
Step into
Steps inside the code of a called function.
-
Click the Step into button
 or press F7.
In the example, line 13 is about to be executed. If you step into, the debugger will jump into the implementation of the distribution() method allowing you to examine in detail how its result is produced.
If there are several method calls on the line, WebStorm asks you which method to enter. This feature is called Smart step into.
You can configure Smart Step Into to be automatically used every time when there are multiple method calls on the line. Alternatively, it can be invoked only when you expressly do so.
Some scripts are skipped by Step into as you normally don't need to debug them. This list can be fine-tuned on the page of the Settings/Preferences dialog Ctrl+Alt+S. In the Settings/Preferences dialog Ctrl+Alt+S, go to . The Debugger. Stepping page opens. To skip all library scripts, select the Do not step into library scripts checkbox. To suppress stepping into some specific scripts, select the Do not step into scripts checkbox and create a list of such scripts using the toolbar buttons.
Smart step into
Smart step into is helpful when there are several method calls on a line, and you want to be specific about which method to enter. This feature allows you to select the method call you are interested in.
From the main menu, select or press Shift+F7.
-
Click the method. You can also select it using the arrow keys or tabs and press Enter/F7.
You can configure Smart step into to be used instead of the regular Step into every time there are multiple method calls on the line. This is done in .
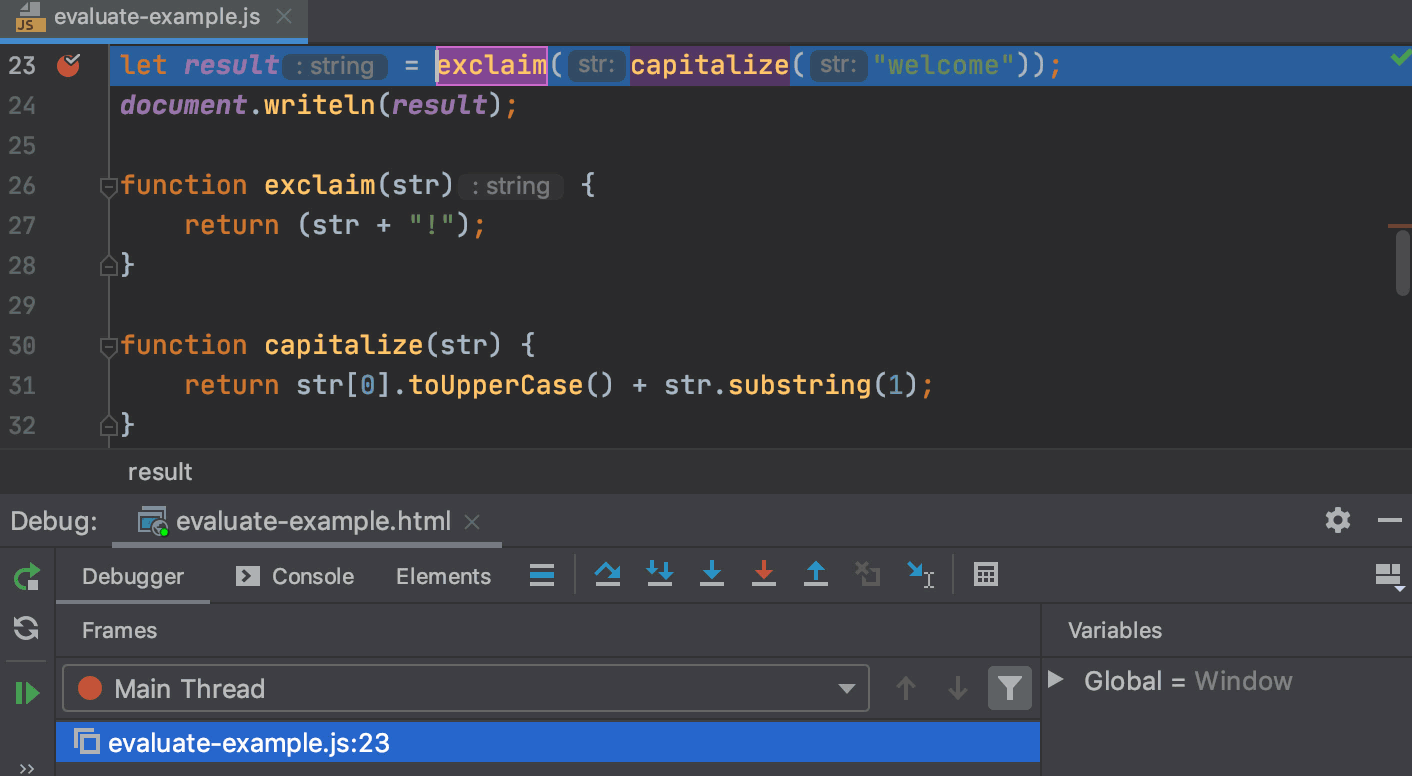
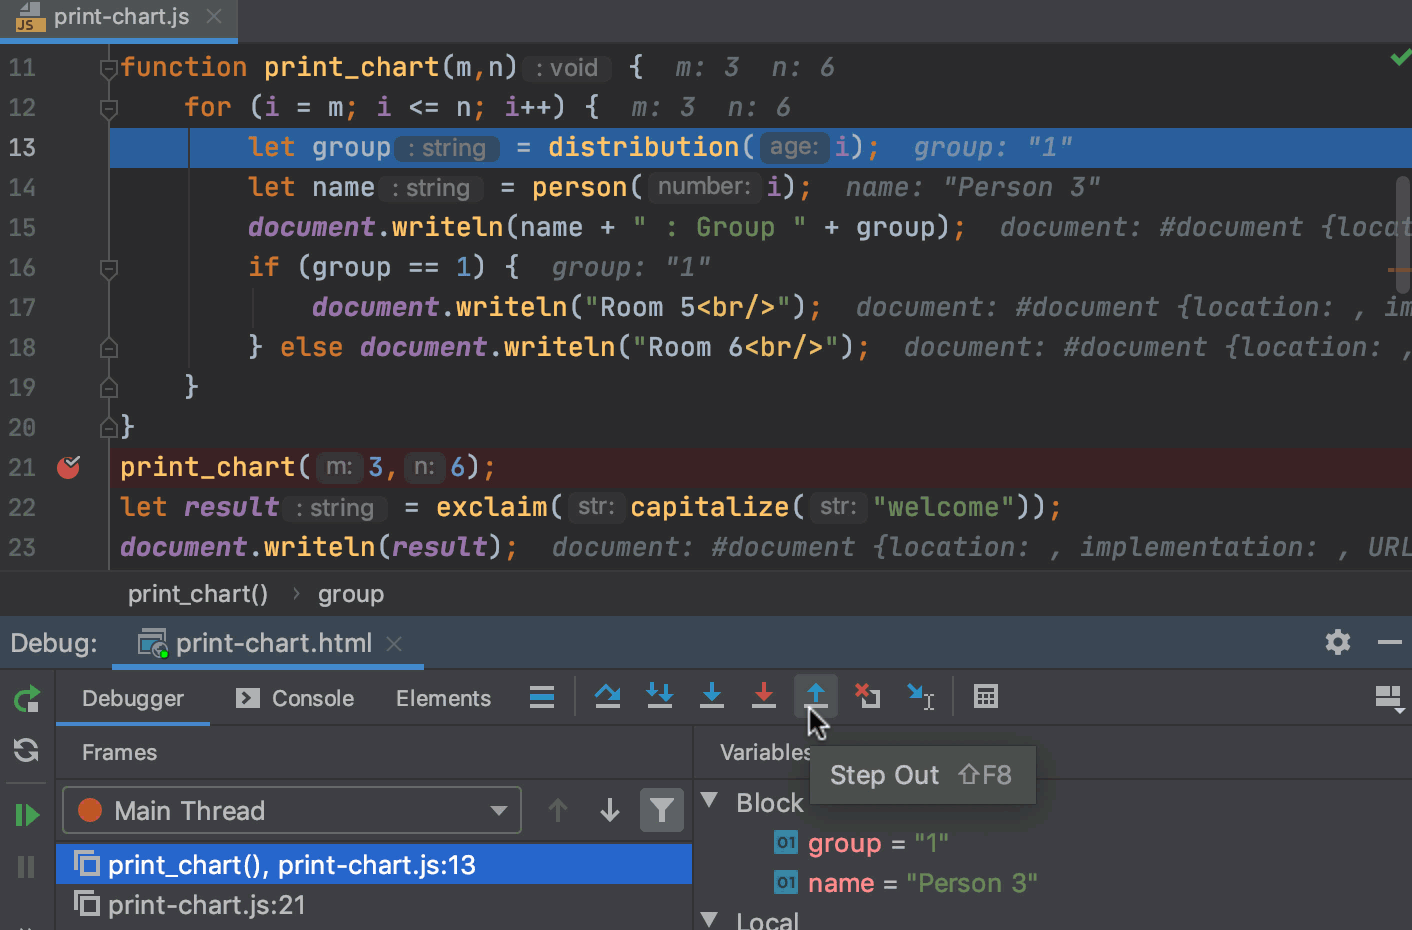
Step out
Steps out of the current method and takes you to its call.
-
Click the Step out button
 or press Shift+F8.
In the example, stepping out skips all iterations of the loop and takes you straight to its call.
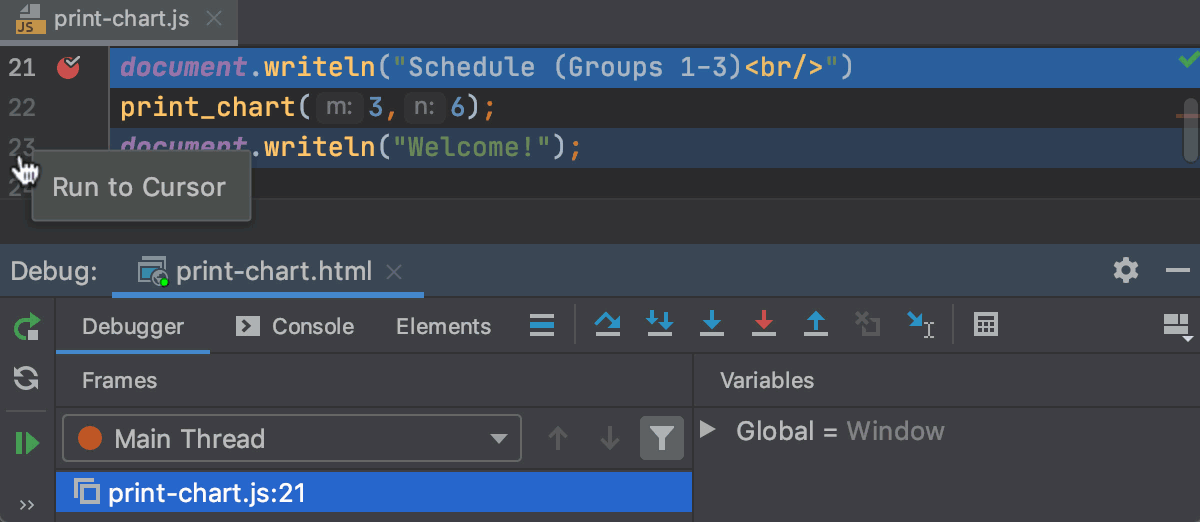
Run to cursor
Continues the execution until the position of the caret is reached.
-
Place the caret at the line where you want the program to pause and click
 or press Alt+F9.
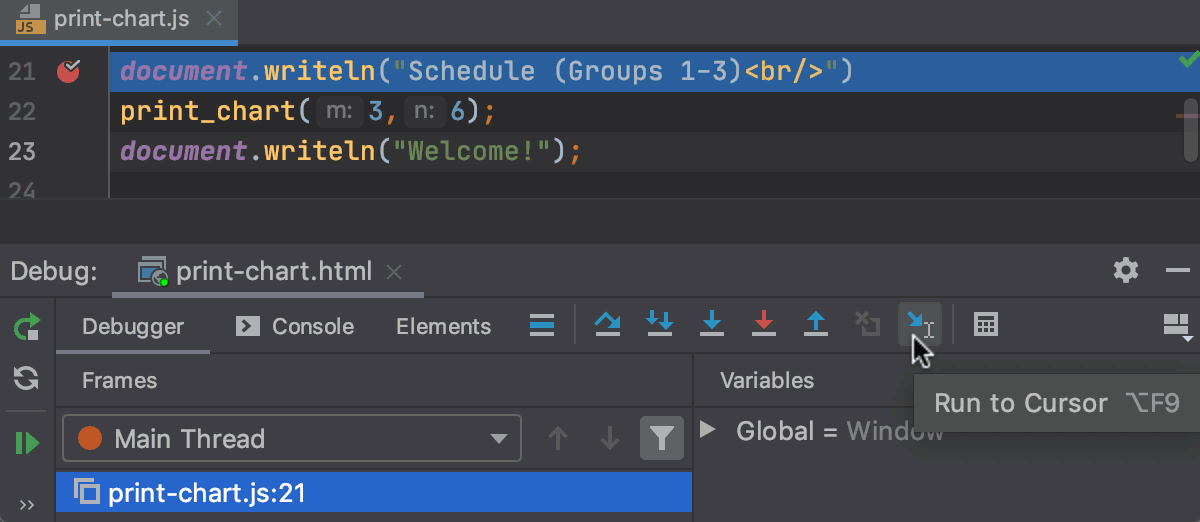
-
Click the line number in the gutter.
Run to Cursor on clicking the line number is active by default. To turn it off, open the Settings/Preferences dialog Ctrl+Alt+S, go to , and clear the Click line number to perform run to cursor checkbox.
In the example, Run to cursor will continue the execution and stop at line 7 as if there were a breakpoint. If there are breakpoints in the print_chart() method, the program will be suspended there.
To skip any breakpoints on the way, use Force run to cursor.
Force step into
Steps in the method even if this method is skipped by the regular Step Into.
Click the Force step into button
 or press Shift+Alt+F7.
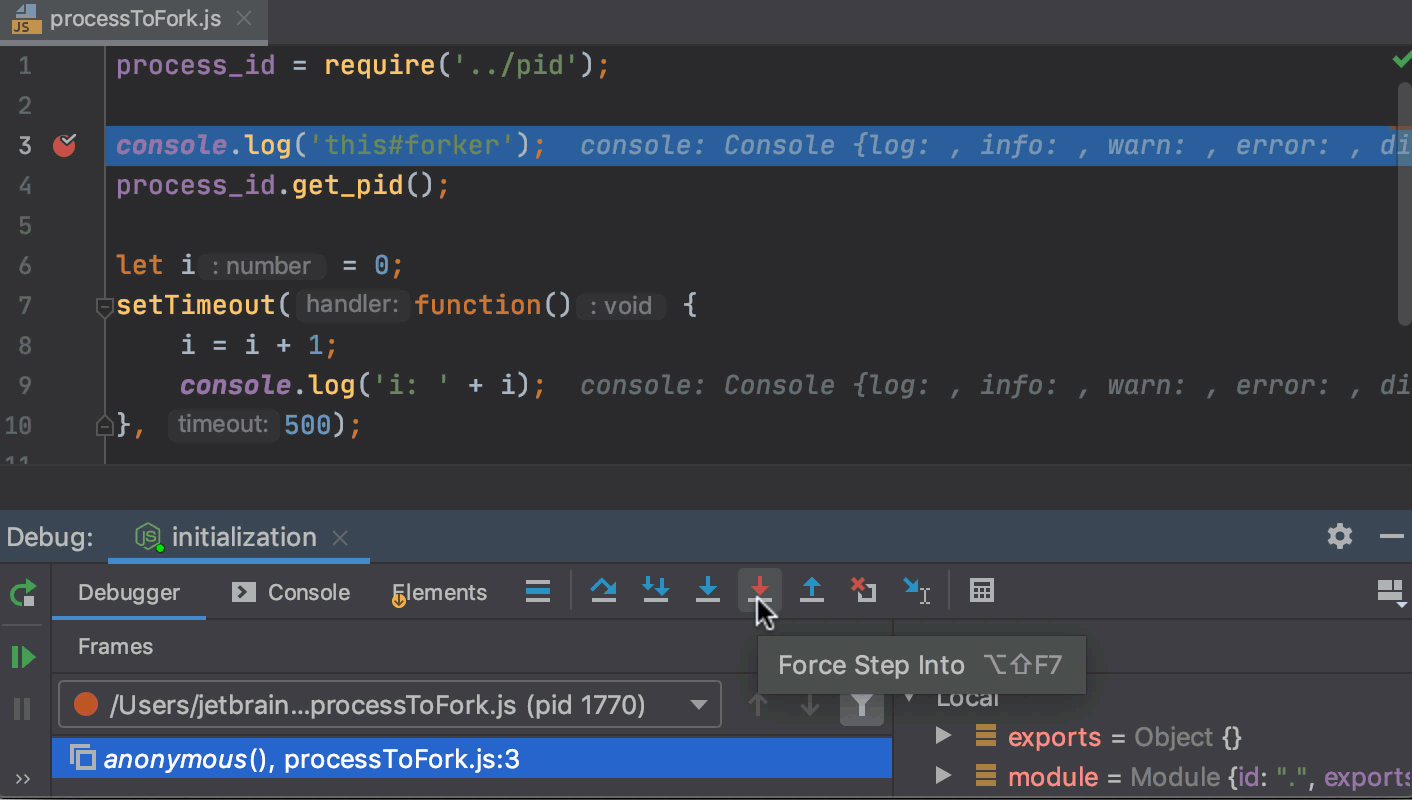
In the example, the program stops before the line with a call of console.log(), which is a method from a library. With Force Step Into, we jump right into the implementation of the console.log() method, while the regular Step Into would take us to line 4.
Force run to cursor
Continues the execution until the position of the caret is reached. All breakpoints on the way are ignored.
Place the caret at the line where you want the program to pause.
From the main menu, select or press Ctrl+Alt+F9.
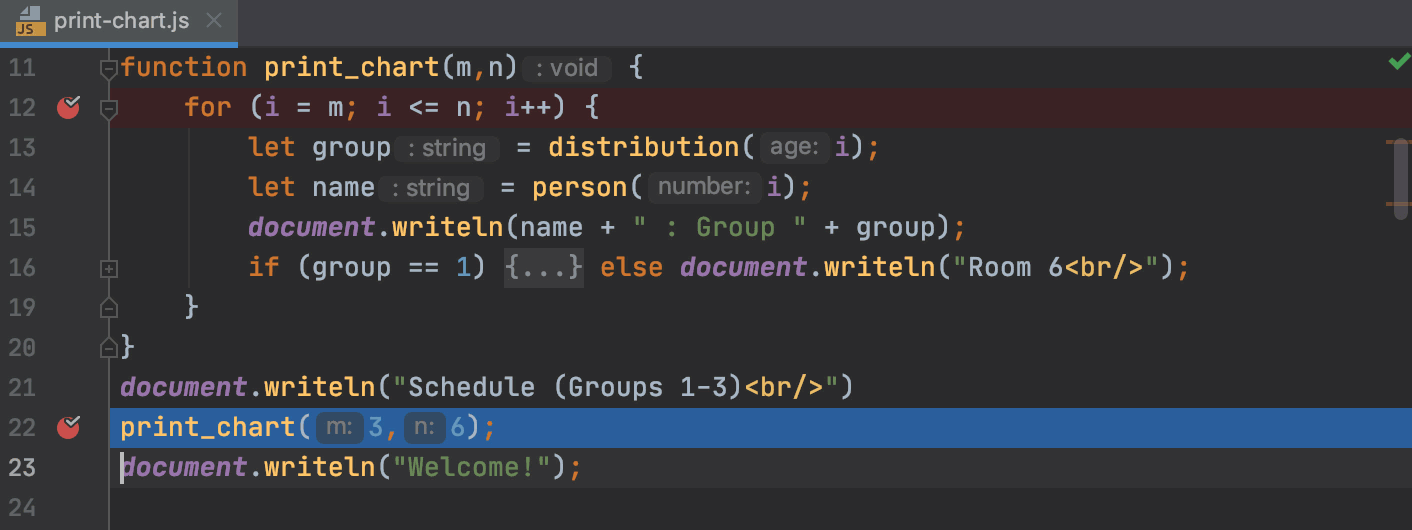
In the example, Force run to cursor will continue the execution and stop at line 23 as if there were a breakpoint. The breakpoint inside print_chart() will not have any effect.
Force step over
Steps over the current line of code and takes you to the next line even if the highlighted line has method calls in it. If there are breakpoints in the called methods, they are ignored.
From the main menu, select or press Shift+Alt+F8.
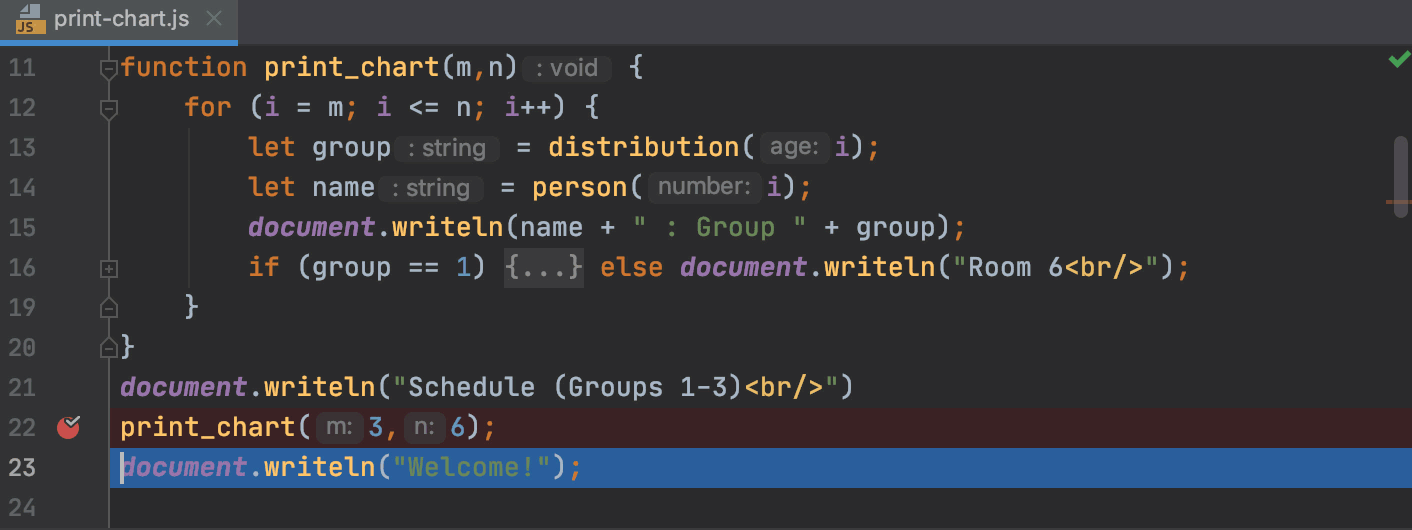
In the example, stepping over takes you to the print statement on line 23 even though there is a breakpoint in the print_chart() method, which would otherwise suspend the application in all iterations of the loop.
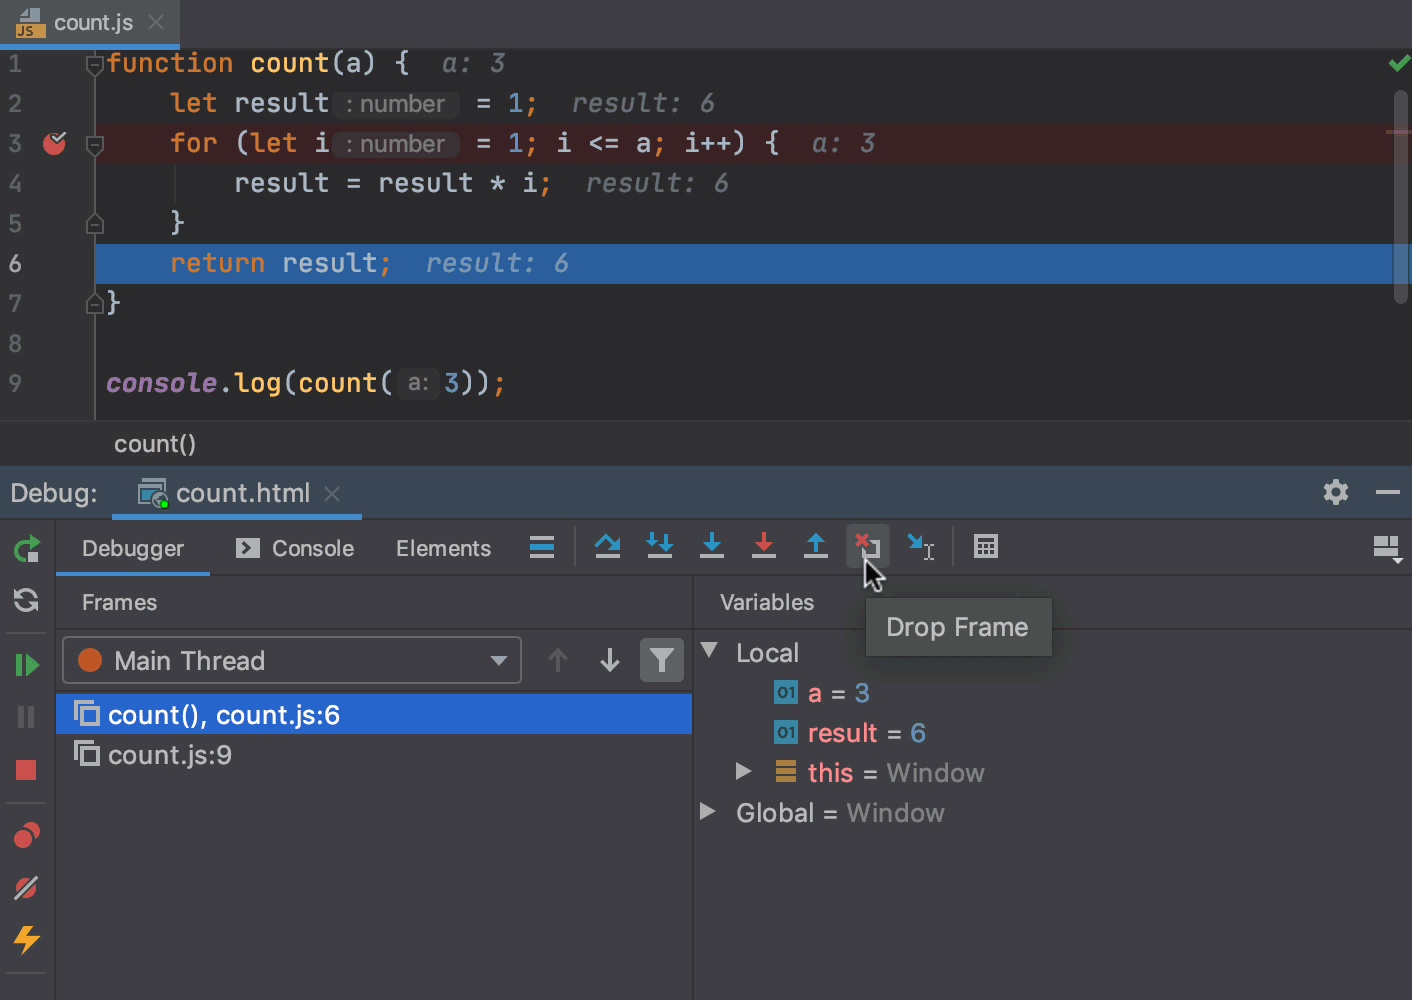
Drop frame
Allows you to undo the last frame and restore the previous frame in the stack. When debugging JavaScript and Node.js, this can be helpful to re-enter a function if you missed a critical spot you would like to see again.
-
Click the Drop Frame button
 .
. -
To restore the dropped frame, click
 or press F9.
When you resume the program, WebStorm reverts the local variables to their values before the dropped frame was executed. Note that values of static and instance variables are not restored, which may alter the entire program flow.
In the example, dropping the frame returns you to the call of count() as if count () has never been executed. However, when you resume the program, the initial values of local variables result and i are restored.