Start the debugger session
Any debugger session is based on a run/debug configuration. The configuration type depends on the type of your application and the runtime environment.
You can run several debugger sessions with different configurations at a time.
Through a configuration you do not only launch your application but can also tell WebStorm to use some parameters or perform some actions before the application starts. For example, you can pass Node.js-specific command line options to the Node.js executable file.
Before debugging
Set the breakpoints in your code.
To debug code compiled to JavaScript, you need to generate a source map for it. This will set the correspondence between lines in your original code and in the generated JavaScript code. If no source map is generated, your breakpoints will not be recognized and processed correctly.
Source maps are required for debugging TypeScript, Dart, CoffeeScript, JavaScript with JSX, ES6 and newer versions etc.
Start debugging
Select the required configuration from the Select run/debug configuration list on the toolbar and click
 next to the list.
If your application consists of an HTML file with a reference to JavaScript code and the application is running on the built-in server, just open this HTML file or select it in the Project tool window and then select Debug <HTML_file_name> from the context menu. WebStorm generates a temporary debug configuration and starts a debugging session through it.

If your application is running in the development mode on
localhost, you can start debugging it from the built-in Terminal (Alt+F12), from the Run tool window, or from the Debug tool window. Just hold Ctrl+Shift and click the URL at which the application is running.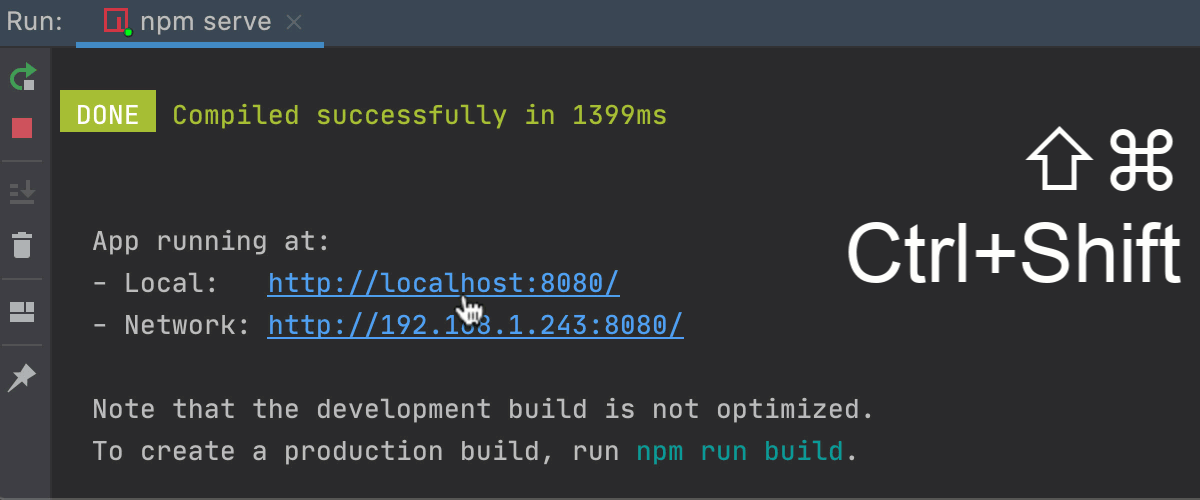
Learn more from Debug a Vue.js application, Debug an Angular application, and Debug a React application.
You can also attach the debugger to a running Node.js application from the built-in Terminal (Alt+F12) or from the Run tool window. To start debugging, hold Ctrl+Shift and click the URL link in the information message
Debugger listening <host>:<port>.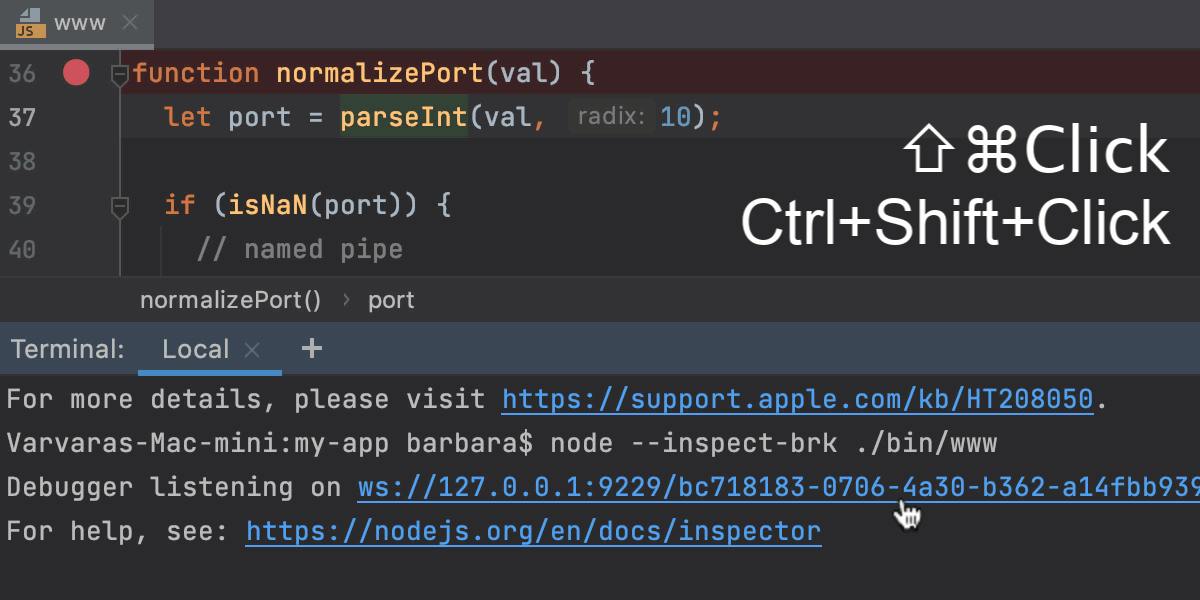
Learn more from Debugging a running Node.js application.
Note that after you launch a debugger session, the ![]() icon that marks the Debug Tool Window toggles to
icon that marks the Debug Tool Window toggles to ![]() to indicate that the debugging process is active.
to indicate that the debugging process is active.
Pause/Resume a debugger session
When the debugger session is running, you can pause/resume it as required using the buttons on the toolbar of the Debug tool window:
To pause a debugger session, click
 .
.To resume a debugger session, click
 F9.
F9.
Restart a debugger session
Click the Rerun button in the Debug tool window or press Ctrl+F5.

Terminate a debugger session
Click the Stop button in the Debug tool window. Alternatively, press Ctrl+F2 and select the process to terminate (if there are two or more of them).

Productivity tips
- Debug non-responding applications
- In case your application hung, pause the session to let the debugger get the information about its current state. You can then examine the program state and locate the cause of the problem.
- Do more with pause
- When you need to evaluate an expression, and WebStorm doesn't let you do that because you didn't stop at a breakpoint, you can advance your program a line further by stepping. After this, you will be able to use the debugger as if you had stopped at a breakpoint. While in some cases this may not be a valid solution, it may sometimes help you out.
- Run before-launch tasks
- Configure running external tools or performing other actions before every debugging session. This before-launch task can be running a Gulp or Grunt task or an NPM script, compiling your TypeScript code into JavaScript or running all the currently active File Watchers to compile or compress your code, uploading your sources to a remote server, and many more, depending on the language and frameworks you are using.