Problems tool window
The tool window shows problems detected through continuous analysis of your code. For each error, WebStorm shows a brief description and the number of the line where the error occurred.
To navigate to the code in question, double-click the corresponding error message or select it and choose Jump to Source from the context menu.
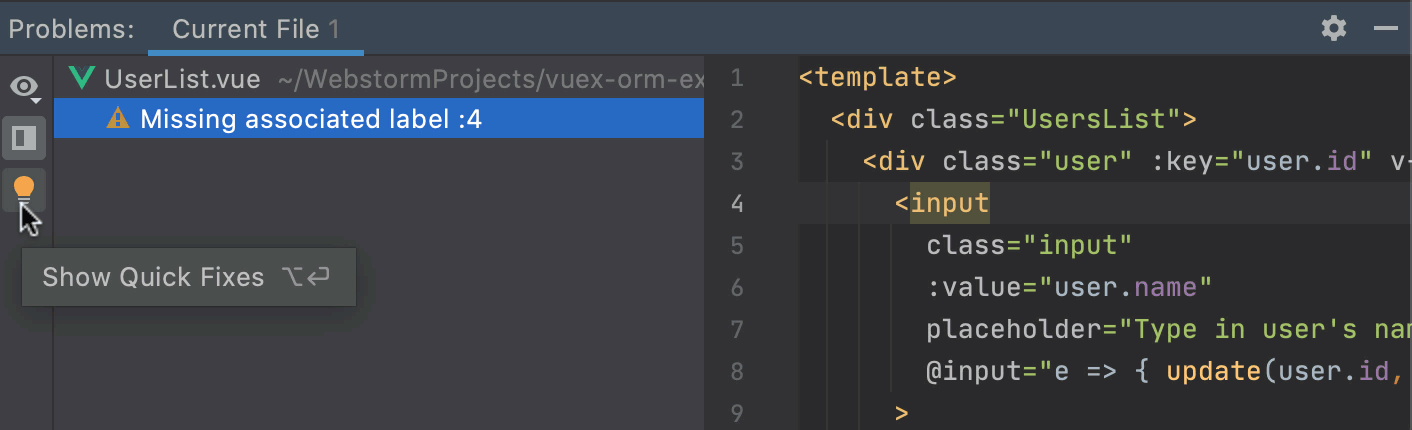
For each problem, you can see the suggested quick-fix by pressing Alt+Enter or by clicking ![]() . You can also jump to the corresponding line in the editor by pressing F4 or by double-clicking the problem in the tool window.
. You can also jump to the corresponding line in the editor by pressing F4 or by double-clicking the problem in the tool window.
Alternatively, click ![]() to be able to view and fix problems in the tool window.
to be able to view and fix problems in the tool window.
Learn more from Run inspections.
The tool window also shows problems detected by linters and suggests quick-fixes for them, see JavaScript linters for details.

When the TypeScript Language Service is activated on the TypeScript page as described in TypeScript, the tool window shows discrepancies in the code detected by the TypeScript Language Service.
The Problems tool window consists of two tabs:
The Current File tab shows the errors detected in the file from the active editor tab.

The Project Errors tab shows the errors across the entire project (for TypeScript) or in all previously opened files in other context, with error messages grouped by files in which they were detected.

To open the Problems tool window, click the Inspections widget in the upper-right corner of the editor.

Alternatively select from the main menu or press Alt+6.
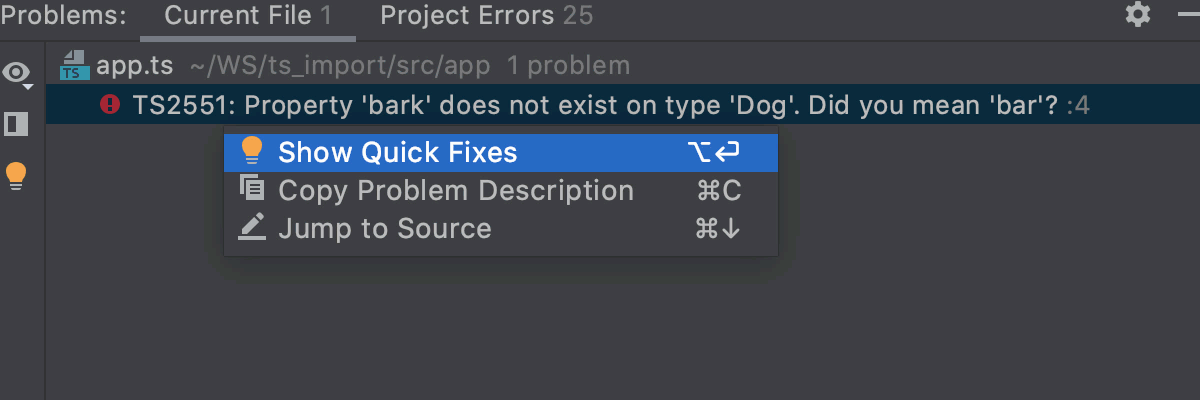
To view suggested quick-fixes for a problem, select the corresponding error message and then select Show Quick Fixes from its context menu, or click
 on the toolbar, or just press Alt+Enter.
 To fix a problem, select the appropriate quick-fix from the list.
Alternatively, click
 to open the Editor Preview pane and fix the problem manually there, without leaving the tool window.
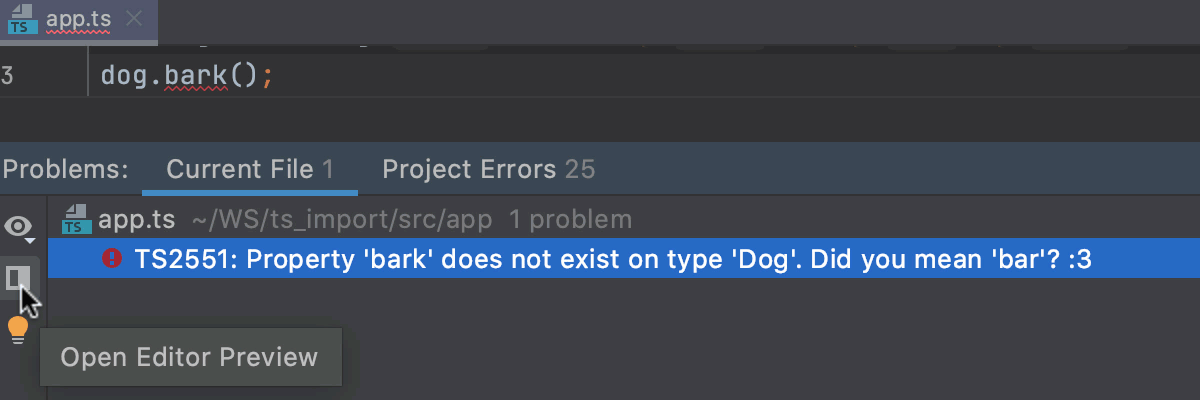
To navigate to the place where an error occurred, double-click the corresponding error message, or select Jump to Source from its context menu, or just press F4.
To filter out error messages by their severity and customize their sorting, click
 and select or clear the relevant items in the list.
To copy an error message, select Copy Problem Description from its context menu or press Ctrl+C.
Toolbar
Item | Tooltip and shortcut | Description |
|---|---|---|
| View Options | Click this button to filter out error messages by their severity and customize their sorting. |
| Open Editor Preview | Click this button to open the Editor Preview pane and fix the problem manually there, without leaving the tool window. |
| Expand all Ctrl+NumPad + Collapse all Ctrl+NumPad - | Use these buttons to have all nodes expanded or collapsed. |
| Show Quick Fixes Alt+Enter | Click this button to show quick fixes for the selected error. |