Chrome DevTools Connect
The Chrome DevTools Connect plugin adds the chrome-devtools-cli skill, thus providing integration between an Air session and Chrome DevTools and allowing agents to access live runtime data and perform browser interactions. The agent opens pages, clicks through user flows, reads console errors and network requests, and checks its own fixes in a real browser before it reports the task as done.
What your agent can do with Chrome DevTools Connect
- Test user flows
Open pages, click, fill and submit forms, and handle dialogs, like a manual end-to-end test with no test scripts to write.
@Chrome Open browser at localhost:3000 in a separate window, click, fill, and submit forms, and handle dialogs- Debug runtime errors
Read console messages and network requests to find what broke, fix the code, and check the page again.
@Chrome reproduce the error from this issue and confirm the fix- See what rendered
Take screenshots and DOM and accessibility tree snapshots.
@Chrome Open browser at localhost:3000, make screenshots, and save them in ./tmp/screenshots- Check responsive layouts and themes
Emulate screen sizes, dark mode, and slow networks.
@Chrome Open browser at localhost:3000 in the dark theme- Find performance issues
Record performance traces to find slow page loads and layout shifts.
@Chrome record a trace and find out why the dashboard loads slowly- Run Lighthouse audits
Check accessibility, SEO, best practices, and agentic browsing, then fix the failures.
@Chrome run a Lighthouse audit and fix the failures
Before you start
Make sure the Air and Chrome DevTools Connect required plugins are enabled on the Settings | Plugins page. For more information, refer to Plugins.
Make sure you have Node.js, version 20.19+, 22.12+, or 23+ installed and added to the
PATHvariable.Make sure your project is trusted.
In the Settings dialog (Ctrl+Alt+S) , go to , and make sure the
chrome-devtools-cliskill is enabled.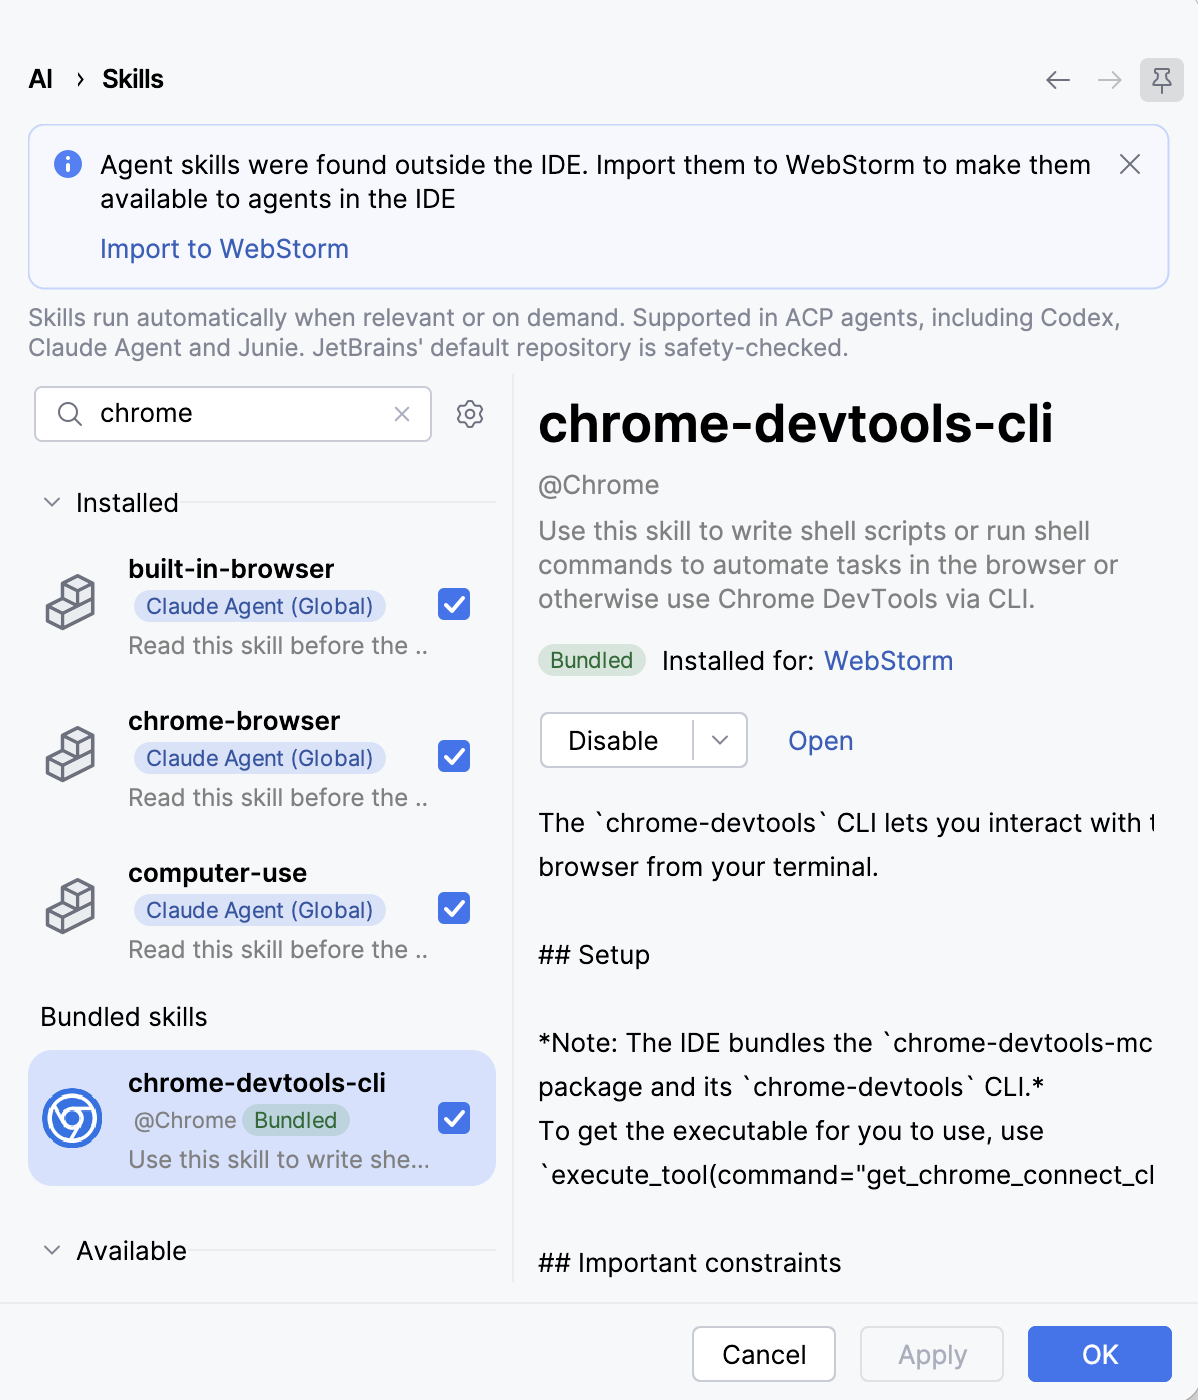
Run your agent with Chrome DevTools Connect
Start a new Air session or switch to the tab with an existing one.
Type your prompt, use the
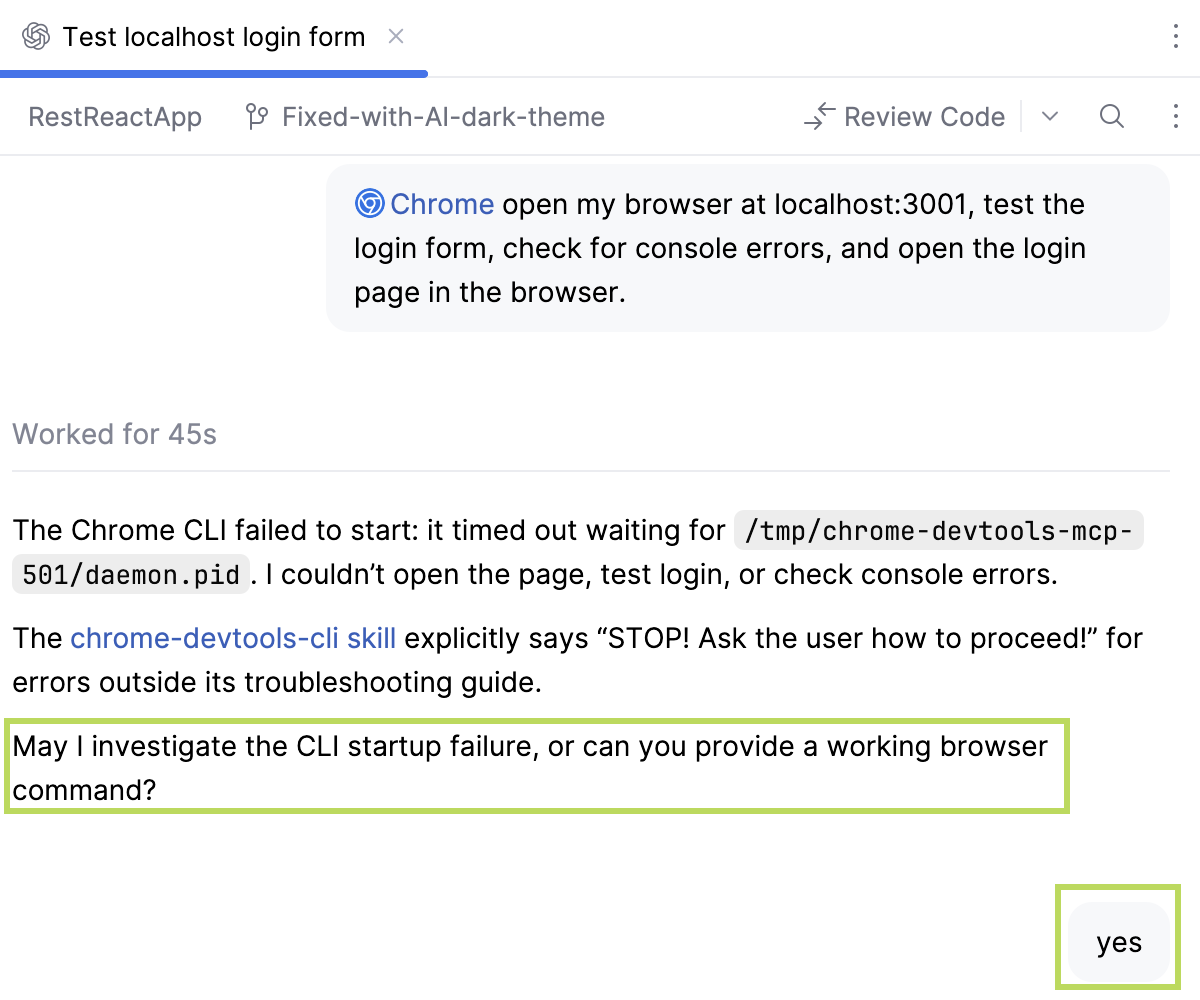
@Chromealias to call thechrome-devtools-cliskill, for example:@Chrome open localhost:3001, test the login form, and check for console errors.The session tab shows a report:
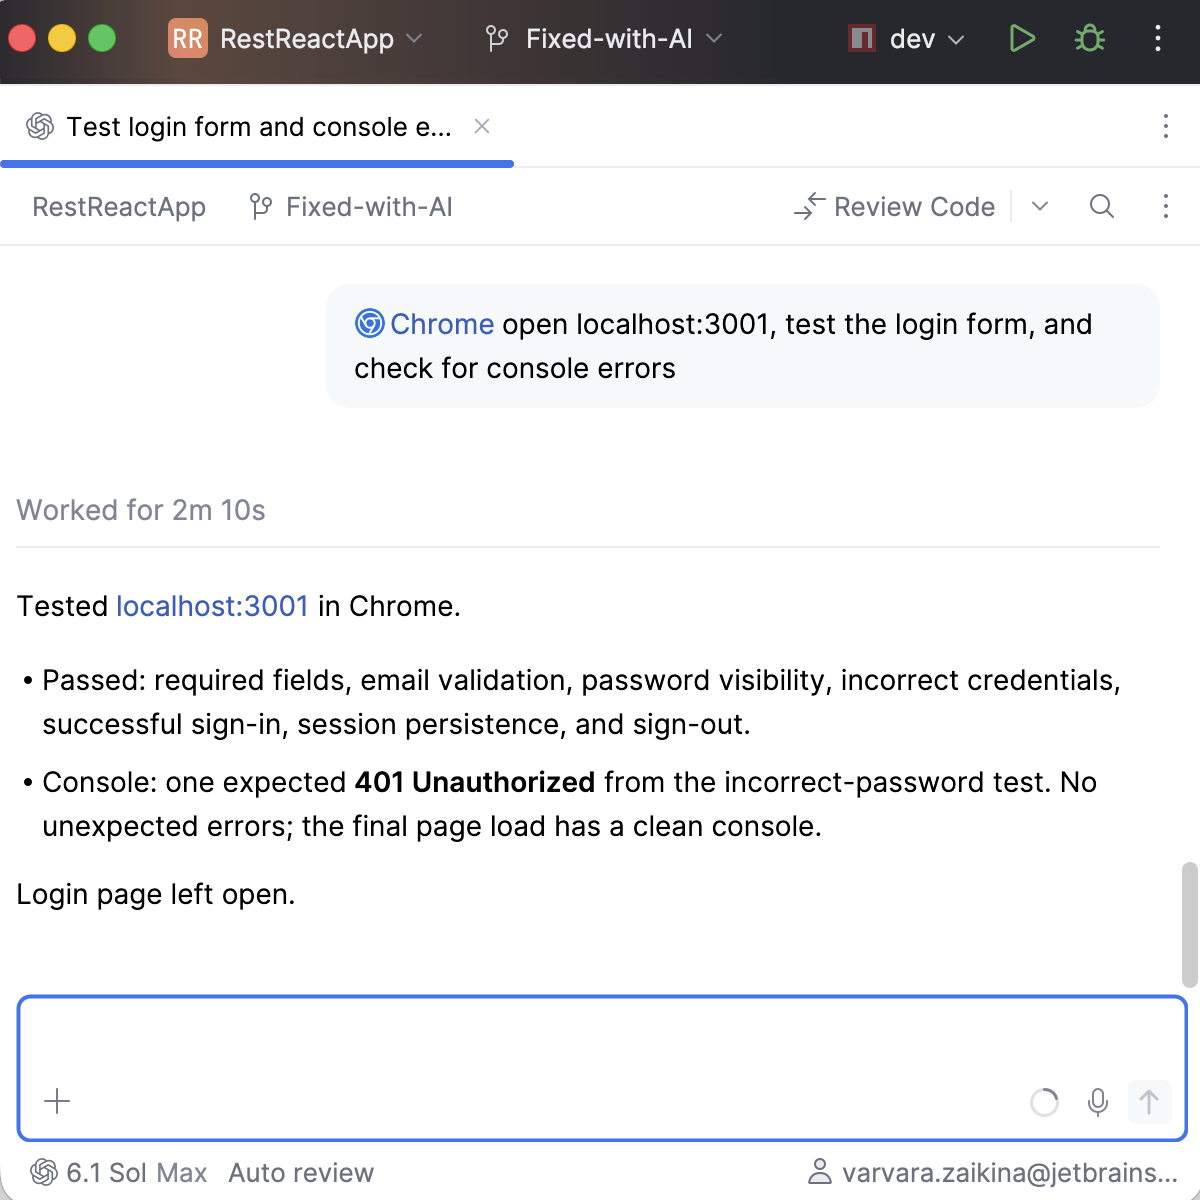
By default, the agent starts its own headless Chrome with a temporary profile.
To have a visible Chrome window opened, add this request to your prompt, for example:
@Chrome open localhost:3001, test the login form, check for console errors, and open the login page in the browser.The session tab shows a report and opens the
loginpage in the browser: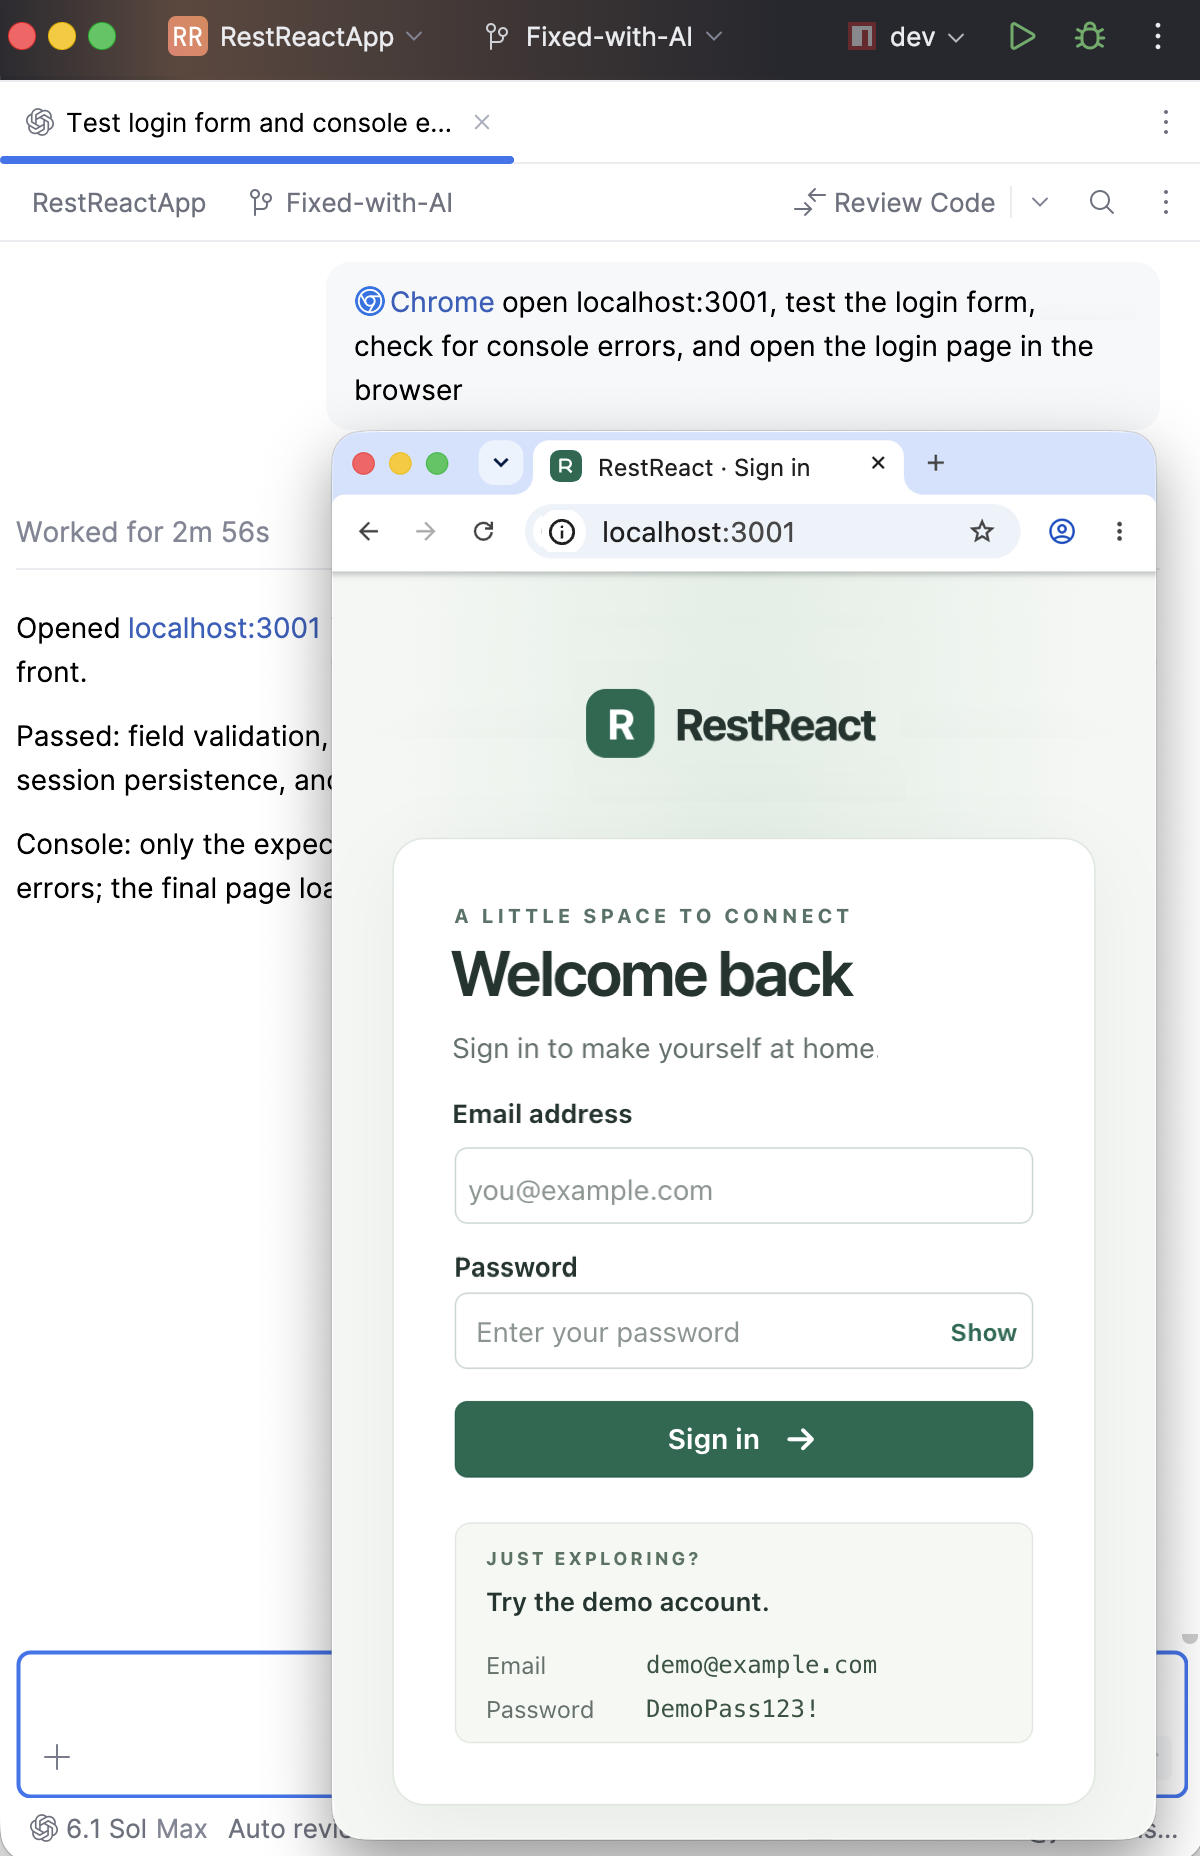
Run Lighthouse audit
You can ask your agent to run an automated check of your application using Google’s Lighthouse tool. The tool evaluates your application in several areas:
Start a new Air session or switch to the tab with an existing one.
Type your prompt using the
@Chromealias to call thechrome-devtools-cliskill, for example:@Chrome run a Lighthouse audit and fix the failuresThe audit produces a report with scores and fixed discrepancies.
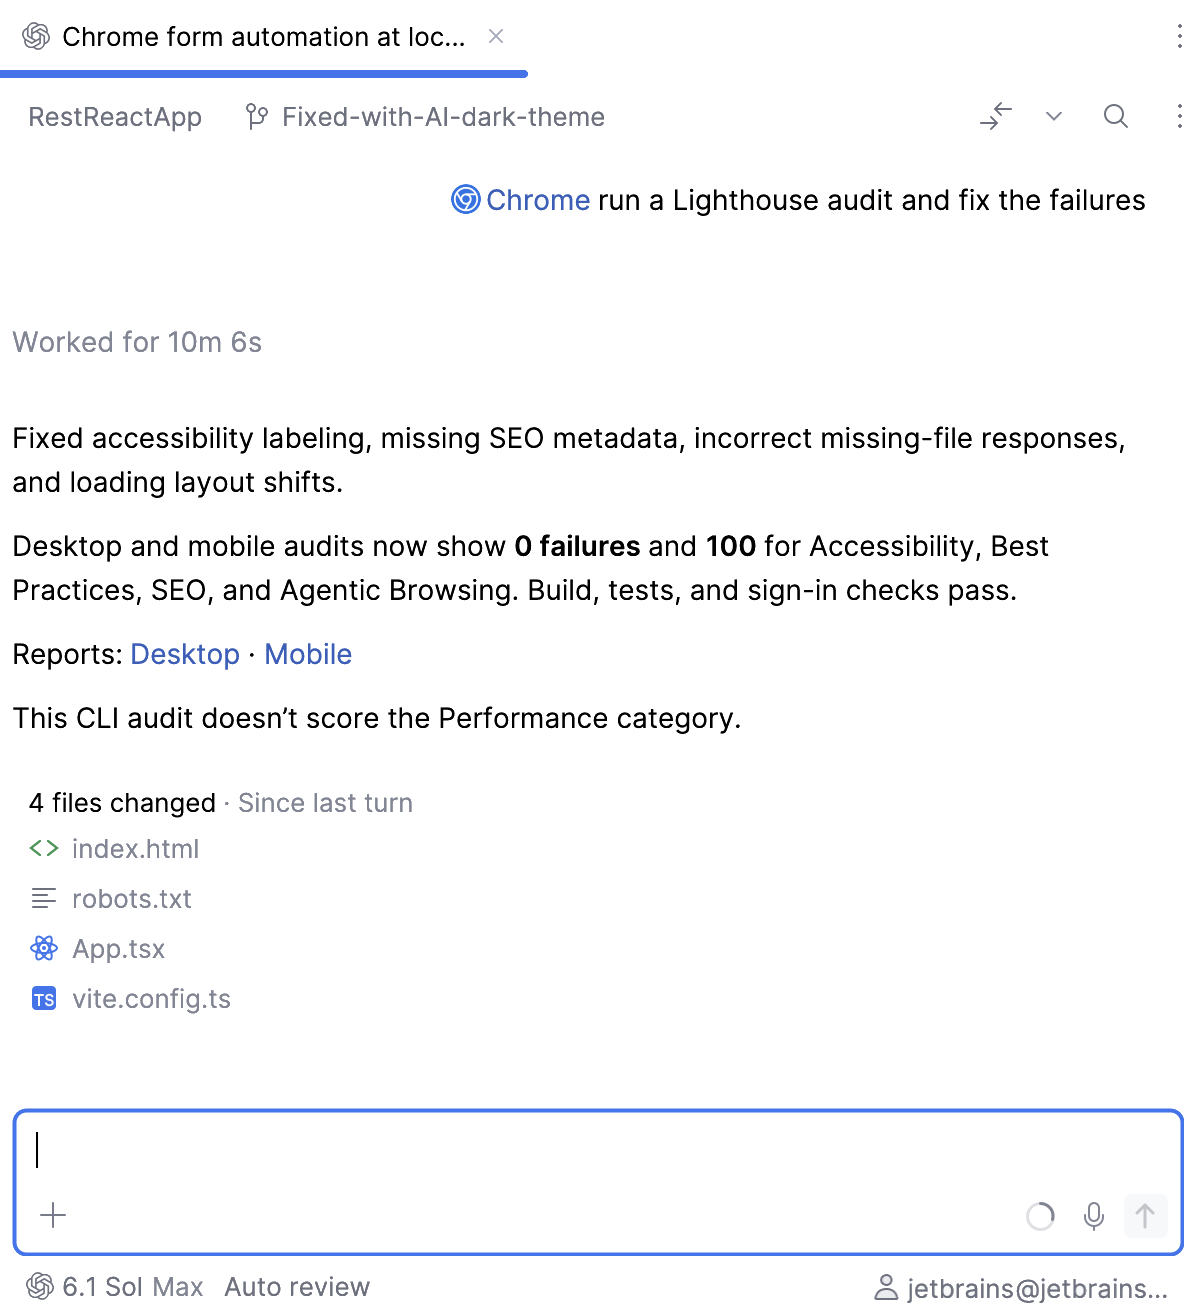
Stay in control of your browser
By default, the agent starts its own headless Chrome with a temporary profile, so your tabs and logins are not affected. To test a page behind a login page, let the agent connect to your own Chrome.
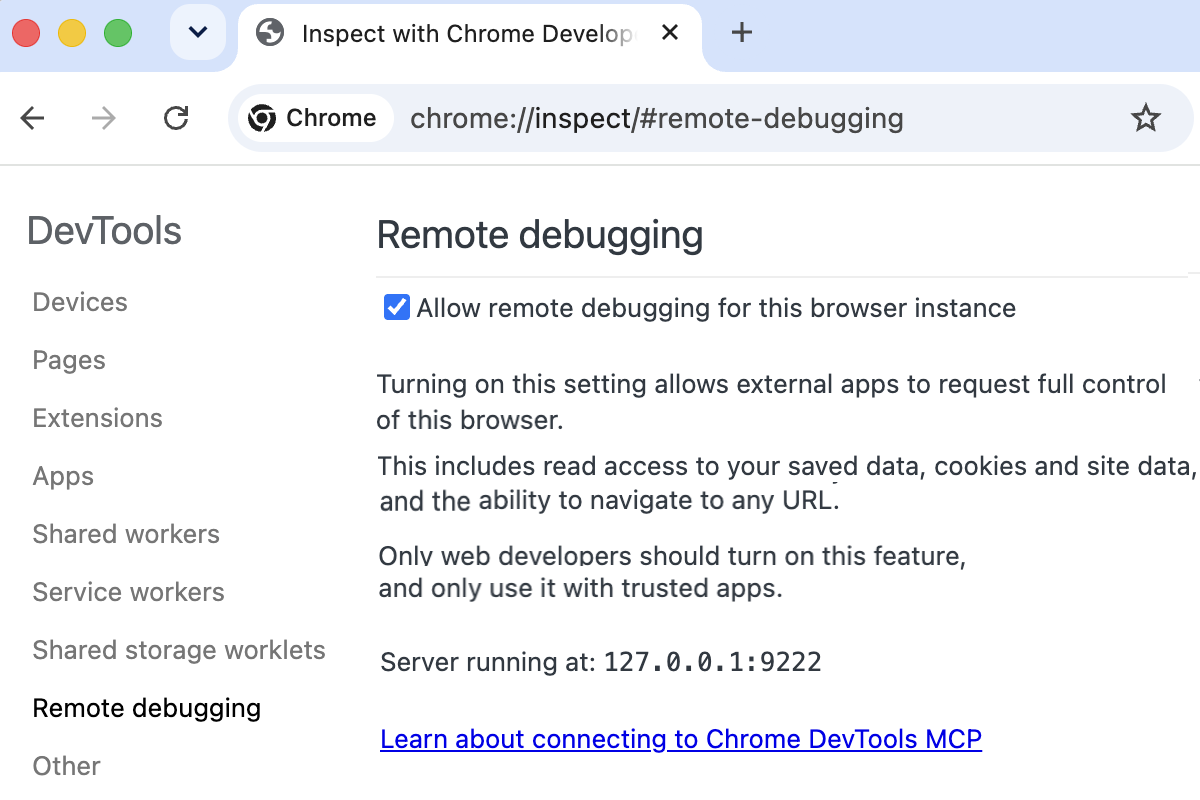
Open
chrome://inspect/#remote-debugging.To allow connections, select the Allow remote debugging for this browser instance checkbox.
In your prompt, add:
@Chrome connect to my browserChrome asks for permission on every connection.
While the agent is attached, Chrome shows a
Chrome is being controlled by automated test softwarebanner.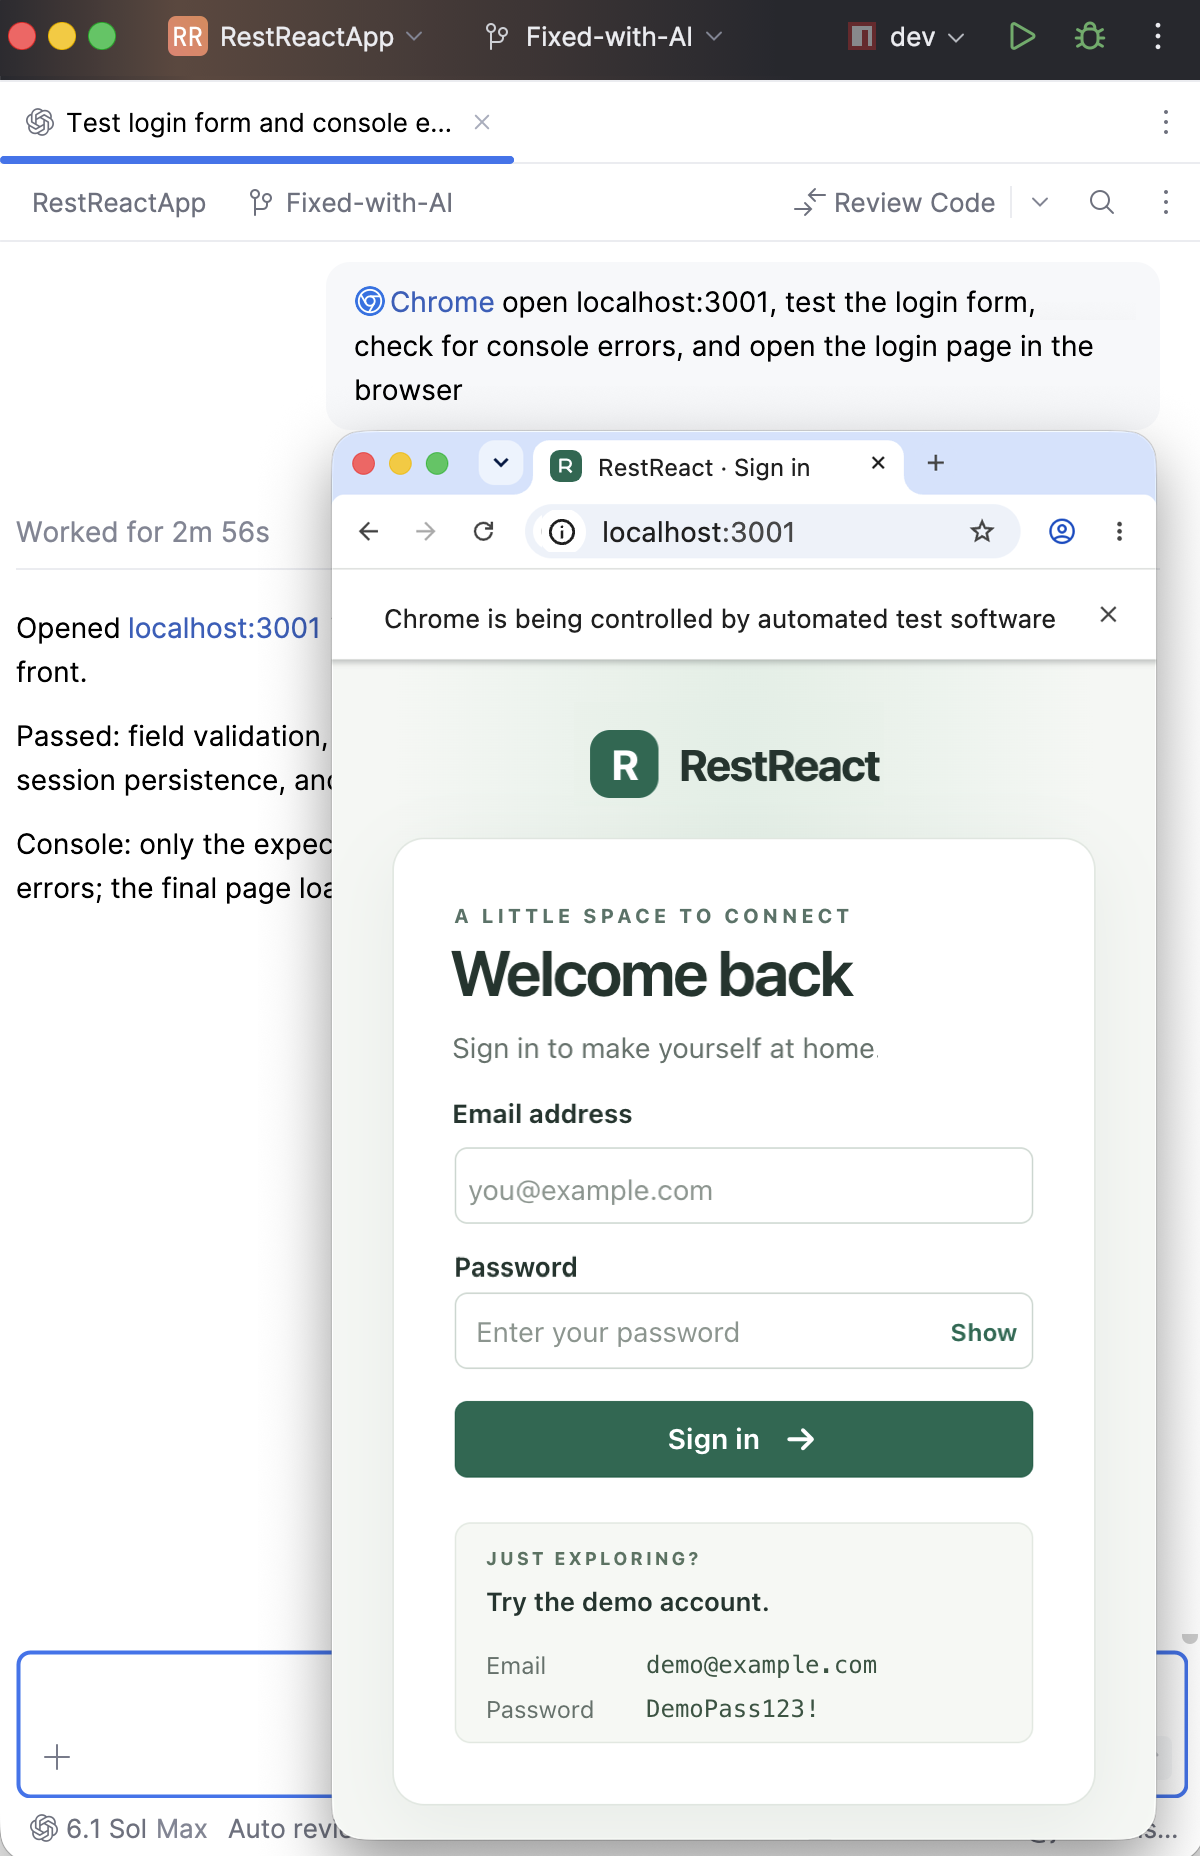
Disable Chrome DevTools Connect
In the Settings dialog (Ctrl+Alt+S) , go to , locate the Chrome DevTools Connect plugin, and click Disable.