How to improve WebStorm performance
In this section, you’ll find some tips on how to make WebStorm run faster. They will be especially helpful if you’re working on large projects. If you’ve given these tips a try, but WebStorm is still slow, please report a performance problem as described below.
Increase memory heap
If you’re working on a large project, your IDE might start to run slowly. One of the first things you can try to do to fix this is to increase the memory heap size in WebStorm.
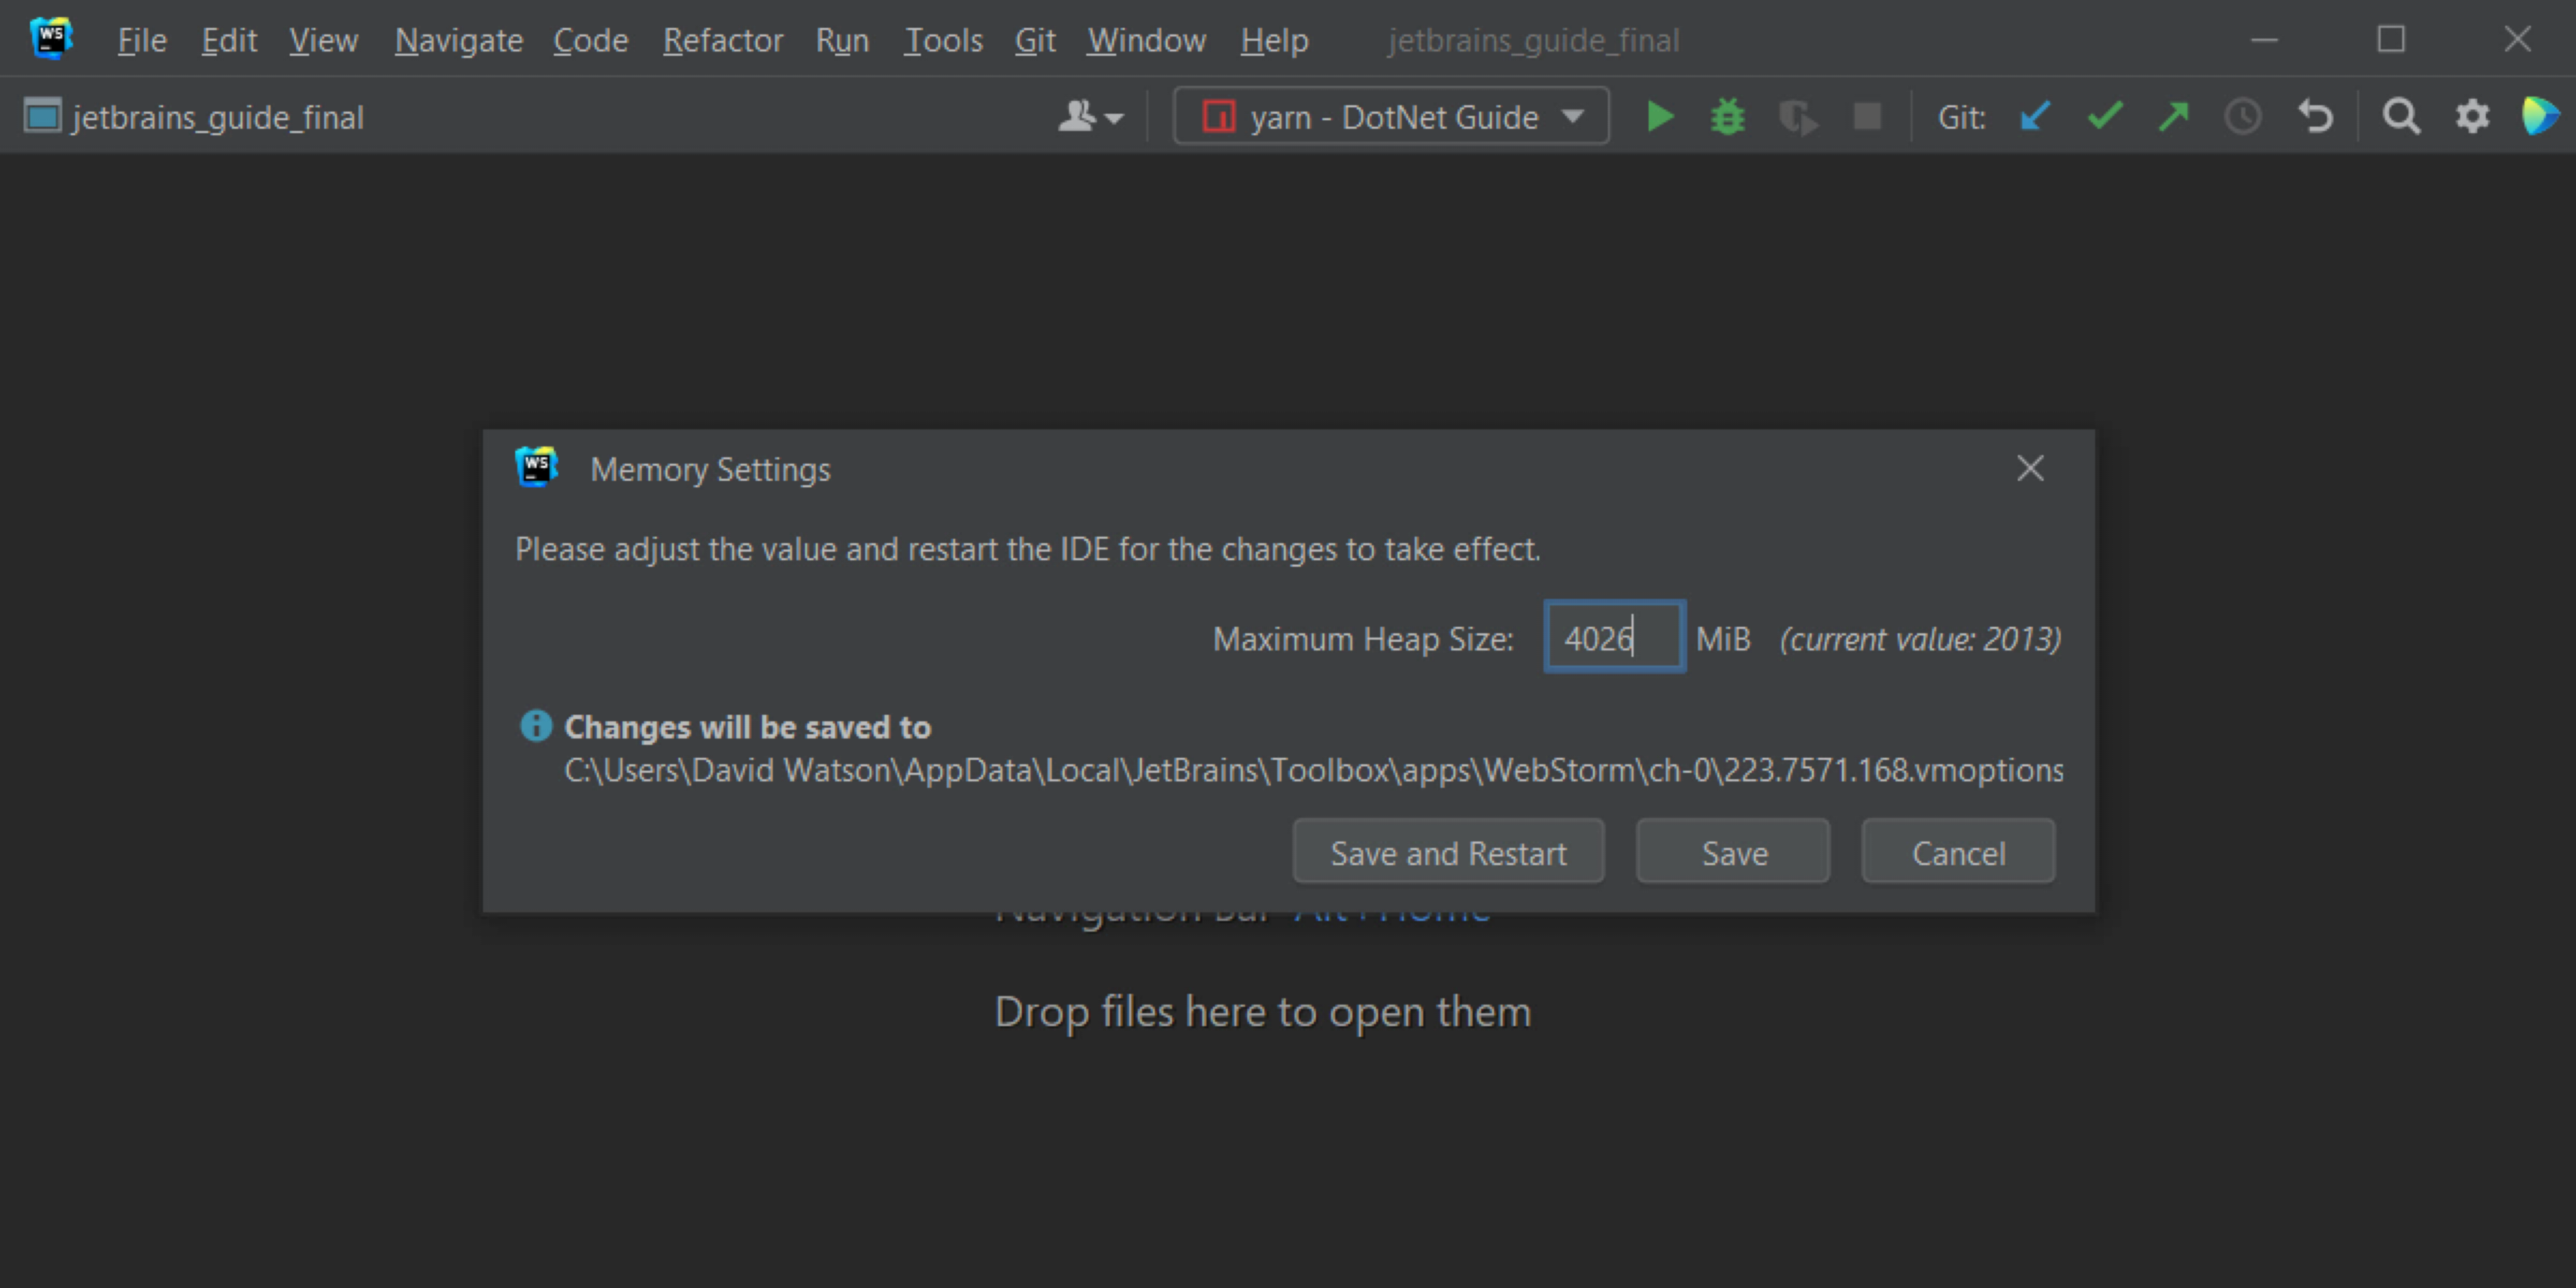
Increase memory heap via IDE
Press Shift twice and search
memoryto get to the Memory Settings dialog, where you can adjust the limit. Make sure not to overdo it –4 GBshould be enough.Restart the IDE after you have made the changes.
Increase memory heap via Toolbox App
You can also change the memory heap size using the Toolbox App.
Open the app, click the three dots next to your WebStorm installation, and select Settings.

Go to the Configuration section and set a new value in the Maximum heap size field as shown below. Most of the time, setting it to
4 GBshould be enough.
Restart the IDE once you make the changes.
Bonus tip: Turn on memory indicator
You can check whether performance slowdowns are caused by low heap memory by enabling the memory indicator.
Right-click the bottom-right corner of the WebStorm status bar and select Memory Indicator from the list there.

Speed up project analysis
Project analysis is what makes WebStorm smart. It is responsible for all of its core features, such as code completion, code quality analysis, navigation, syntax highlighting, and refactorings. If you work with large files or projects, WebStorm’s project analysis might become sluggish. Here’s what you can do to help speed it up.
Exclude directories and files
If you exclude a file or a folder, it will remain a part of a project, but WebStorm will no longer index it during project analysis. Look through your project and see if there is anything you could exclude from the analysis. We recommend looking for any dynamically generated files, such as compilation output folders, and excluding them.
To exclude a file, right-click it in the Project tool window and select Override File Type | Plain text. Plain text files are marked with the
 icon.
icon.To exclude a folder, right-click it in the Project tool window and select Mark Directory as | Excluded. Excluded folders are marked with the
 icon.
icon.
Use shared indexes
All JetBrains IDEs, including WebStorm, come bundled with the Shared Project Indexes plugin. Its main goal is to reduce the overall project analysis time and CPU usage of your IDE, so please make sure it is enabled on the Installed tab of the Settings | Plugins.
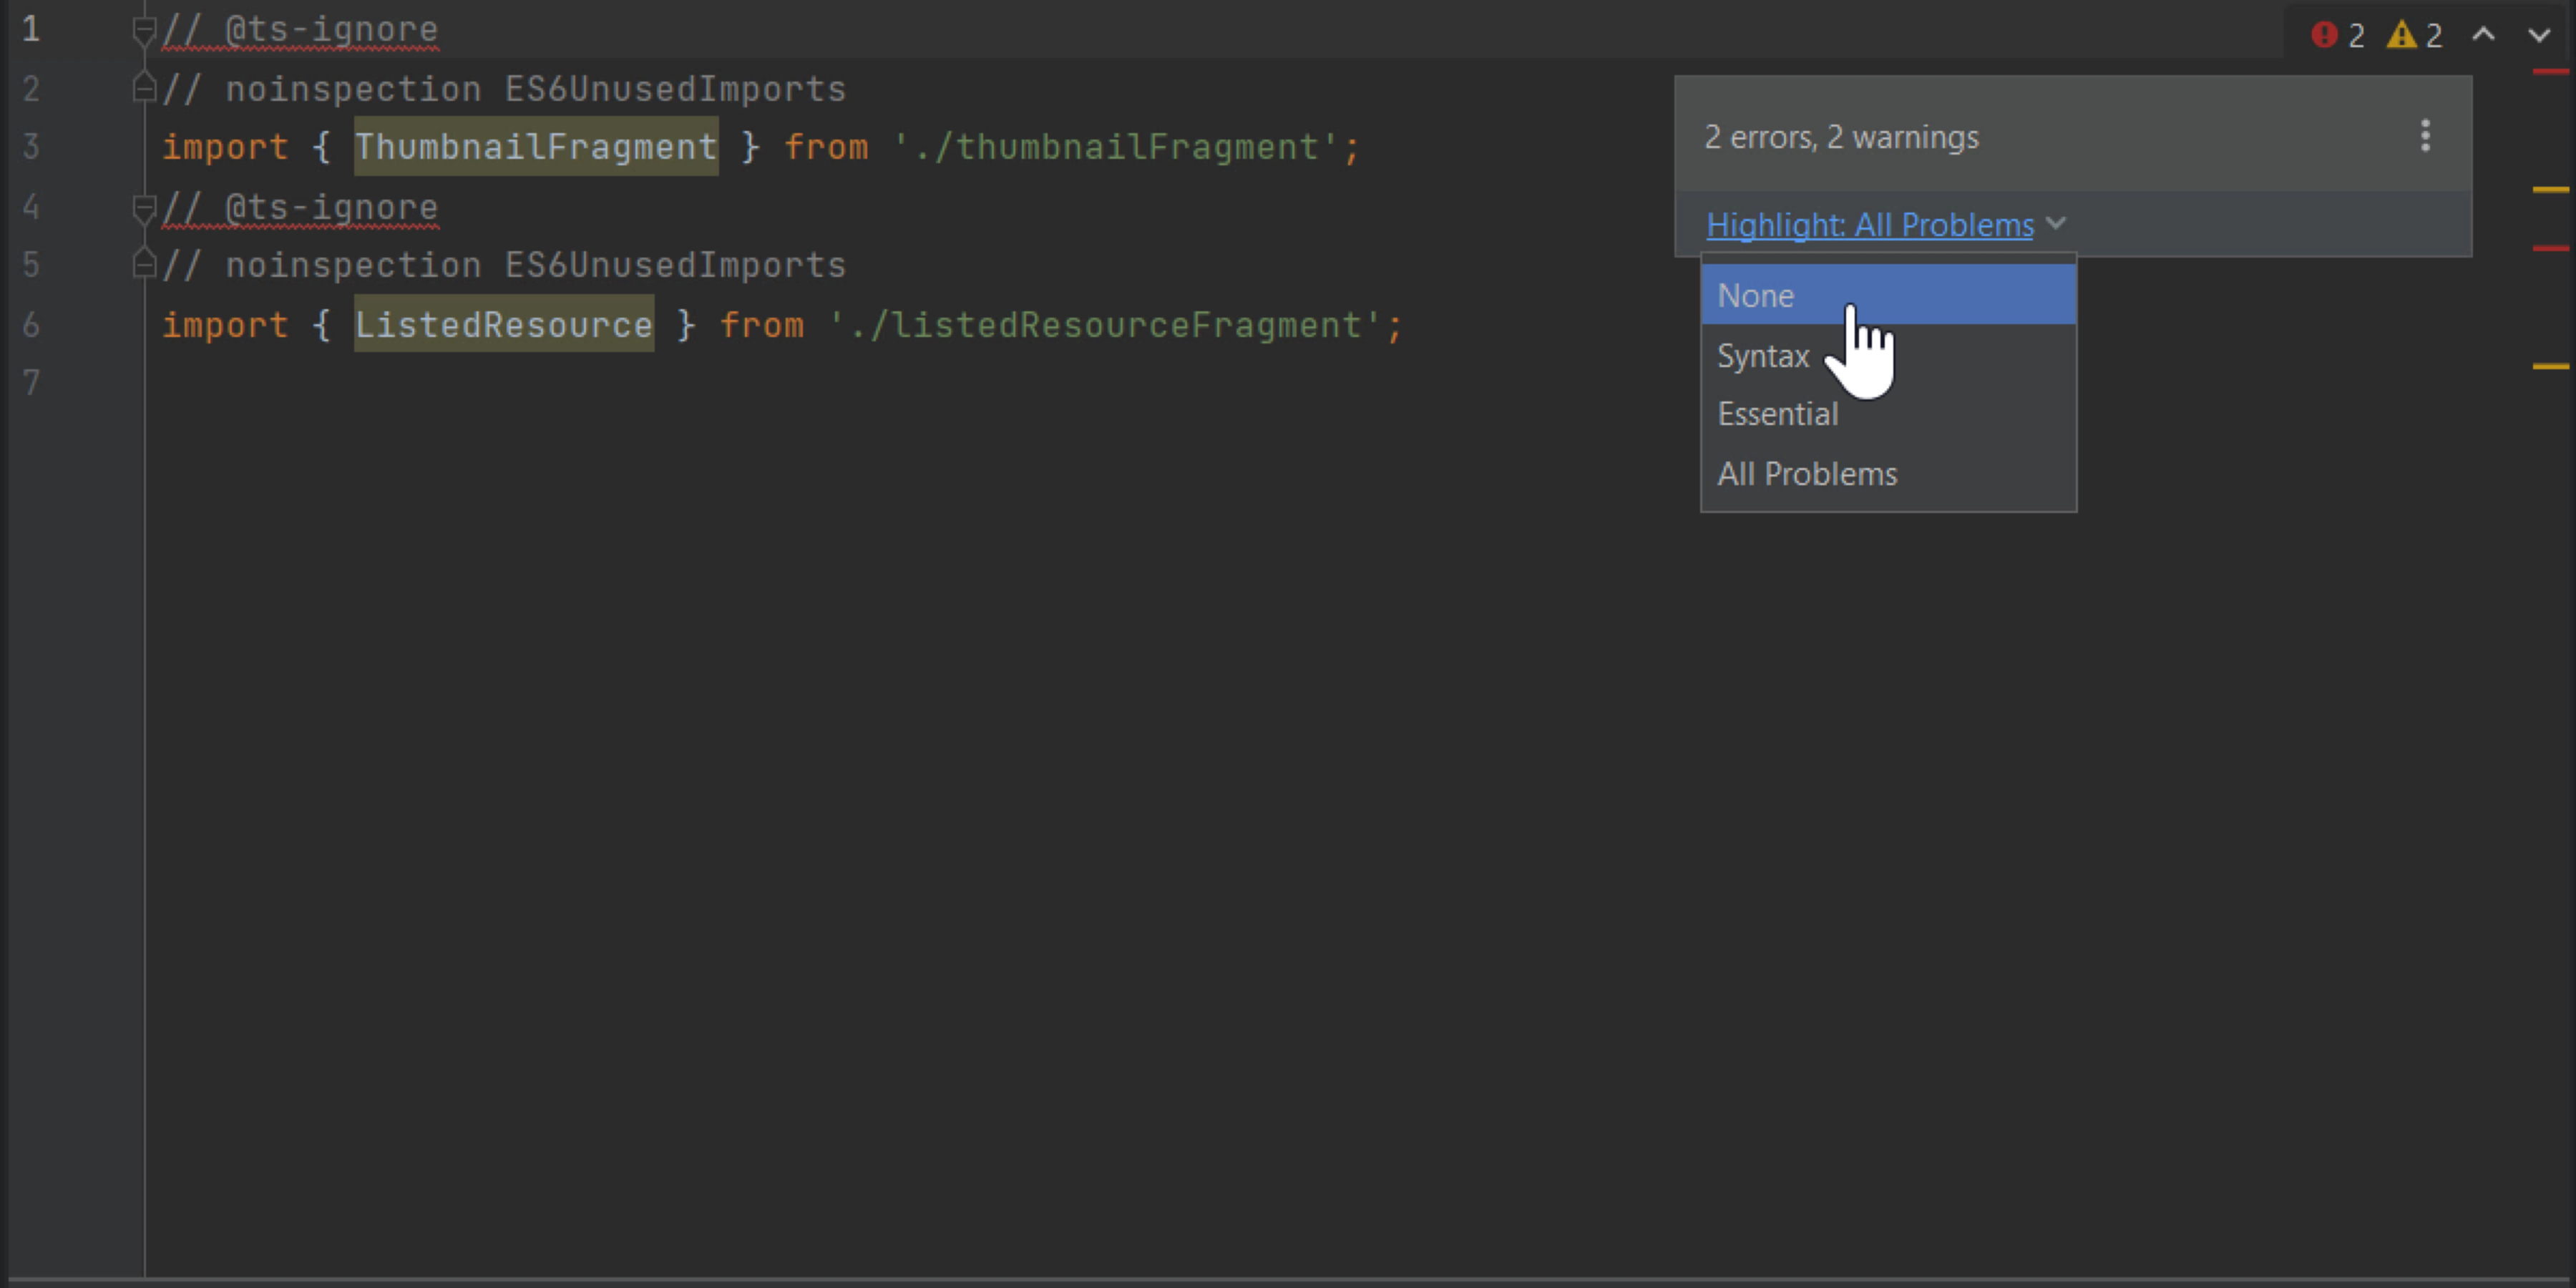
Change highlighting level for a file
By default, WebStorm analyzes your code as you type and highlights all problems found in the current file. If your file is large, this might make WebStorm a bit laggy. In this case, you can temporarily change the highlighting level from All Problems to Syntax or None. Don’t forget to turn it back on once you’re done to avoid missing any important problems!
For more information, refer to Change the highlighting level for a file.
Disable features you don’t need
There are quite a few tips on the internet suggesting what features you could turn off to improve WebStorm performance. Although some of these things can really help, we would kindly ask you to be careful with this step. It is possible to accidentally disable some essential features that will make your experience working with WebStorm worse.
Here are several things you can safely try disabling.
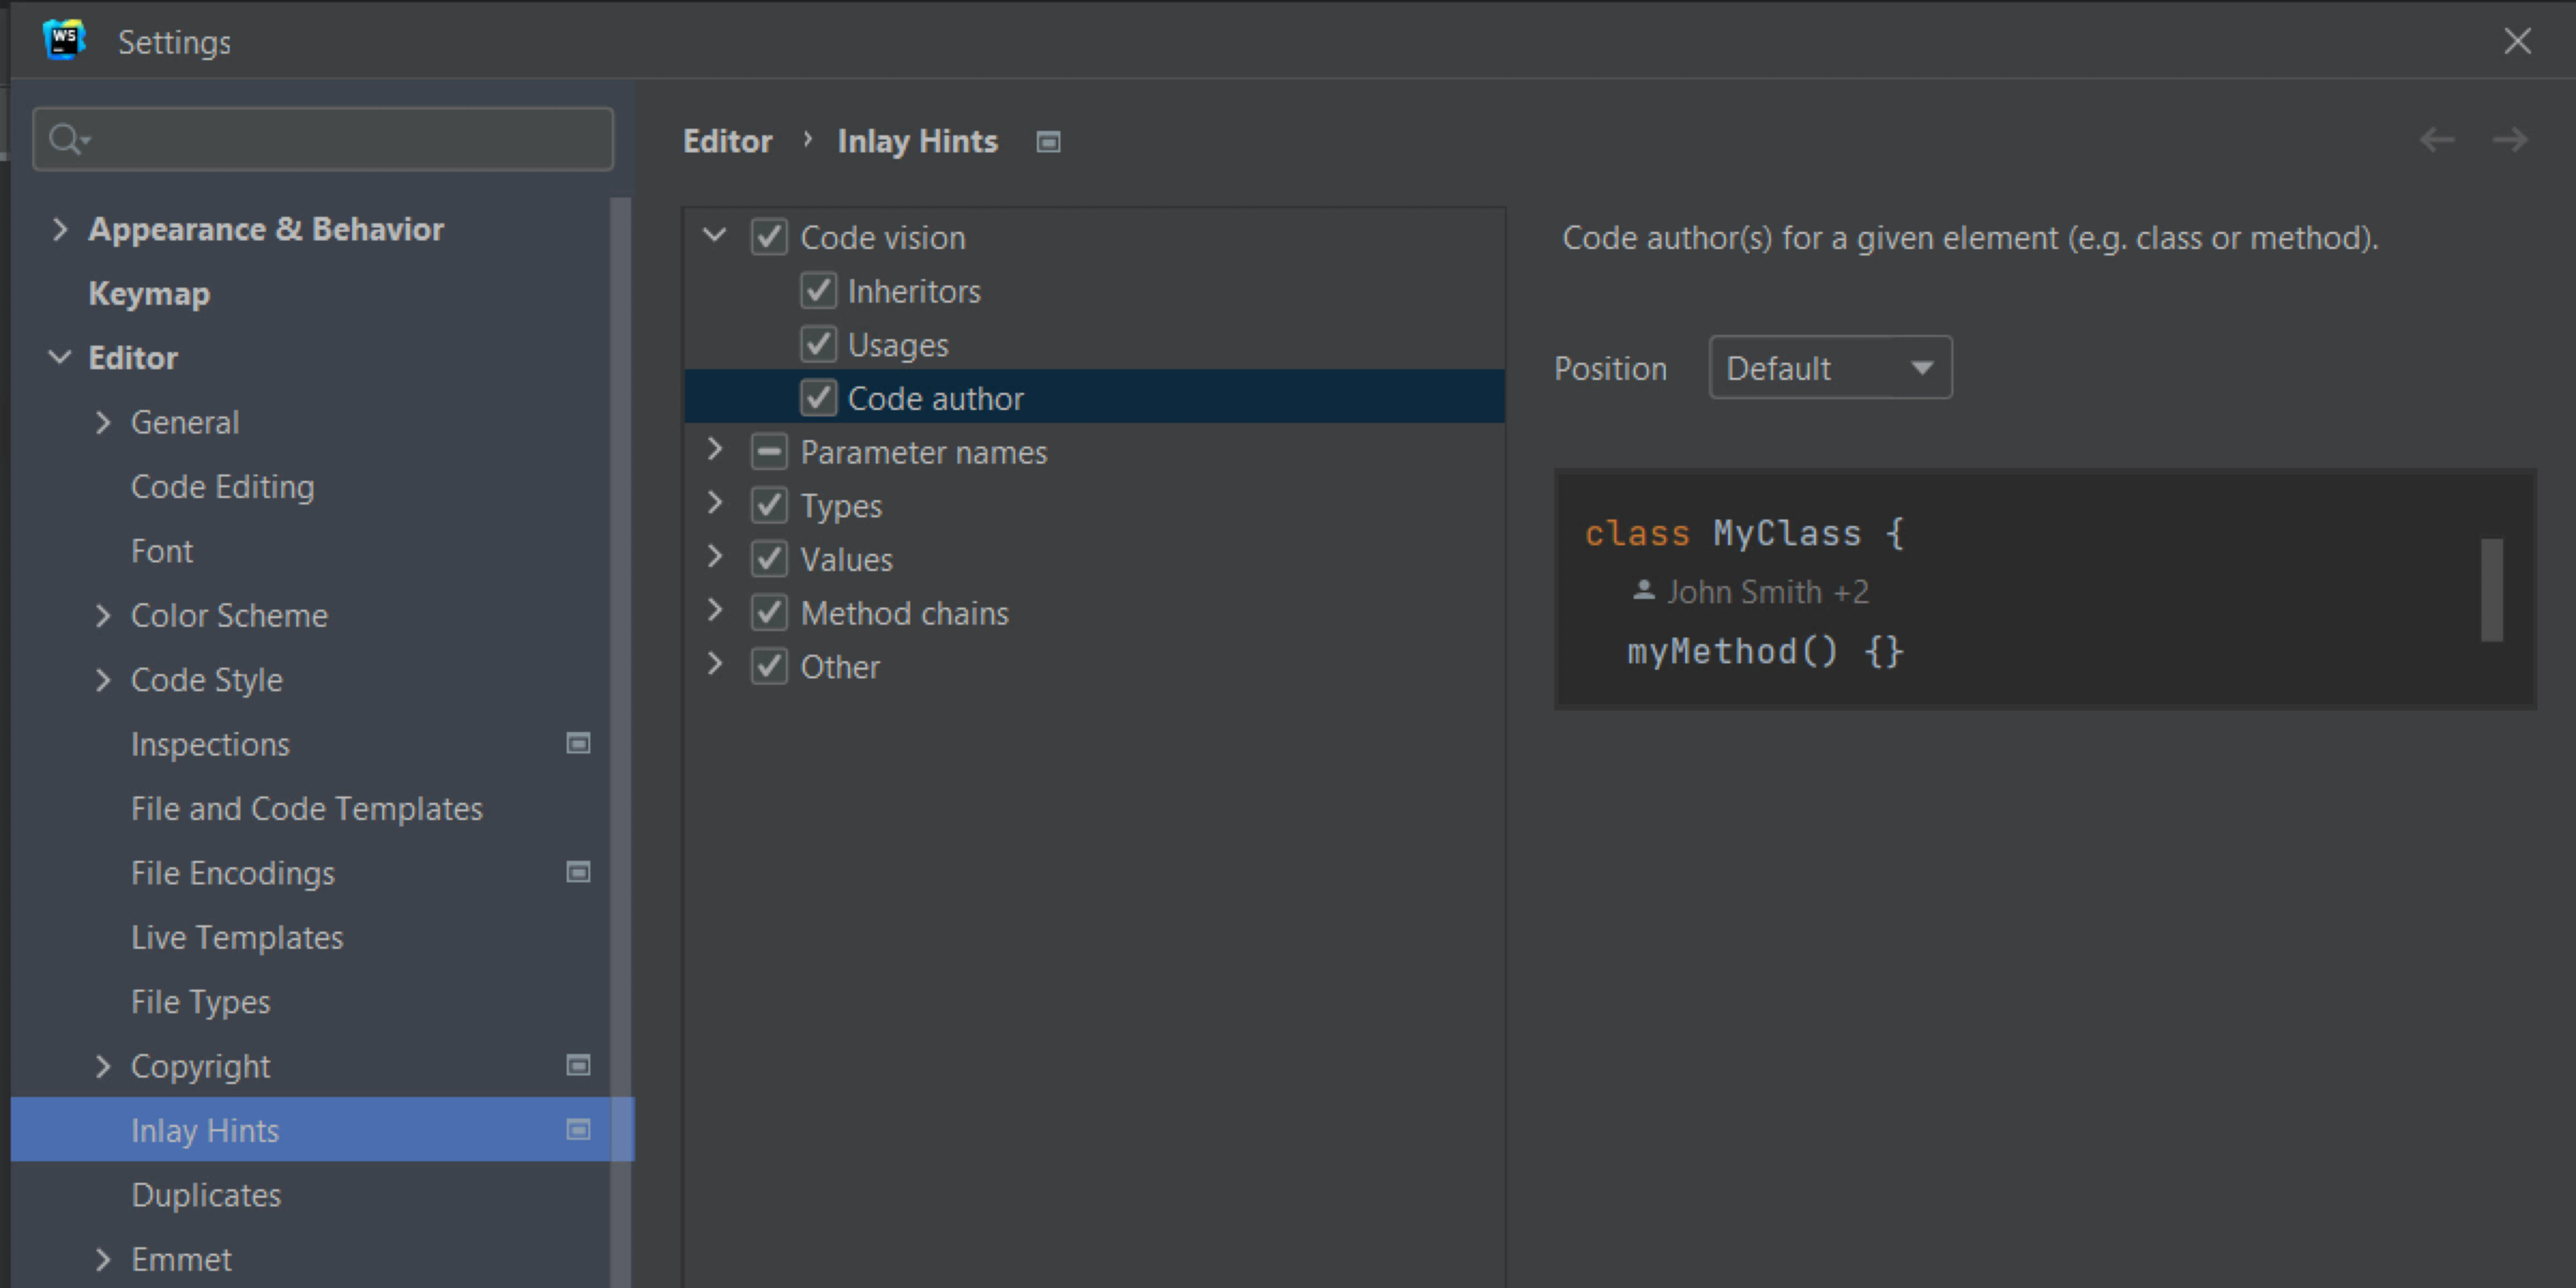
Code Vision
Code Vision shows additional information about your code, making it easier to track the usage of various classes, methods, type aliases, and interfaces. This feature can be quite resource-hungry in large projects. You can try turning it off in .
As an option, you can also disable other inlay hints to see whether it improves WebStorm performance.
Unused global symbol inspection
Like Code Vision, this feature can also affect WebStorm performance. You can go to , look for the Unused global symbol inspection there, and try to turn it off.

Bundled plugins you don’t need
WebStorm includes pre-installed plugins that provide support for many different technologies. These plugins support technologies that the majority of our users need, but plugins providing support that you don’t need can be disabled.
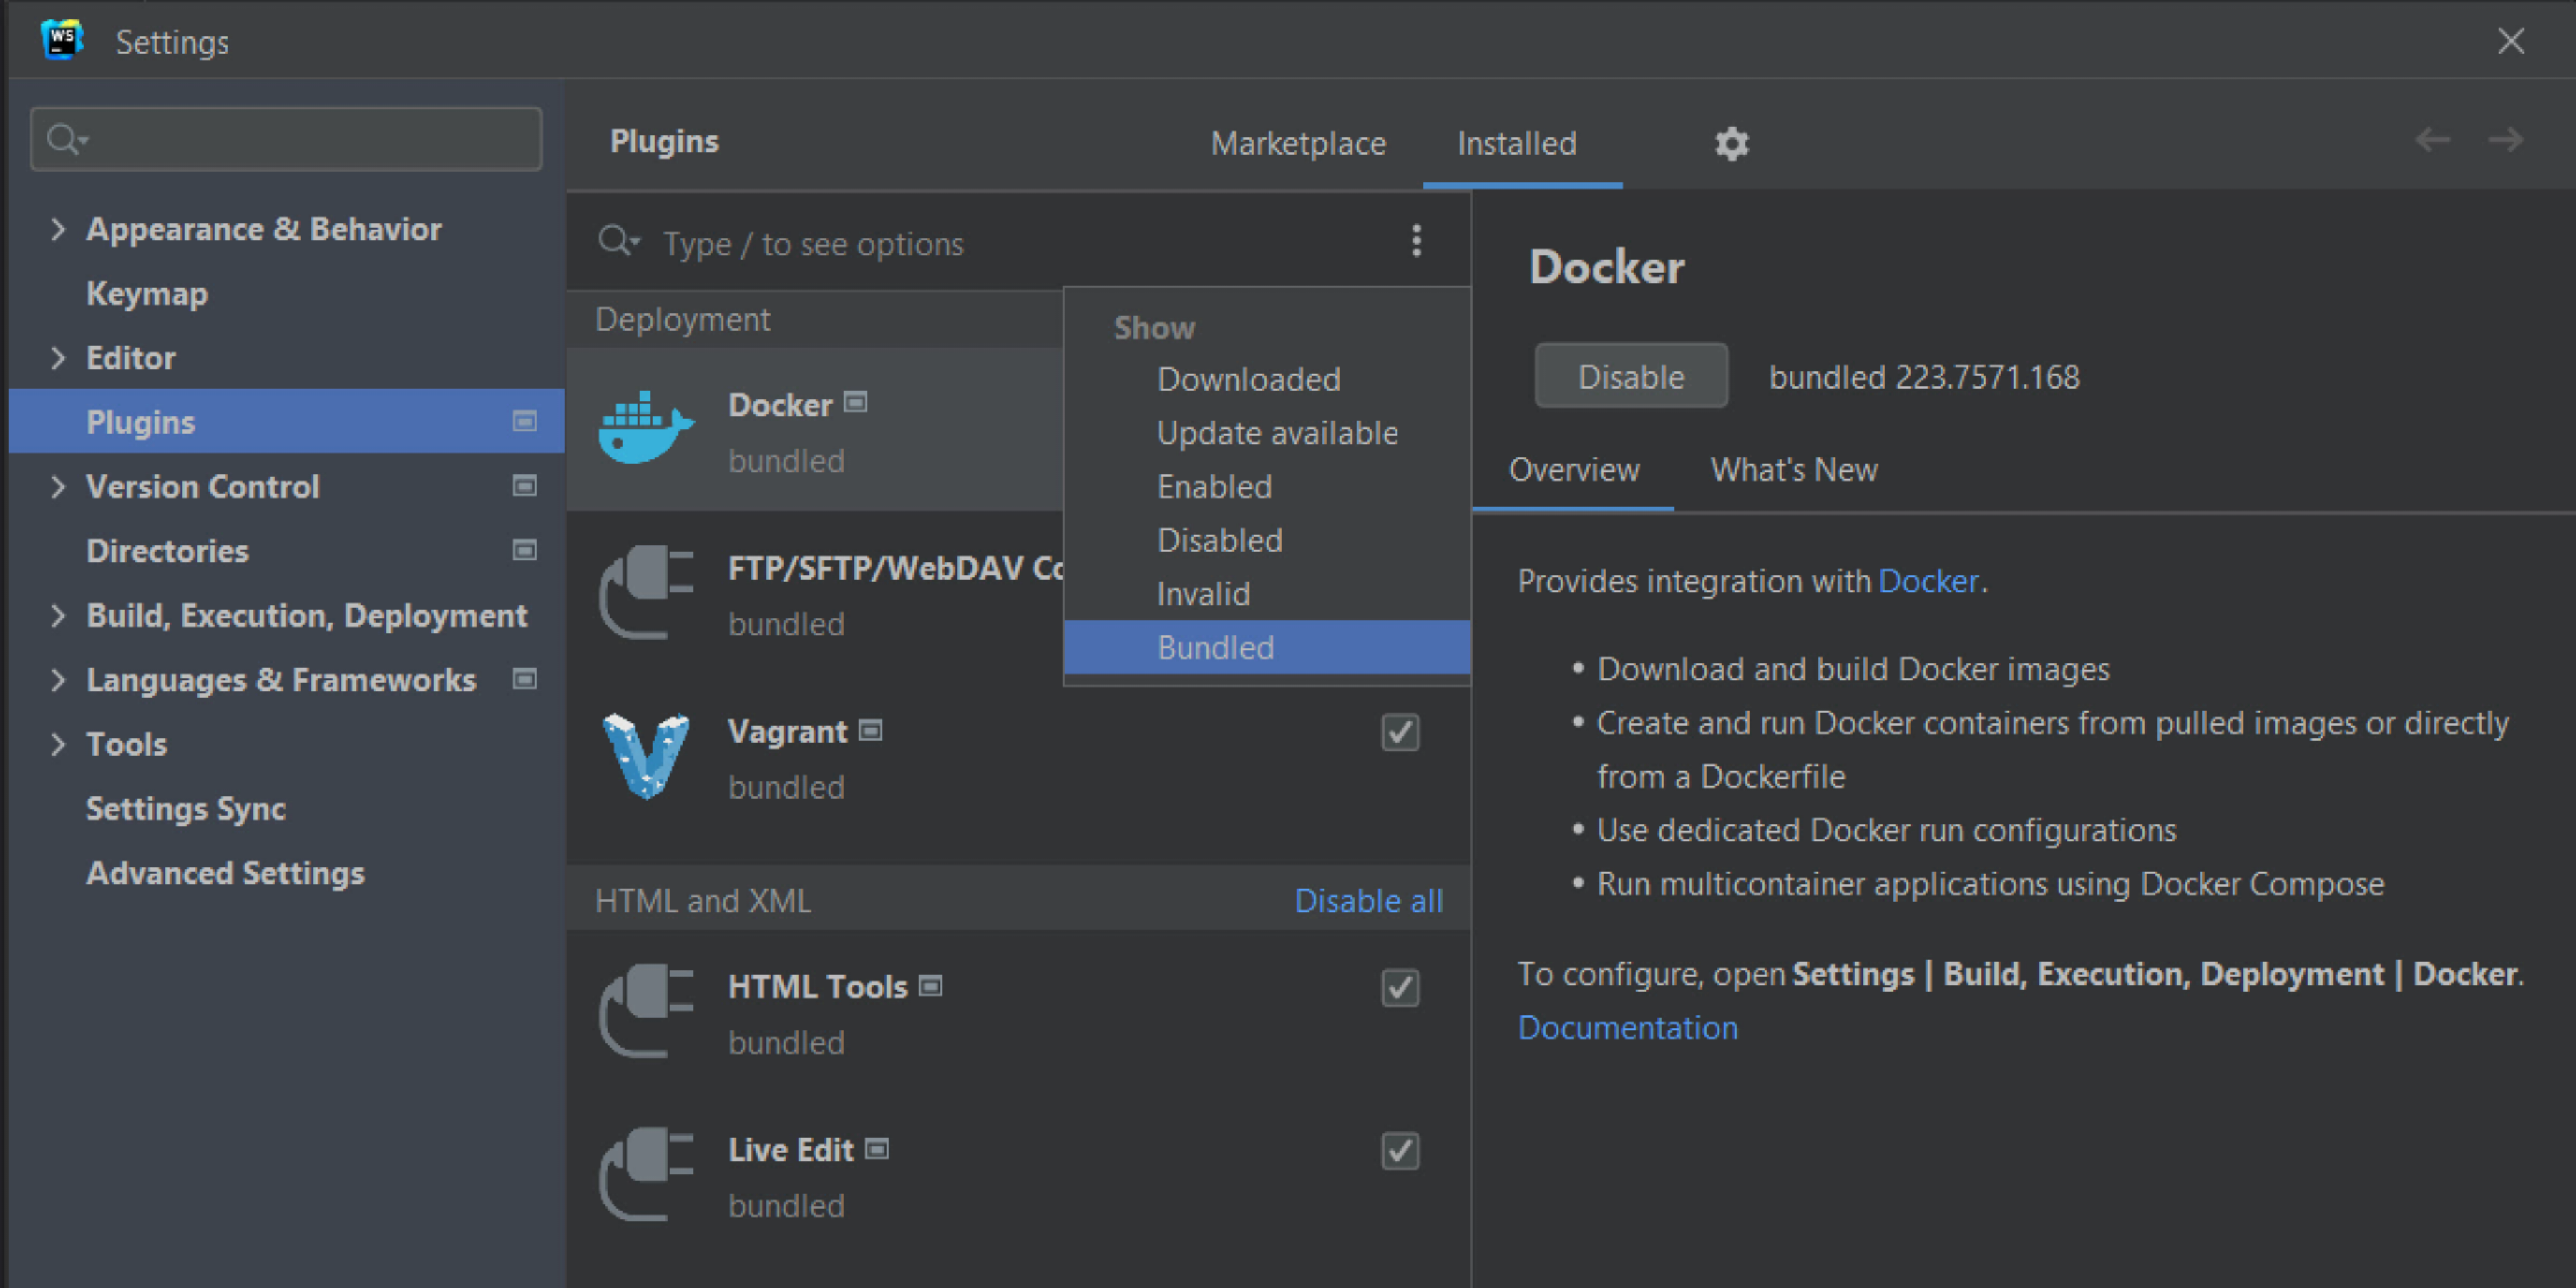
Open the Settings dialog (Ctrl+Alt+S) and go to Plugins.
Switch to the Installed tab to review the list of plugins you have installed in WebStorm.
If you want to go over the bundled plugins specifically, you can also use the Bundled filter by clicking on the three-dot kebab icon.
Live Templates for some technologies
WebStorm comes packed with code snippets, or Live Templates as we call them, that you can quickly add code fragments you use often. You can disable any Live Templates for technologies you are not using under Settings | Editor | Live Templates.

Emmet
If you don’t work with Emmet a lot, you can disable it in WebStorm, too. For this, go to Settings | Editor | Emmet.

Report performance problems
If the tips above didn’t help, please report your performance problem to our issue tracker. To investigate it, we’ll need you to provide the WebStorm logs and a CPU usage snapshot.
Collect WebStorm logs
You can find the WebStorm logs under in the main menu.
Collect a CPU usage snapshot
In the main menu, go to .
Reproduce the problem you’ve experienced.
Go back to the main menu and select .
Collect the captured snapshot and share it with us along with your zipped log folder.
If the snapshot is too large to attach to the issue, please upload it to the JetBrains Upload Service or use another file upload service.