State Transition
This report tracks the change in value for a custom field within a specified time frame. For example, it shows how many issues were fixed by each developer in the past month, or shows who reported the most issues that ended up with the state Won't fix.
Unlike the Verified Distribution and Reopened Distribution reports, you can configure this report to track changes in value for any field that stores an enumerated type. For example, you can generate a report that tracks changes in the Priority field and show issues that escalated from minor or normal priority to major or critical.
Create a State Transition Report
To create a state transition report:
From the main navigation menu, select
Reports.
Click the New report button.
Click the link for the State transition report.
In the settings page for the report, set the parameters for the new report.
To learn more about the settings for this report, refer to the settings.
When you are finished with the report settings, click the Create report button.
The report is sent to the processing queue of your YouTrack server.
When processing is finished, the new report is displayed.
Settings
Use the following settings to configure this report.
Setting | Description |
|---|---|
Report name | Assigns the report a name. |
Projects | Filters the report to display issues from specific projects. The list is limited to projects in which you have the Read Project Basic permission. |
Issue filter | Filters the report to display issues that are returned by the specified query. The input field provides the same syntax and auto-completion options that are available in the search box. |
Period | Filters the report to show only issues that transitioned from the values that are selected in the From setting to the values that are selected in the To setting within the selected time frame. |
Automatically Recalculate | Configures periodic recalculation for your report.
|
Field | Sets which field is analyzed for changes in value. The selection is limited to fields that store enumerated types. |
From | Selects the values in the field that are considered for the initial state of the transition. |
To | Selects the values in the field that are considered for the end state of the transition. |
Group by | Determines which custom field or issue attribute is used to group values in the report. For example, you can group issues by assignee or by project. |
Sort order | Sorts the values in the attribute or custom field that is used for the Group by setting. By default, items are sorted by count in descending order. This shows the value that has the highest distribution at the top of the list. The natural sort order corresponds to the order in which values appear in the set of values for the selected field or attribute. For example, the natural sort order for the updated attribute is chronological by date. The natural sort order for the updater attribute is alphabetical by full name. |
Presentation | Determines which type of chart is used to display data in the report. This report can be presented as a bar chart or a pie chart. |
Can view and use | Sets the visibility for the report. By default, the report is visible to its owner only. To share the report with other users, select a group or project team from the list. |
Can edit | Determines who has permission to view and edit the report settings. To let other users update the report settings, select a group or project team from the list. |
Examples
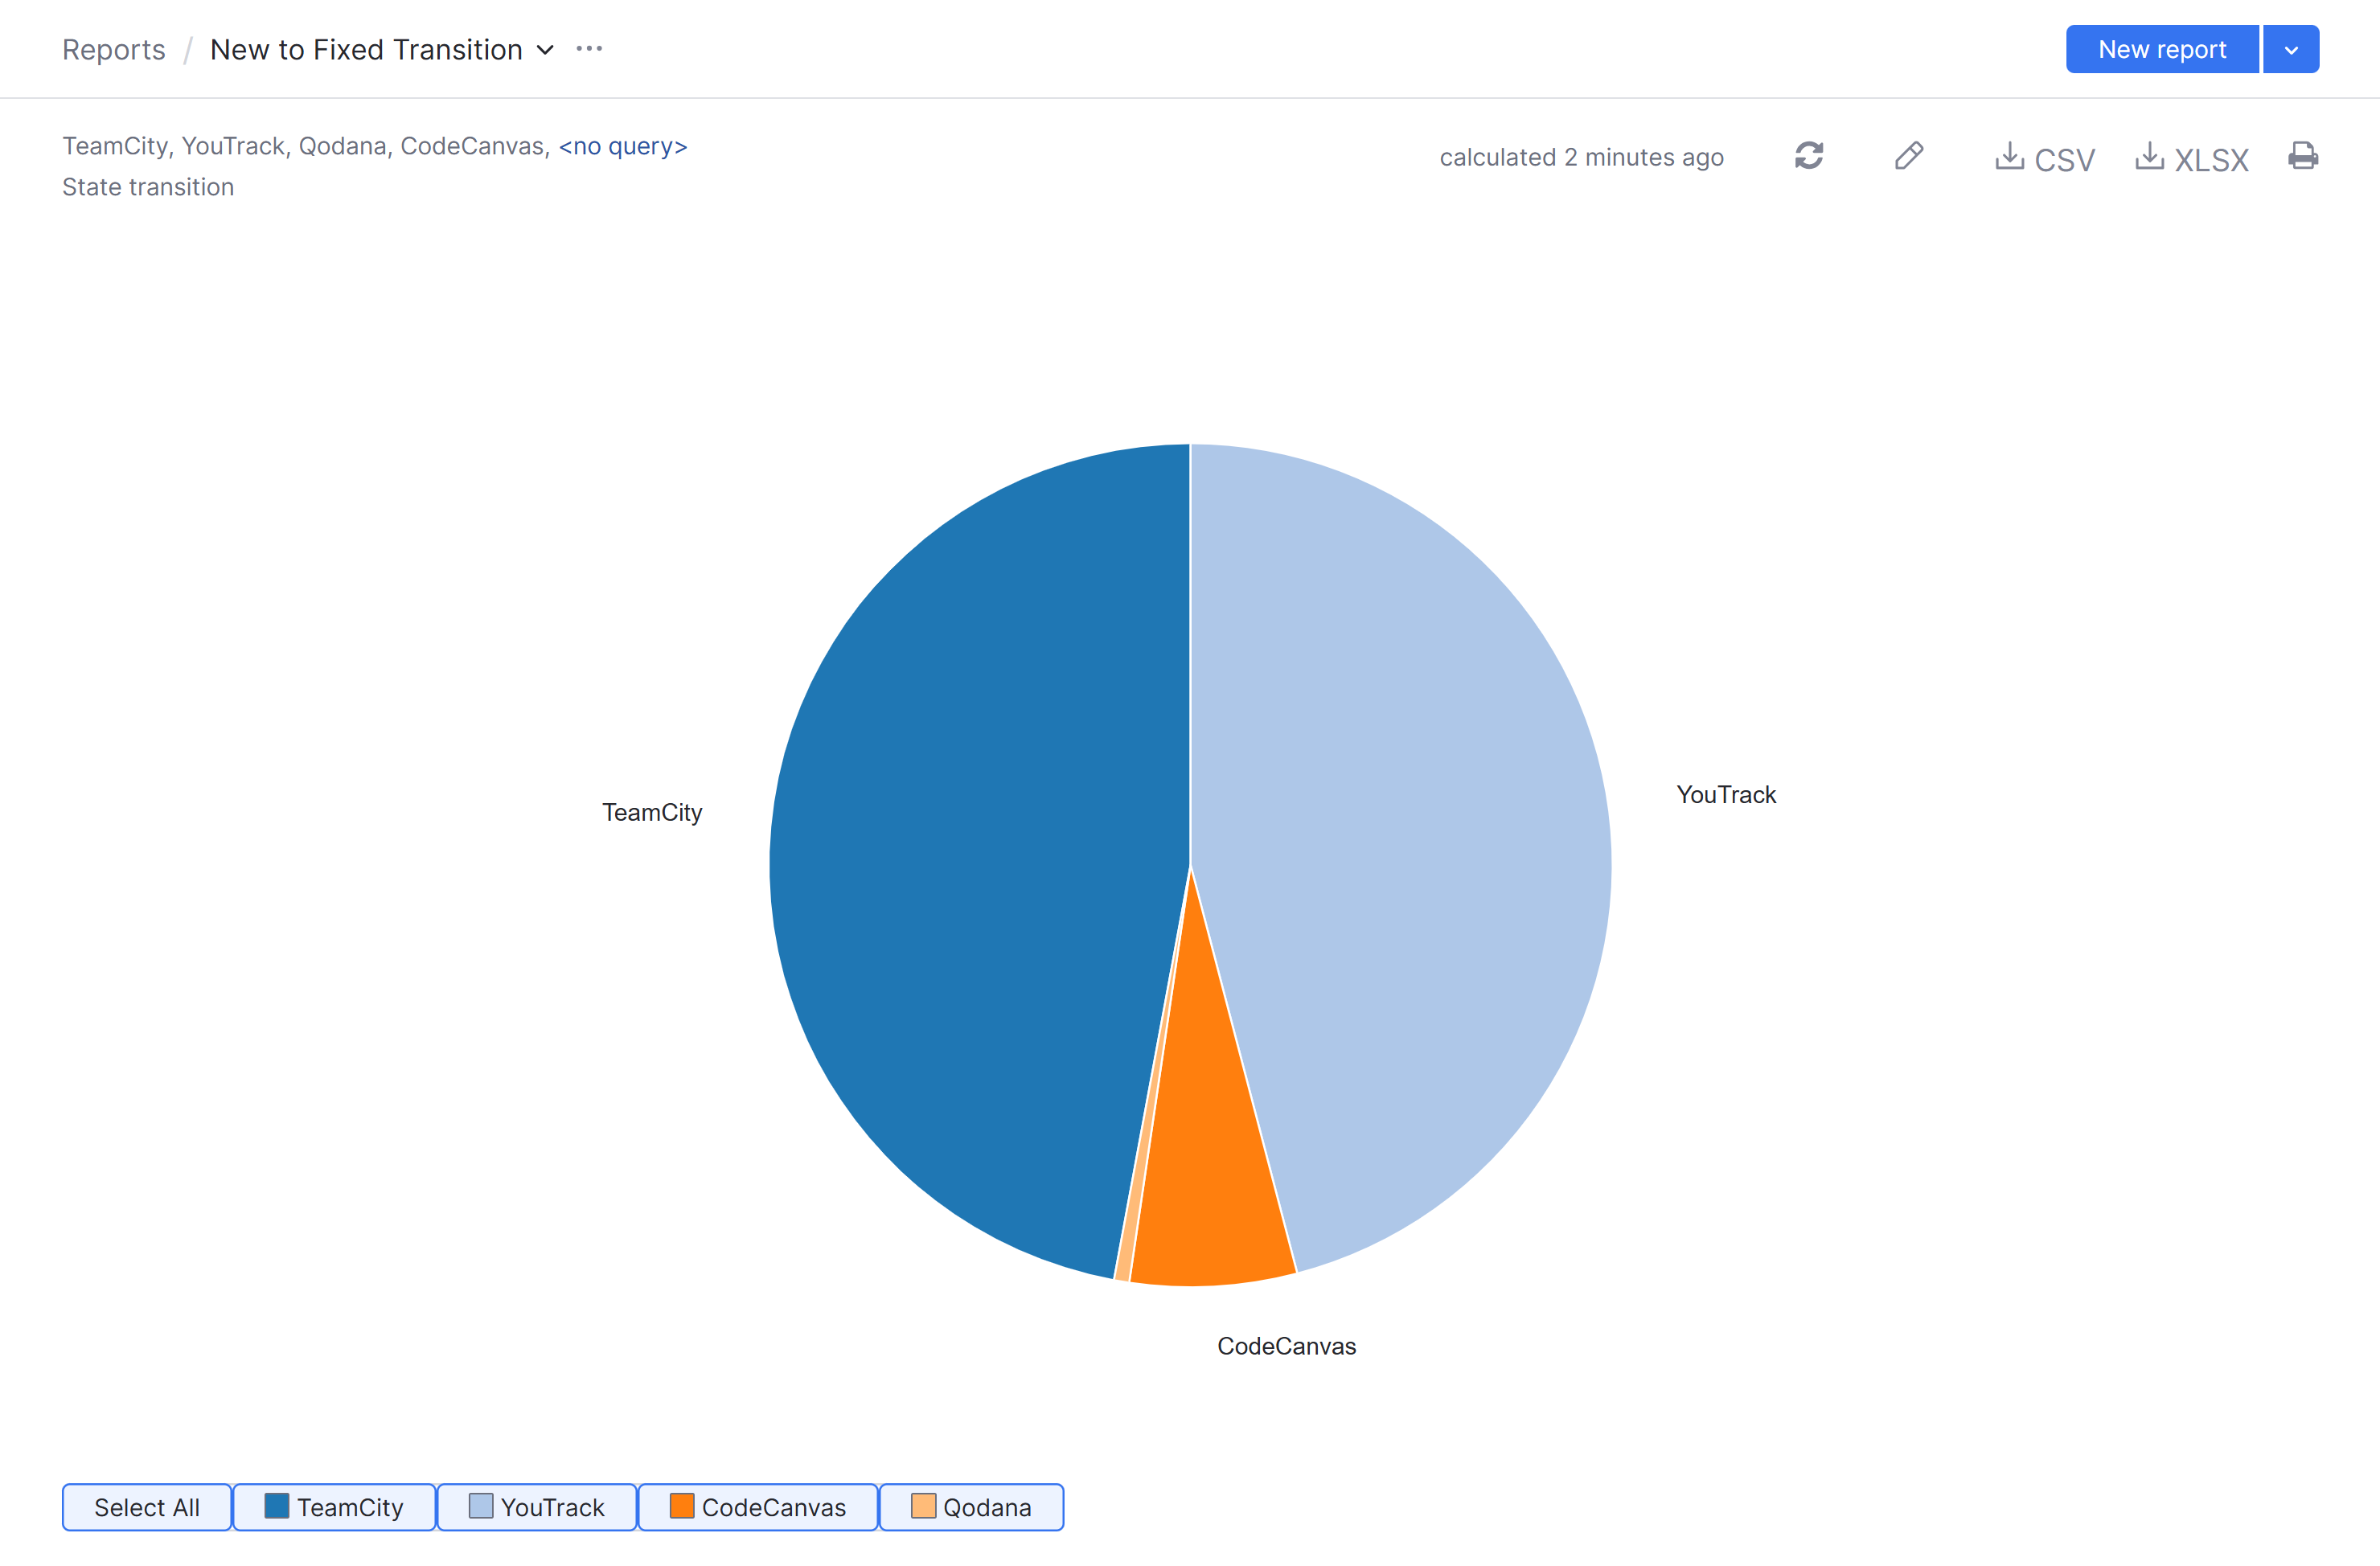
A report with the following settings displays the number of issues that transitioned from the Submitted and Open states to the Fixed state in the last month.
Setting | Value |
|---|---|
Projects | TeamCity, YouTrack, Qodana, CodeCanvas |
Query | Empty |
Field | State |
From | Open, Submitted |
To | Fixed |
Group by | Project |

Here's the same report presented as a pie chart:

View a State Transition Report
All reports that you have permission to view are available in a drop-down list in the header of Reports.
To view a State transition report:
From the main navigation menu, select
Reports.
Open the drop-down list of reports in the header and select a report.
Reports can also be displayed on YouTrack dashboards with the use of a widget.
For more information, see Reports Widgets.