Migrate a Gantt Chart Report
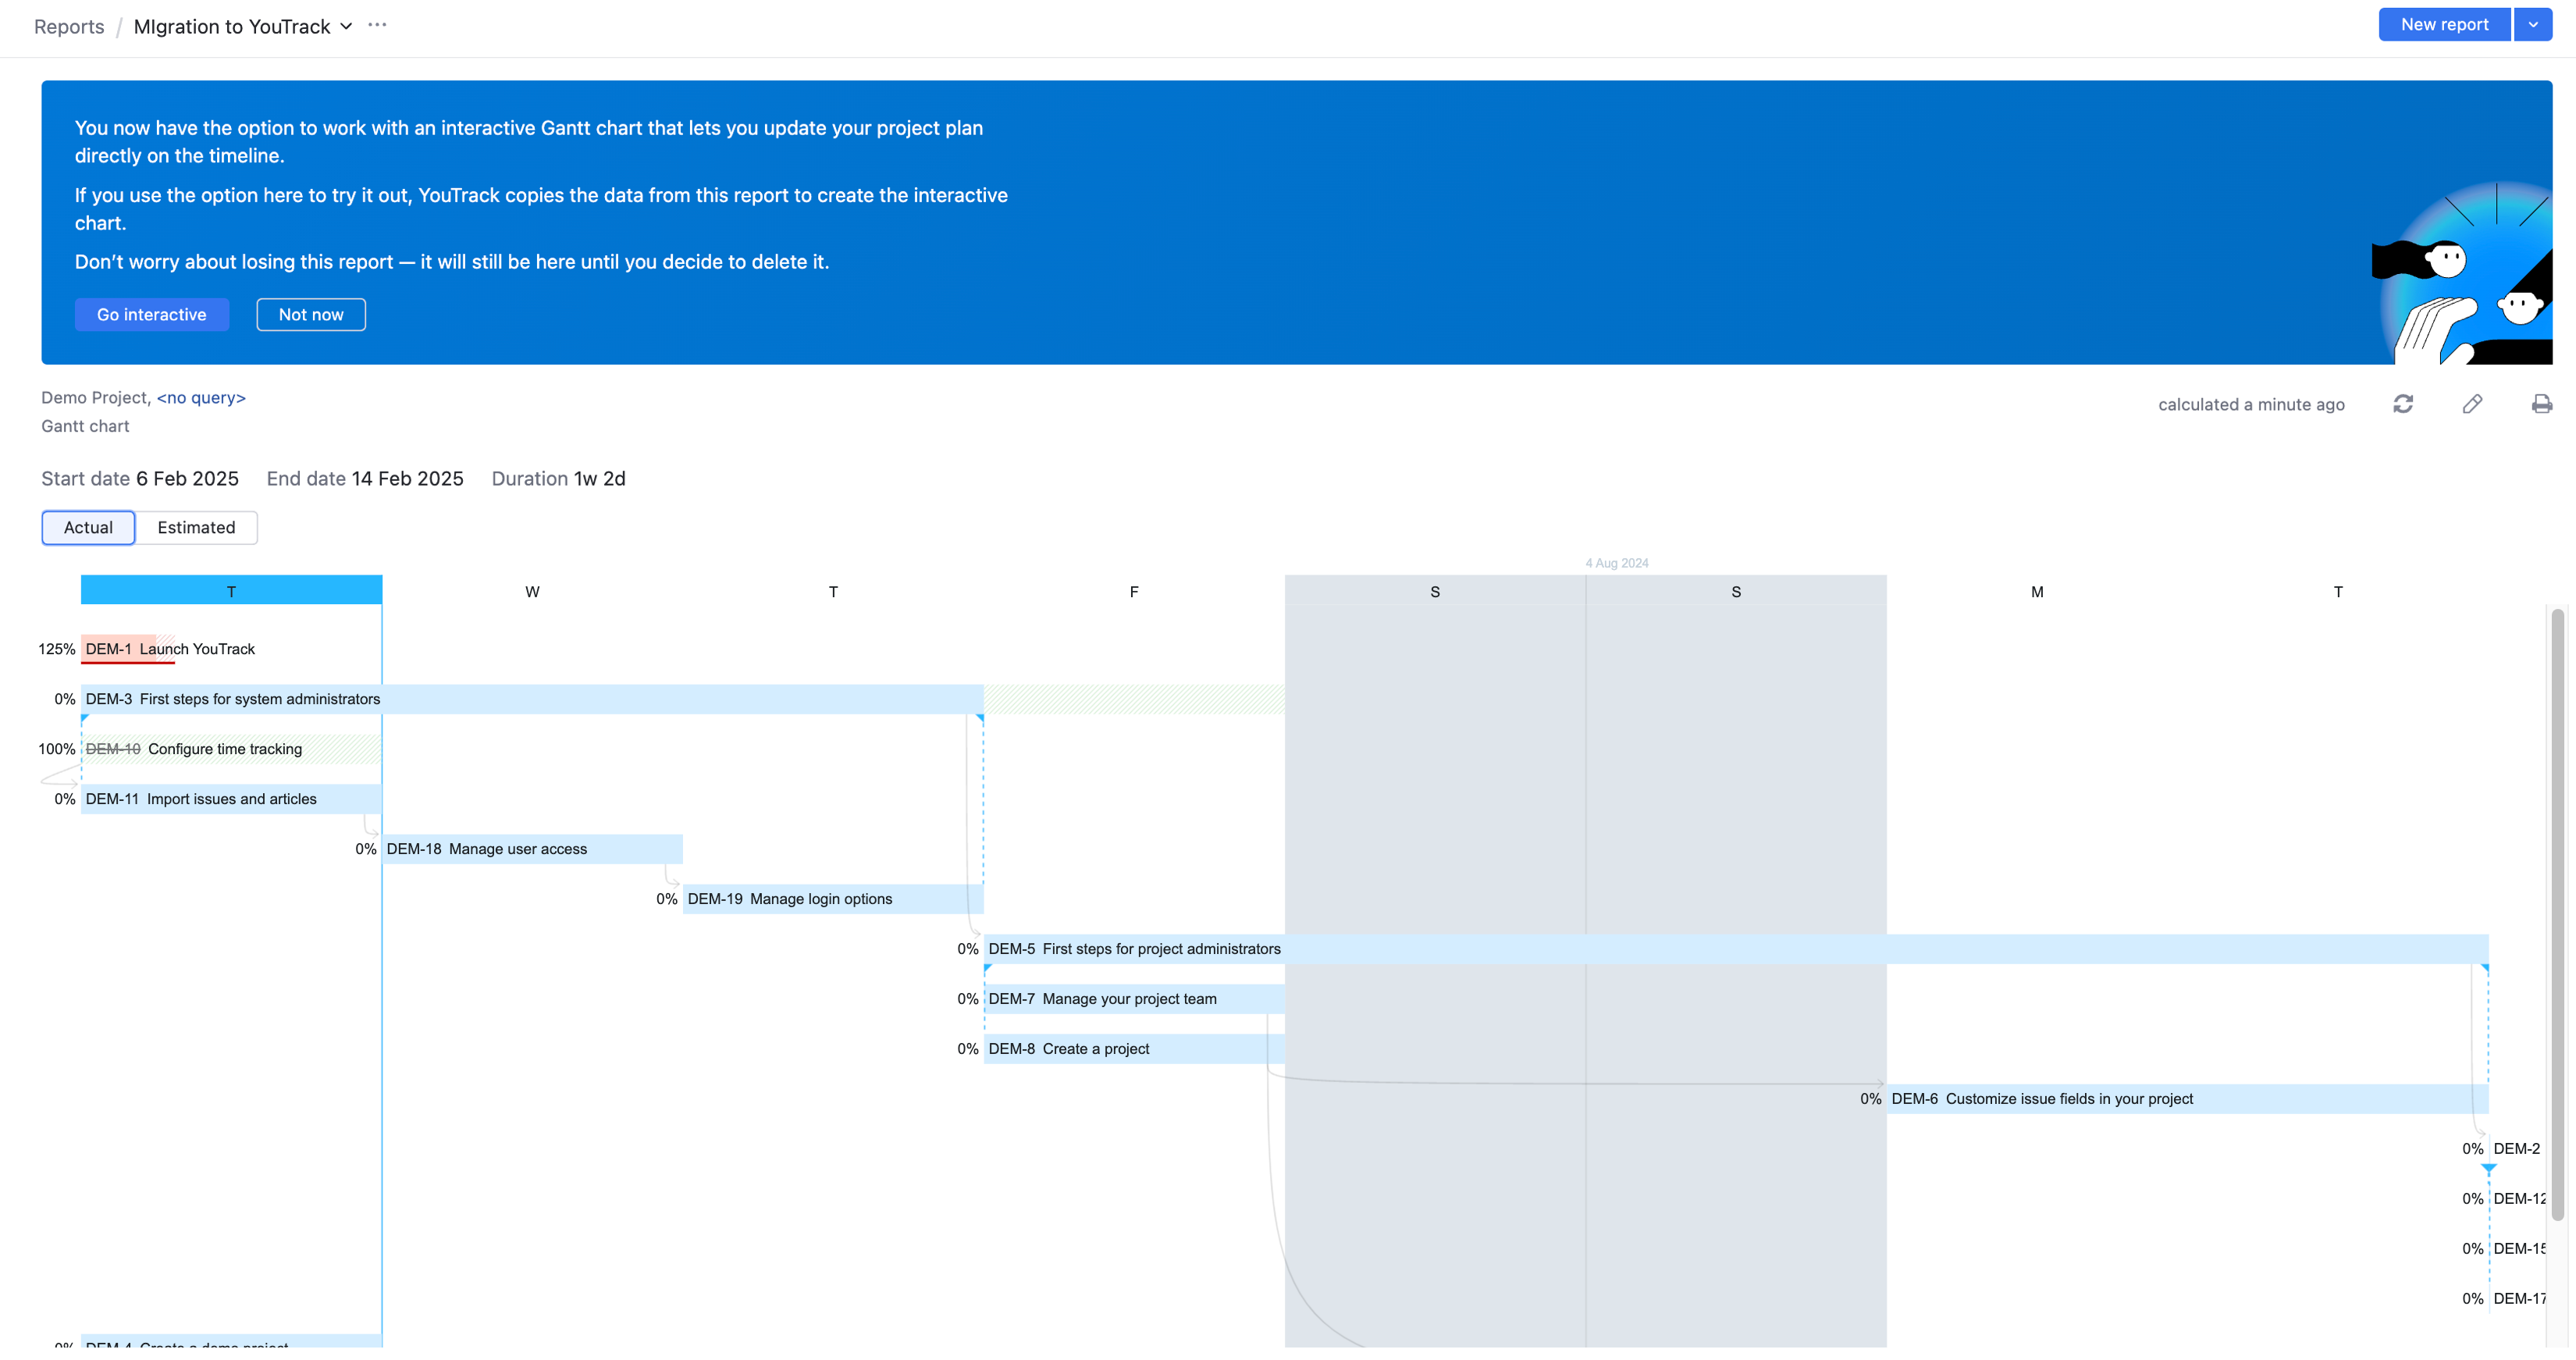
Gantt charts in YouTrack are also available as a static report. This report generates a Gantt chart based on the underlying data that is stored in each of the issues that match the report filter.
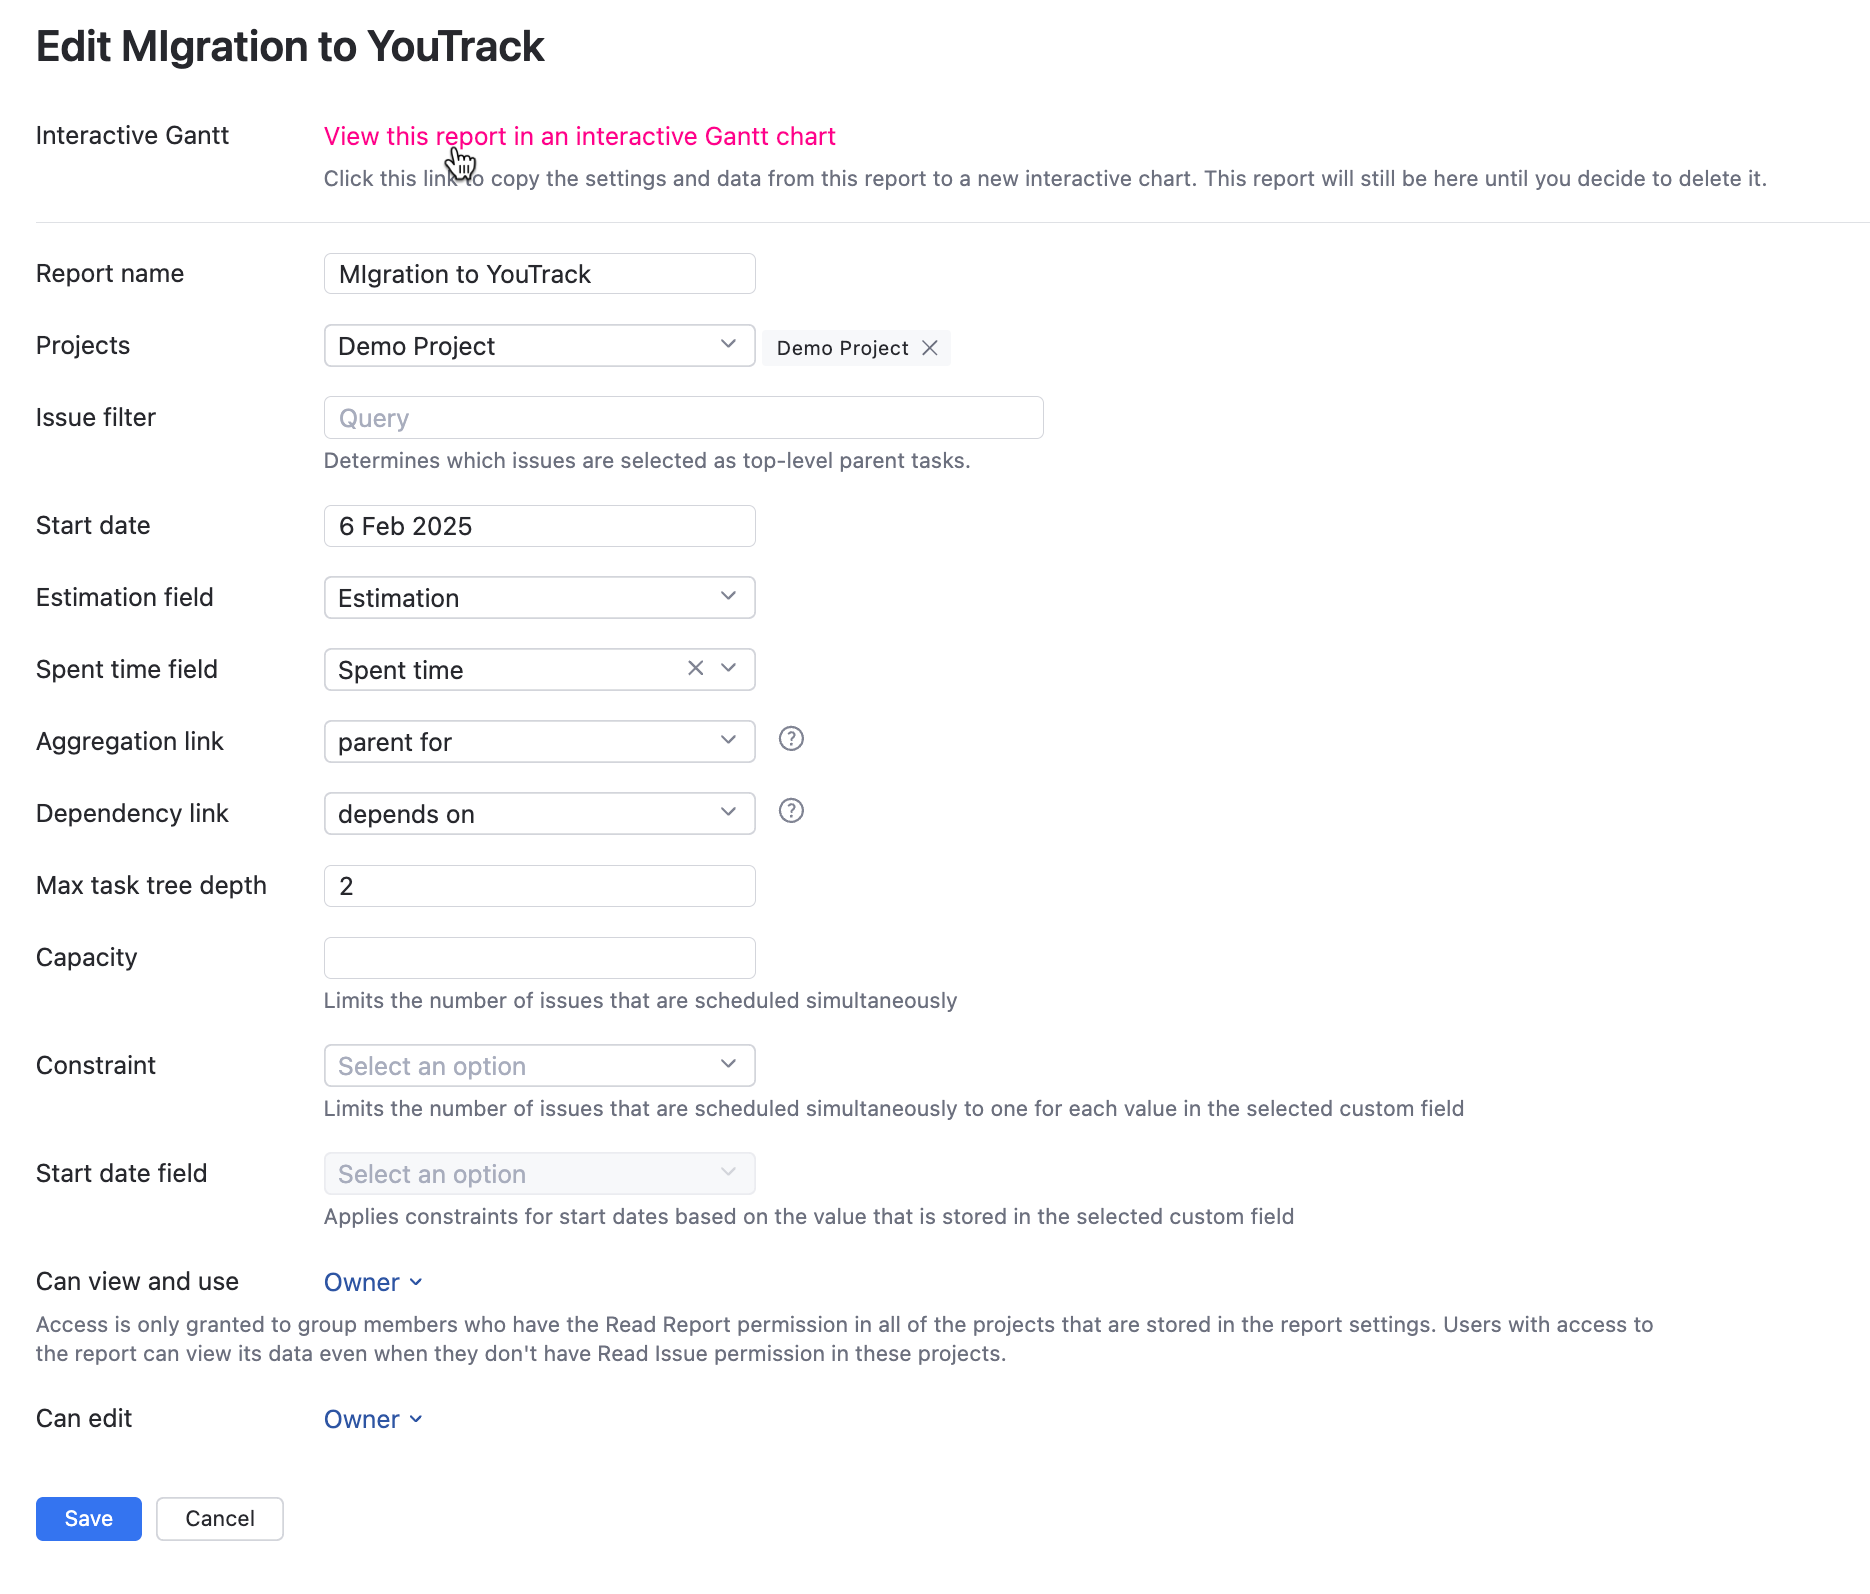
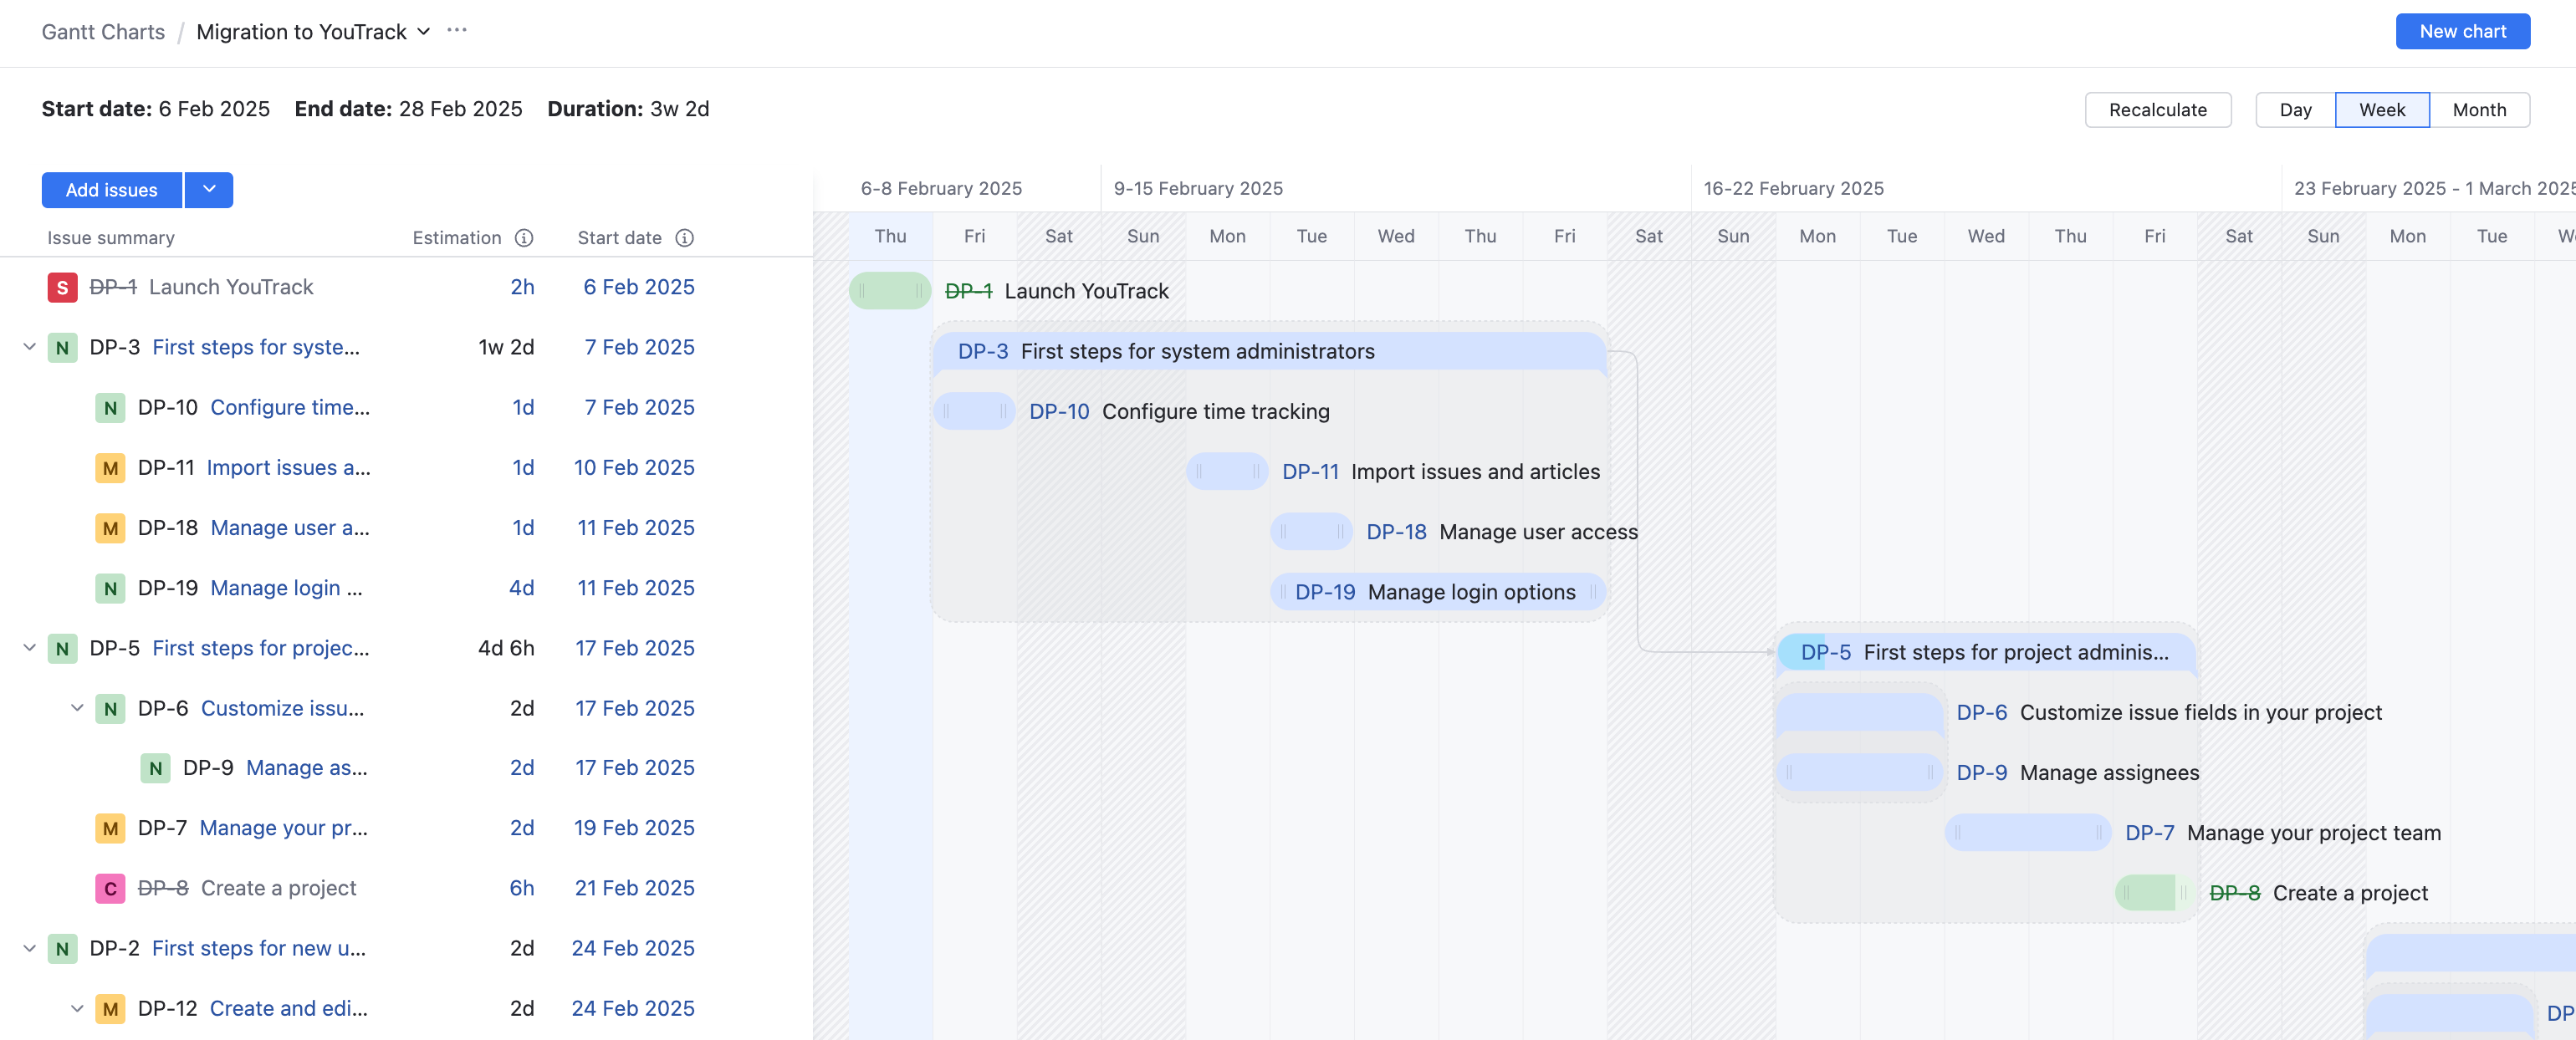
If you would like to transfer your report data to an interactive chart, you can use our built-in migration tool. This tool copies the data from the report and uses that information to create the interactive chart. The original report remains unchanged, which means you can continue using it to report your progress while managing the actual issues on the interactive version.
To migrate data from a Gantt chart report to a new Gantt chart:
The original static Gantt chart can still be accessed by clicking Reports in the application header.
The new interactive Gantt chart created can be accessed by clicking Gantt Charts in the application header.


