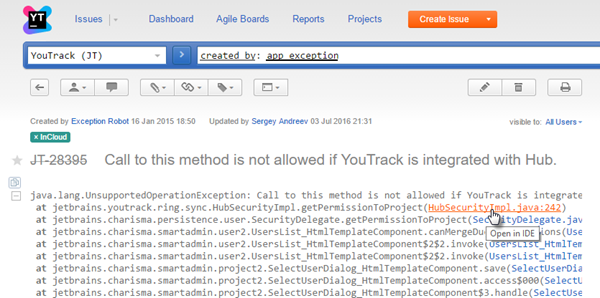
Open Stacktraces in an IDE
Many development teams use YouTrack to report and track bugs in their applications. Programmers and testers often analyze exceptions to locate and fix these bugs. When an exception is thrown by the application, the common practice is to retrieve the current stacktrace — a report of the active stack frames when the error was encountered — and locate the source of the problem.
There are a few tricks you can use to work with stacktraces in YouTrack.
Testers can paste the stacktrace directly into the issue description when they report an issue.
Customers can copy a stacktrace that is displayed as part of an error message and add it to the issue when they report a bug.
Developers can use the YouTrack REST API to automatically generate issues when the application throws an error and copy the stacktrace to the issue.
You can install plugins in your integrated development environment that let you navigate directly from a stacktrace in an issue description or comment directly to the problematic source code.

YouTrack automatically recognizes and formats Java and C# stacktraces that are inserted into an issue description or comment. You do not have to use Wiki markup to format a stacktrace. When the stacktrace is formatted, references to source code and other issues are set as links. You can click these links to open the target reference in your IDE.
To enable the Open in IDE feature:
Install the YouTrack Integration Plugin. This plugin is available for IntelliJ IDEA, PhpStorm, PyCharm, RubyMine, WebStorm, AppCode, CLion, Rider, and MPS.
Install the TeamCity Integration plugin. You do not need to use TeamCity, just install the TeamCity plugin in your IDE. This plugin is available for all IntelliJ Platform IDEs, Eclipse, and Microsoft Visual Studio