The IDE for Spring developers
IntelliJ IDEA provides a rich set of built-in developer tools and support for the Spring framework in both Java and Kotlin code, including Spring MVC, Spring Boot, Spring Integration, Spring Security, and Spring Cloud.
Get started with Spring development
Generate a Spring Boot project right from inside your IDE.
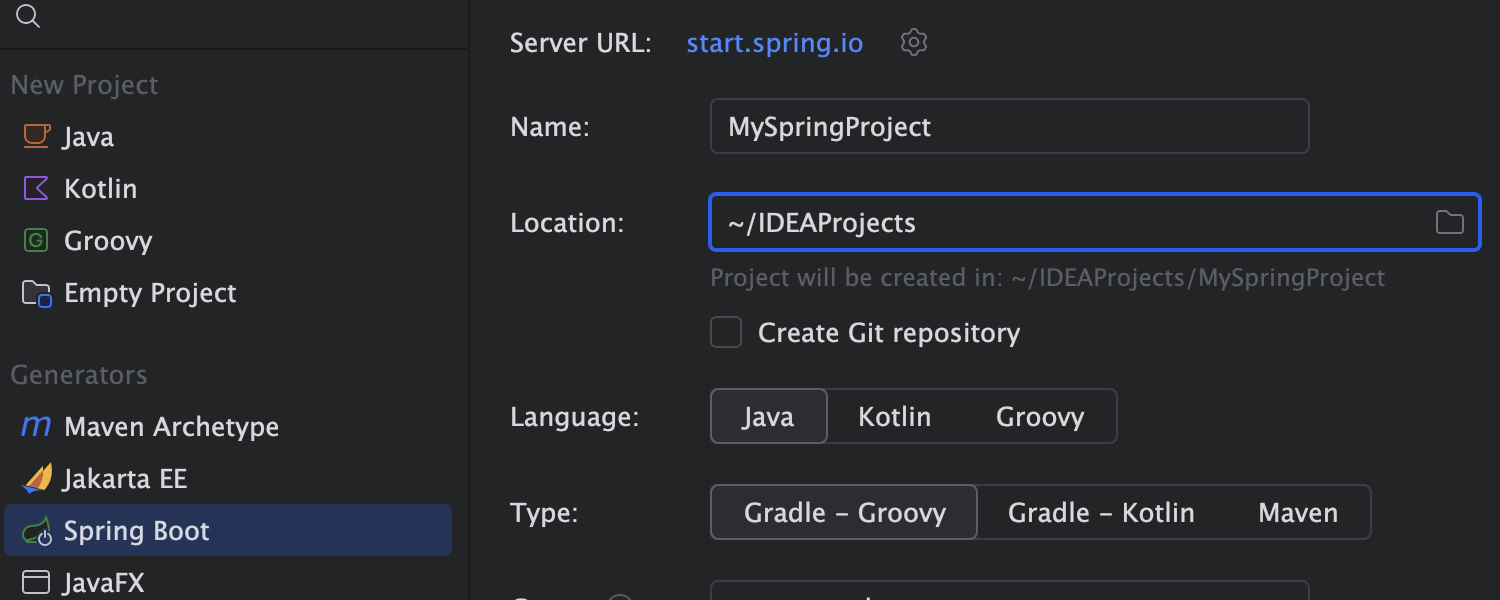
Create a Spring Boot project in seconds
Create your Spring Boot project in a few clicks, set up the necessary dependencies, and start coding right away.
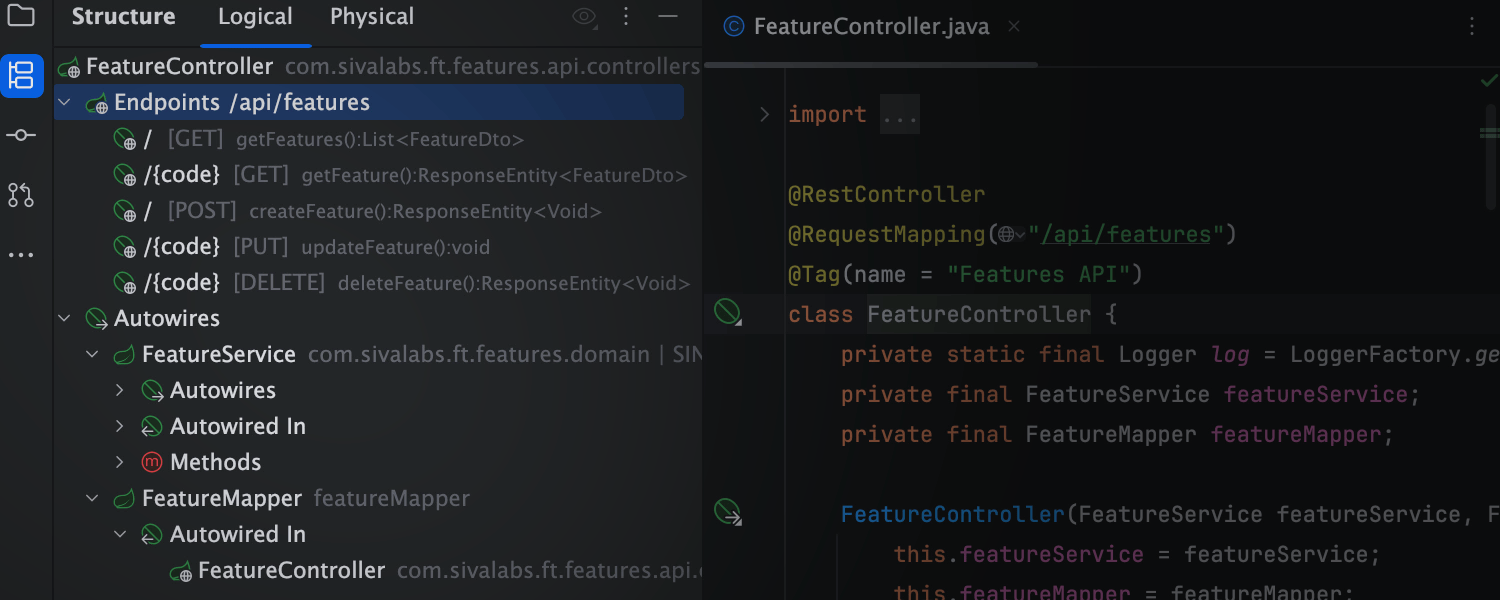
Understand the component connections – instantly
Explore your app with a Spring-aware Logical Structure view. Easily follow autowiring paths between beans, spot key relationships between them at a glance, and explore new codebases with ease.
Intelligent coding assistance
Enjoy outstanding coding assistance for your Spring-based source code in both Java and Kotlin.
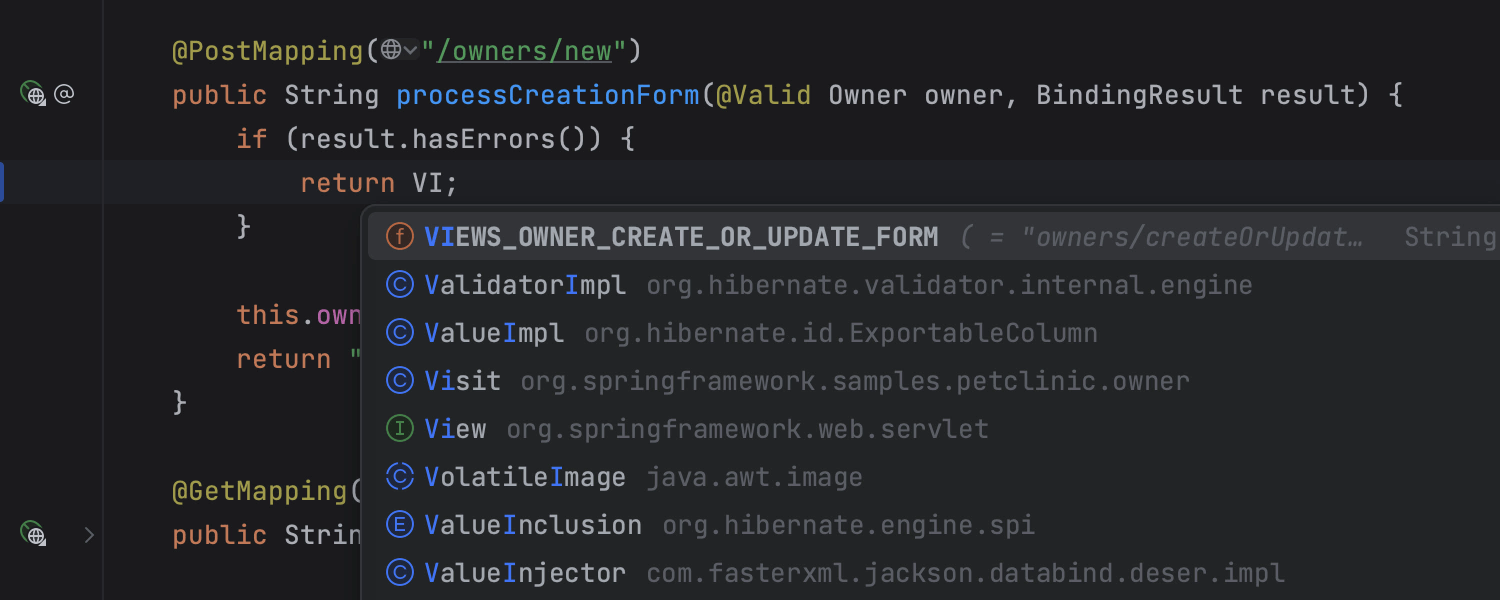
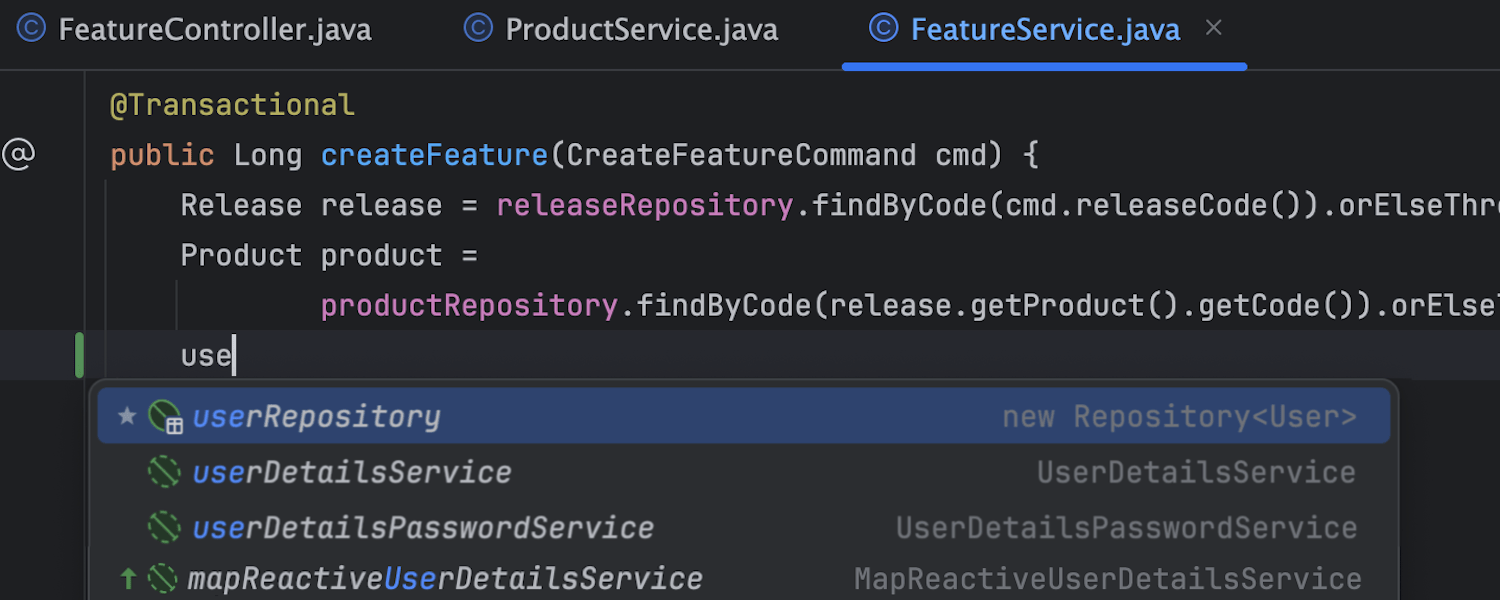
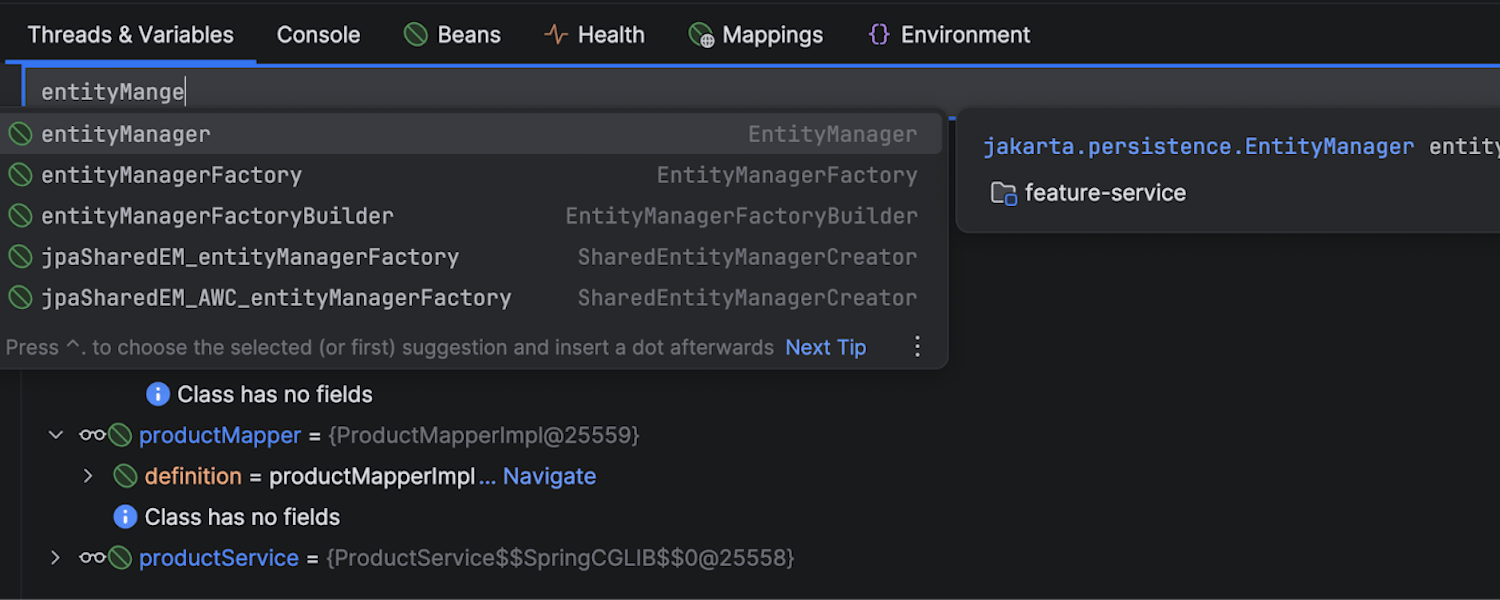
Smarter code completion for Spring applications
Get unparalleled Spring‑aware completion for both Java and Kotlin.
The IDE automatically suggests beans as you type and generates the autowiring code for you,
helping you focus on building features instead of boilerplate.
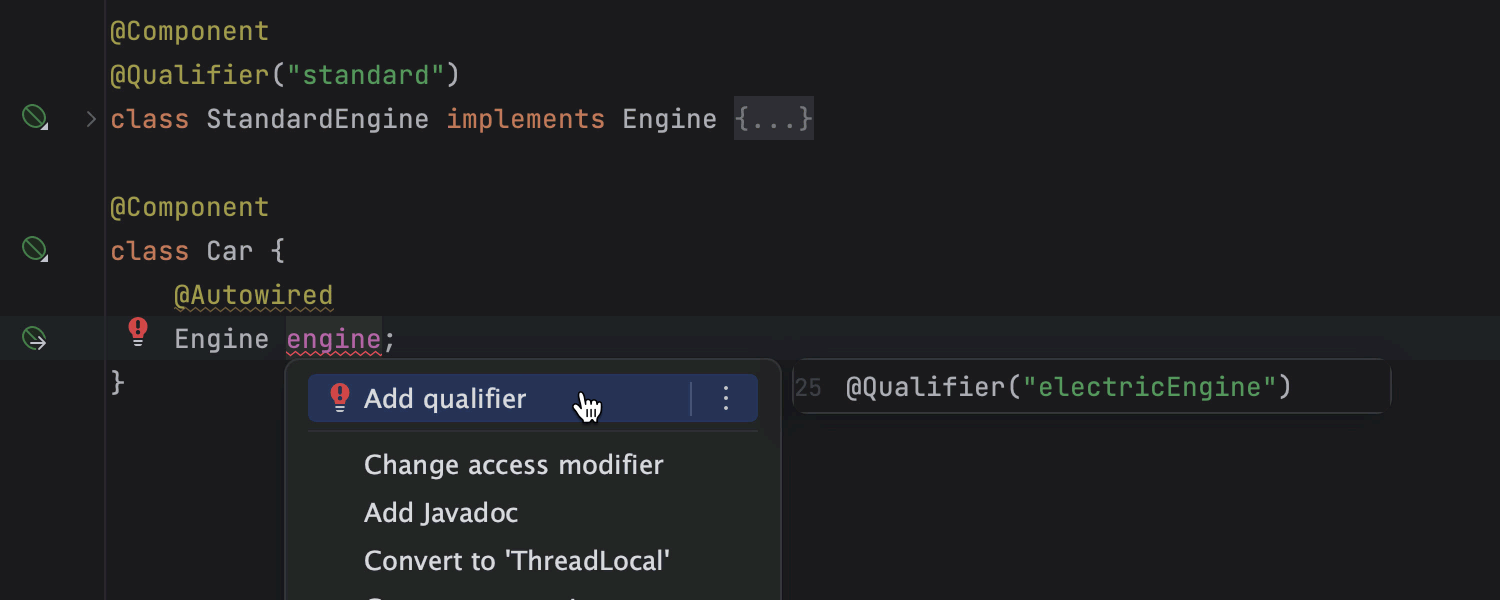
Catch and fix Spring issues on the fly
The IDE detects errors and probable bugs in your Spring project, even before you compile and run it, and shows you an explanation and offers fixes. The IDE has dozens of Spring-specific inspections covering a wide range of problems, such as bean class autowiring errors and incorrect profile expressions.
Create repositories on the go
Create a repository for Spring Data JPA and JDBC simply by typing a name for it. IntelliJ IDEA will take care of the rest, like generating the code and autowiring the repository. You can also add query methods right in the editor, so there’s no more switching between files and losing focus.
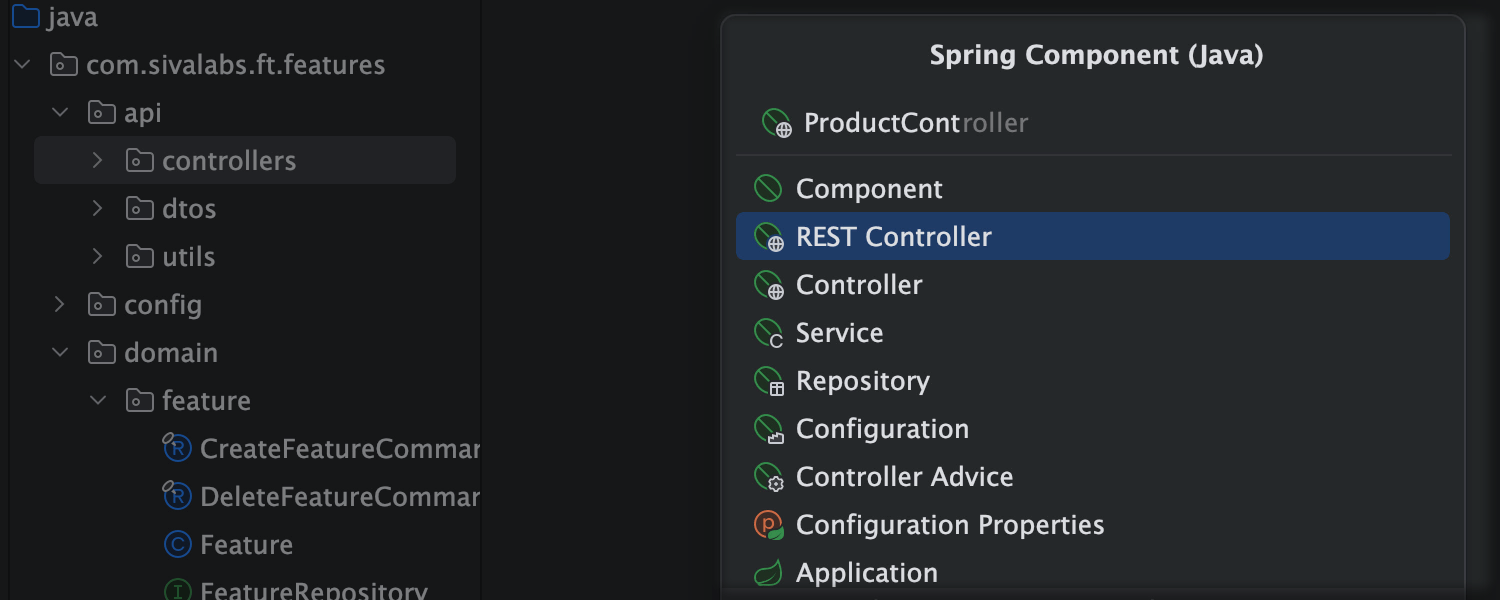
Create Spring components easily
Save time and reduce errors with the dedicated dialog for creating Spring beans. Just enter a name, and IntelliJ IDEA will add all the required code and annotations.
A debugger built specially for Spring
The Spring Debugger plugin for IntelliJ IDEA recognizes Spring context and provides you with tools to inspect and interact with Spring applications running in debug mode.
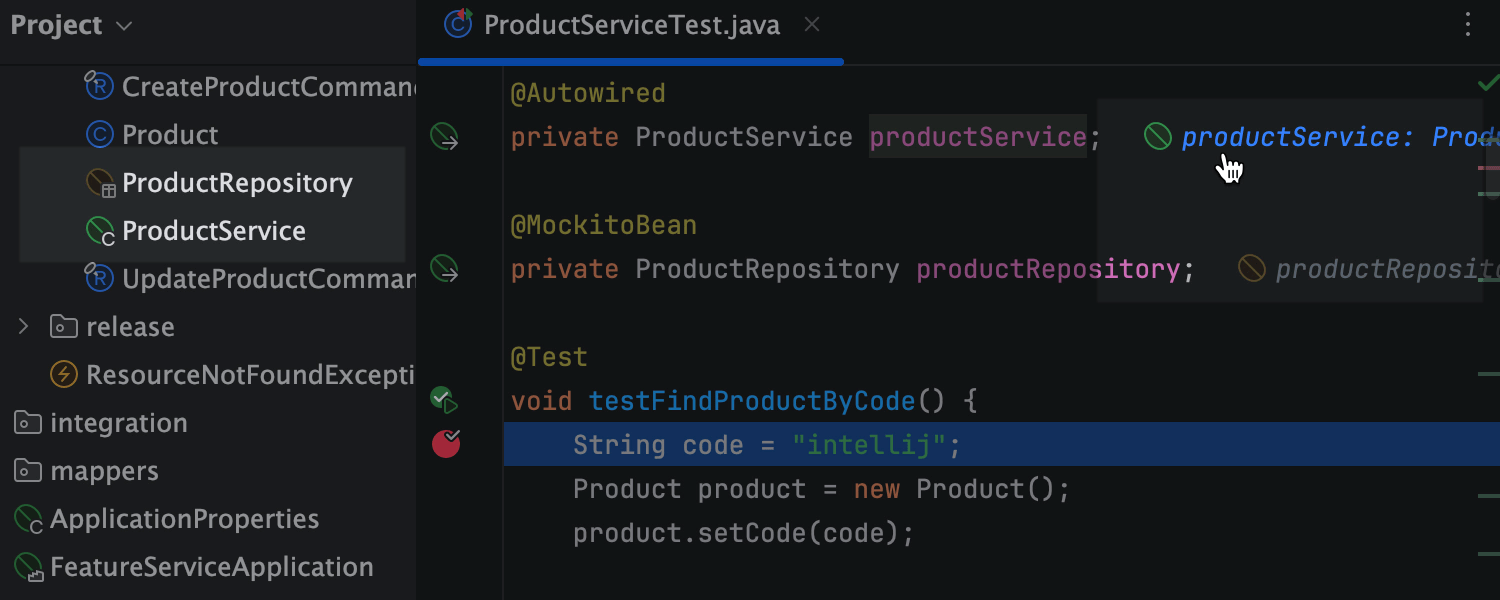
Get instant visibility into beans while debugging
View all Spring-managed beans directly in the Project view while debugging. Grayed-out entries indicate uninstantiated beans, while orange ones highlight mocked beans (via Mockito), including those with properties loaded from config files.
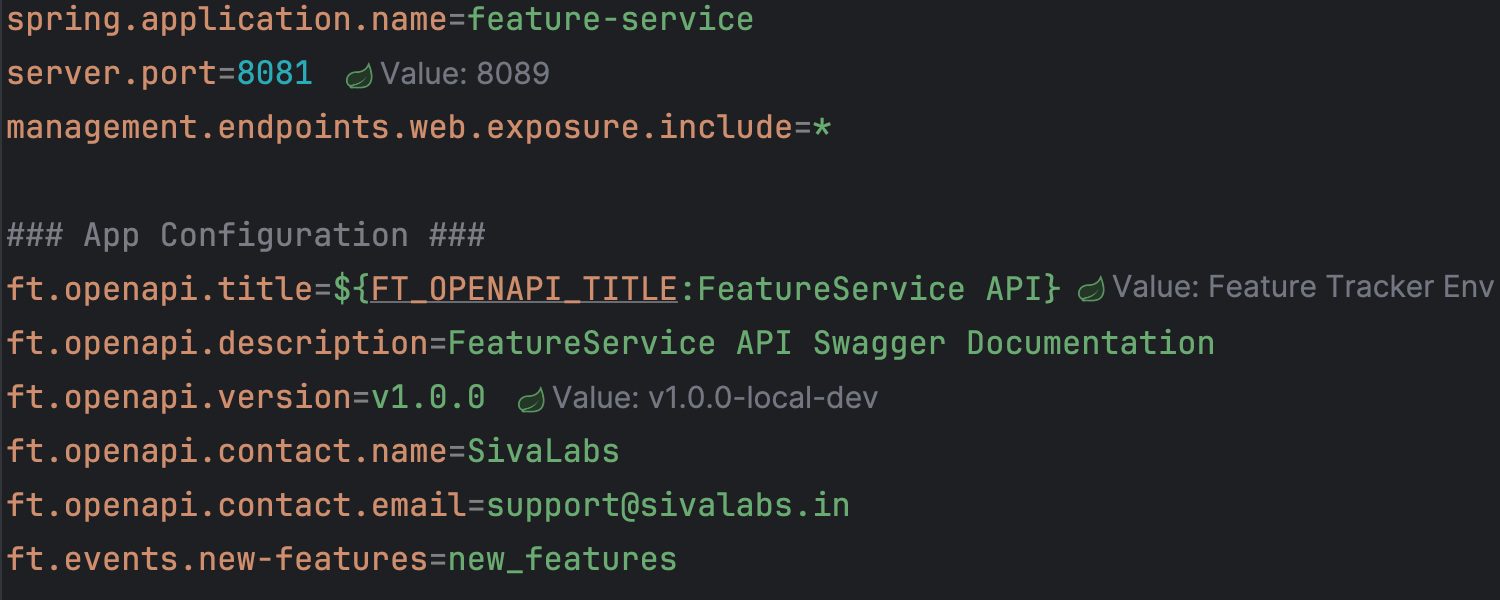
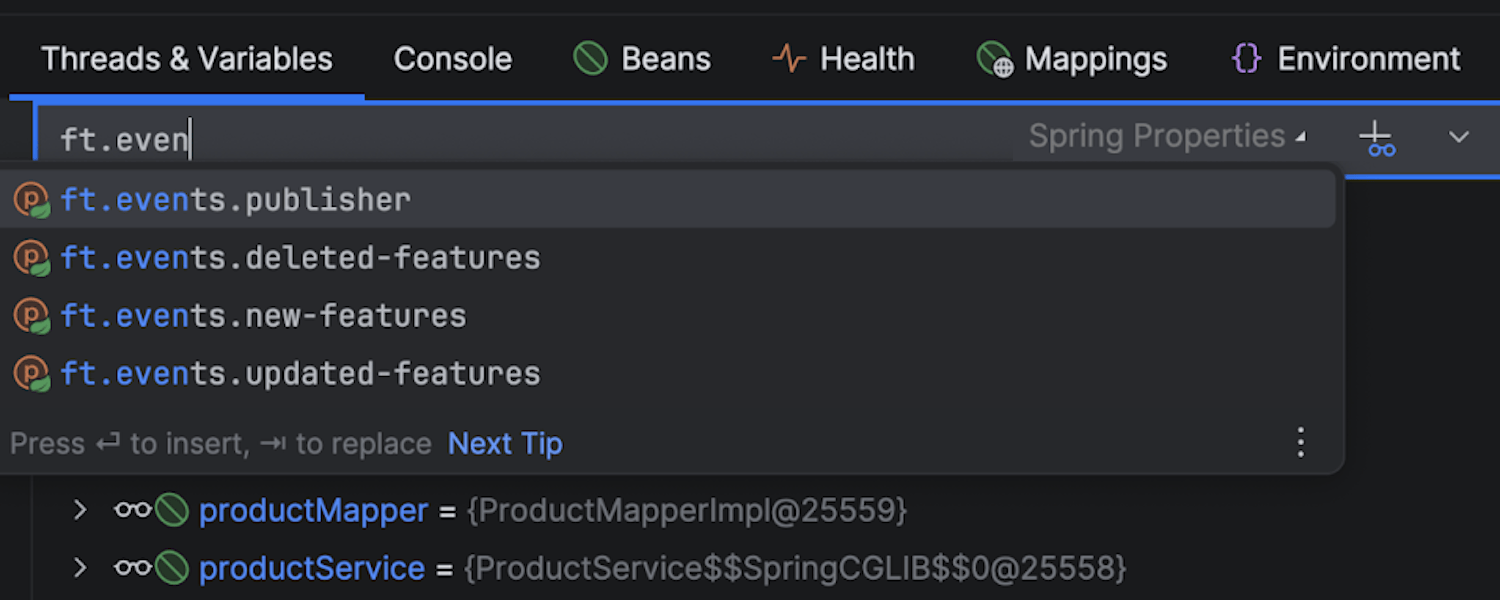
View effective property values directly in config files
See the active runtime value right in .properties and .yaml Spring
configuration files,
highlighting overridden values and their source locations. Click on the inlay value to jump
to its definition in the code. This helps avoid misconfigurations and save time tracing
where a setting originates.
Invoke any bean method
With the debugger's expression evaluator in IntelliJ IDEA, you can call any method from any Spring bean in the current context. Trigger scheduled methods, fire async events, or hit external APIs – it's like having a REPL for your Spring app, right inside the debugger.
Easily evaluate property values
The Spring debugger's expression evaluator also lets you evaluate property values. Inspect effective property values, observe value sources, and follow the value assignment stack trace to understand the application configuration – all in one place.
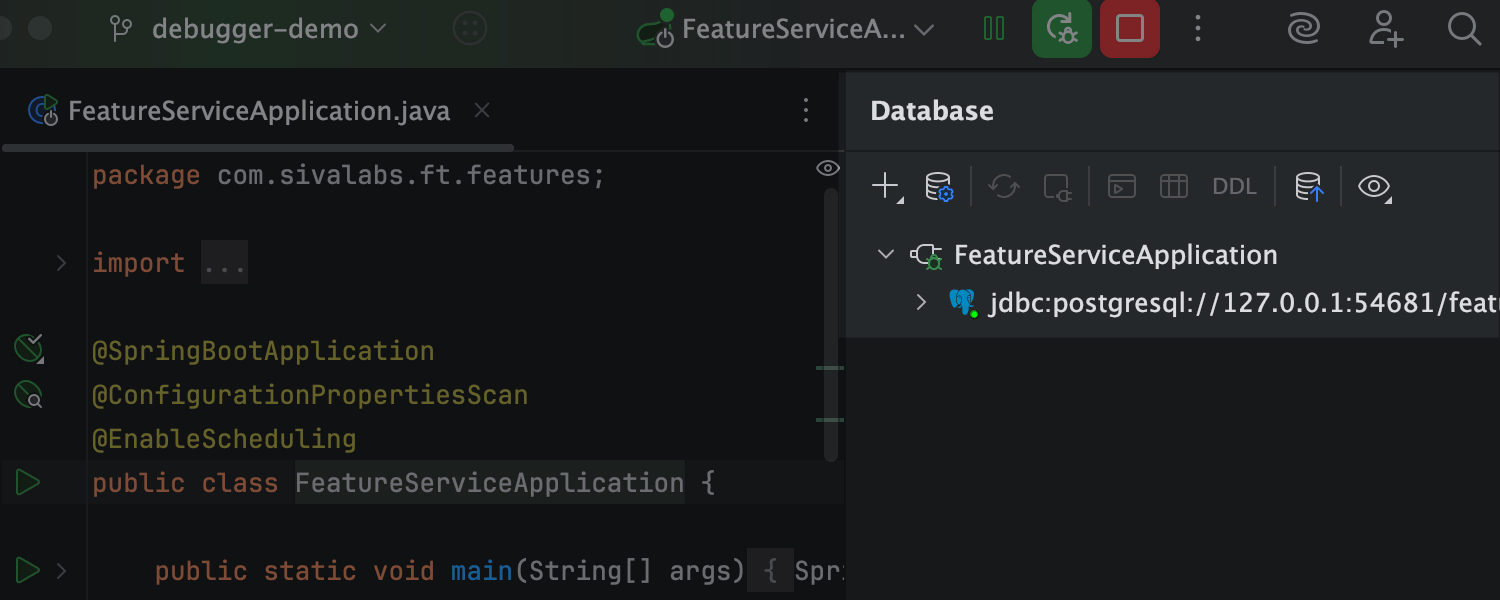
See active database connections instantly
No manual setup is needed – IntelliJ IDEA detects and shows active data source connections right in the Database tool window as soon as your Spring app starts running.
Track database transactions with ease
IntelliJ IDEA shows active transactions directly in your code and the Debugger tool window, including isolation levels and propagation.
Instant Spring code navigation
Take advantage of the rich navigation capabilities.
Navigation through gutter icons
Navigate around your code with gutter icons that can take you to the relevant application contexts, to declarations of autowired beans, or between publishers and listeners.
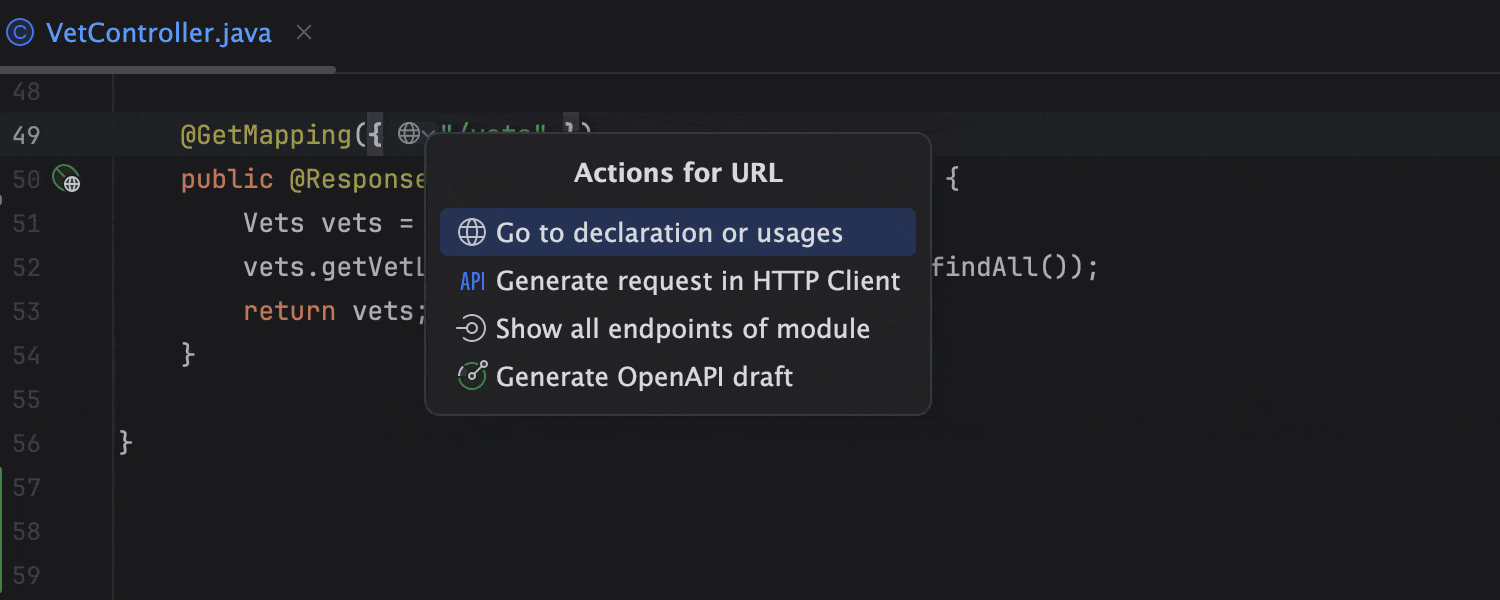
Easy client-service navigation
You can navigate from client to service by clicking on the corresponding URL in your projects with Spring MVC, Spring WebFlux, and Spring Feign.
Even more built-in productivity tools
Get all the tools you need bundled right from the start without having to find and install plugins.
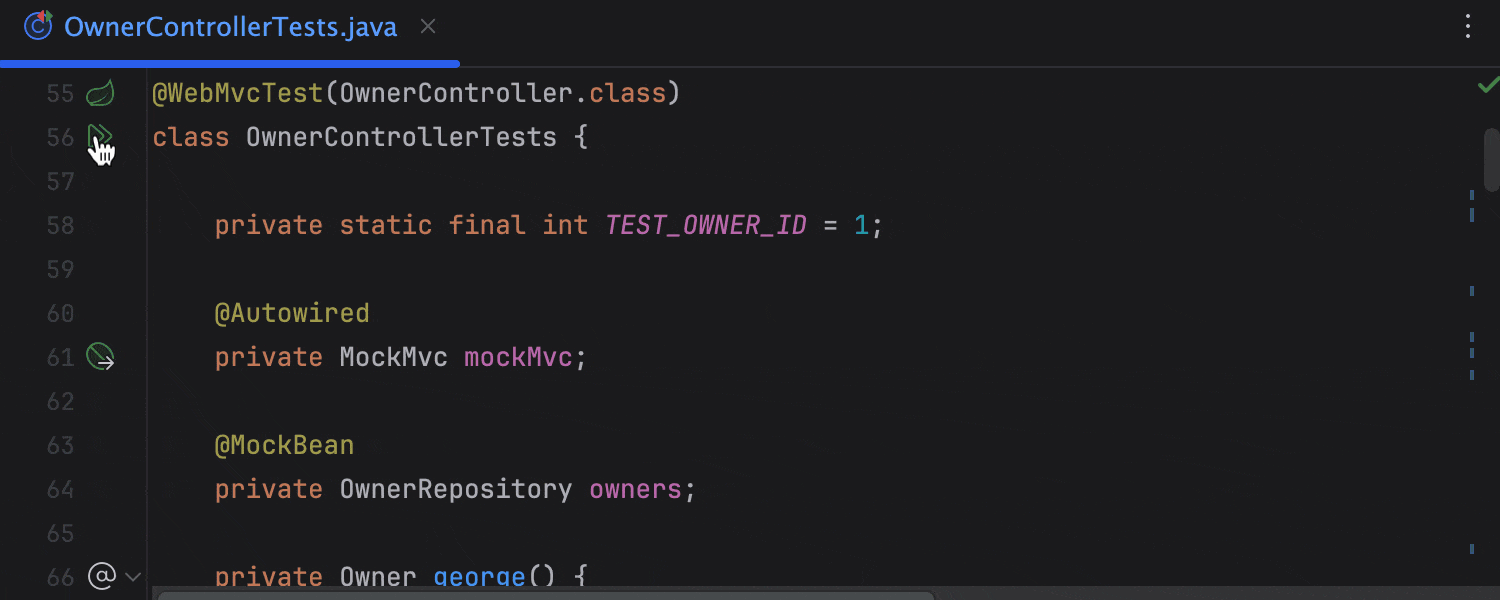
Testing Spring applications
IntelliJ IDEA recognizes classes annotated with Spring test annotations as tests and helps you run them from the editor. What’s more, you can easily start a bunch of tests right from the Services tool window.
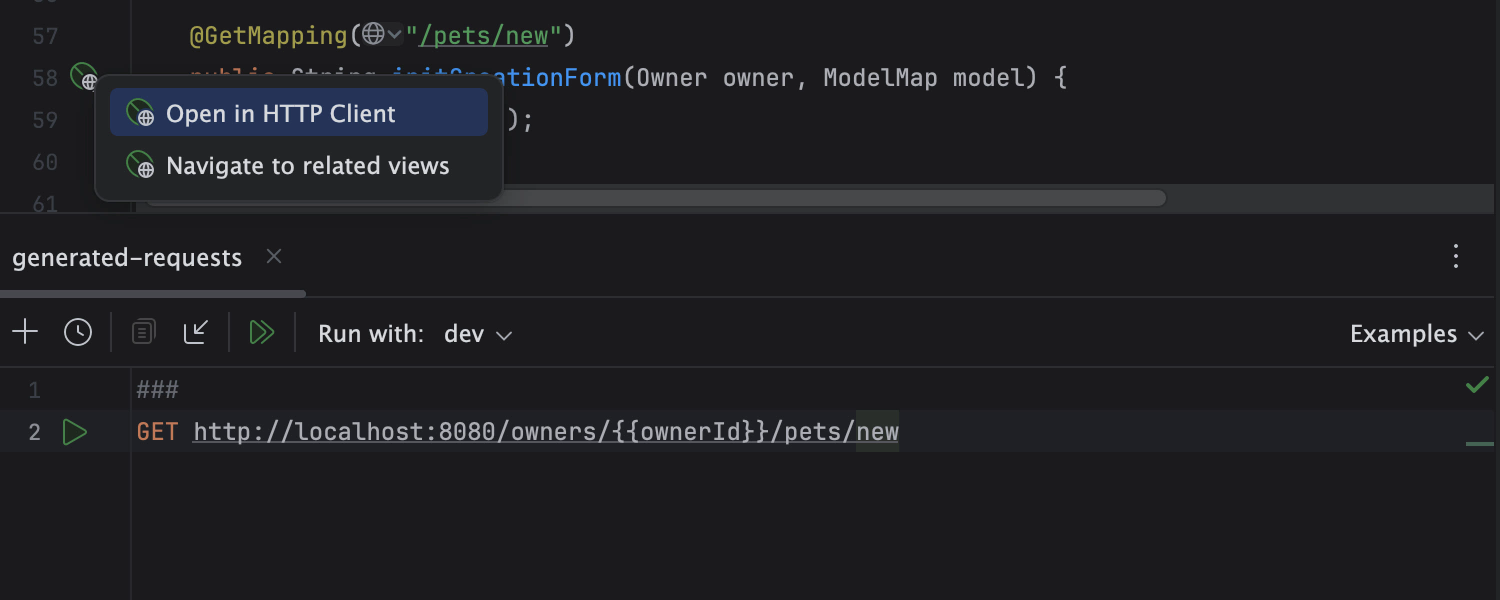
Test web APIs in the built-in HTTP Сlient
Use the integrated HTTP Client to compose, edit, and execute HTTP, gRPC, WebSocket, or GraphQL queries right in the editor while testing your web service.
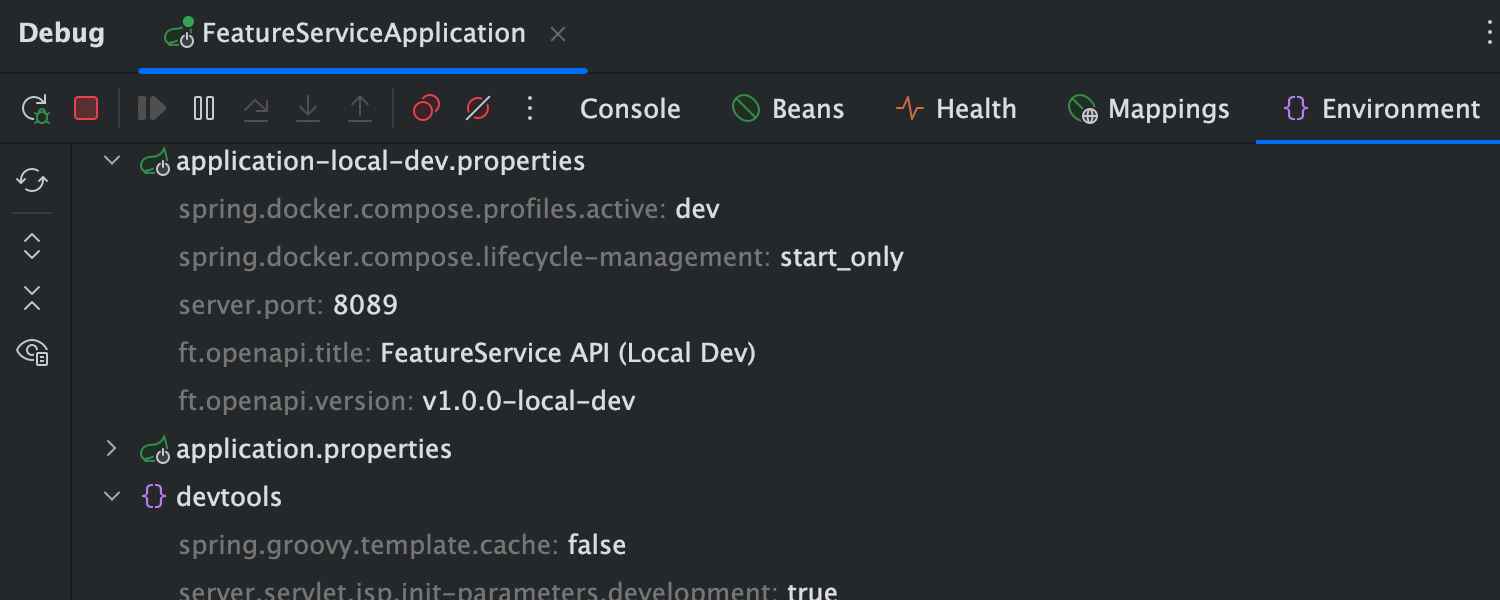
Monitor the app state with Spring Boot Actuator
Actuator tabs help you track the state of your application, with information including loaded beans, health check status, request mappings, and environment variables values – all without leaving the IDE.
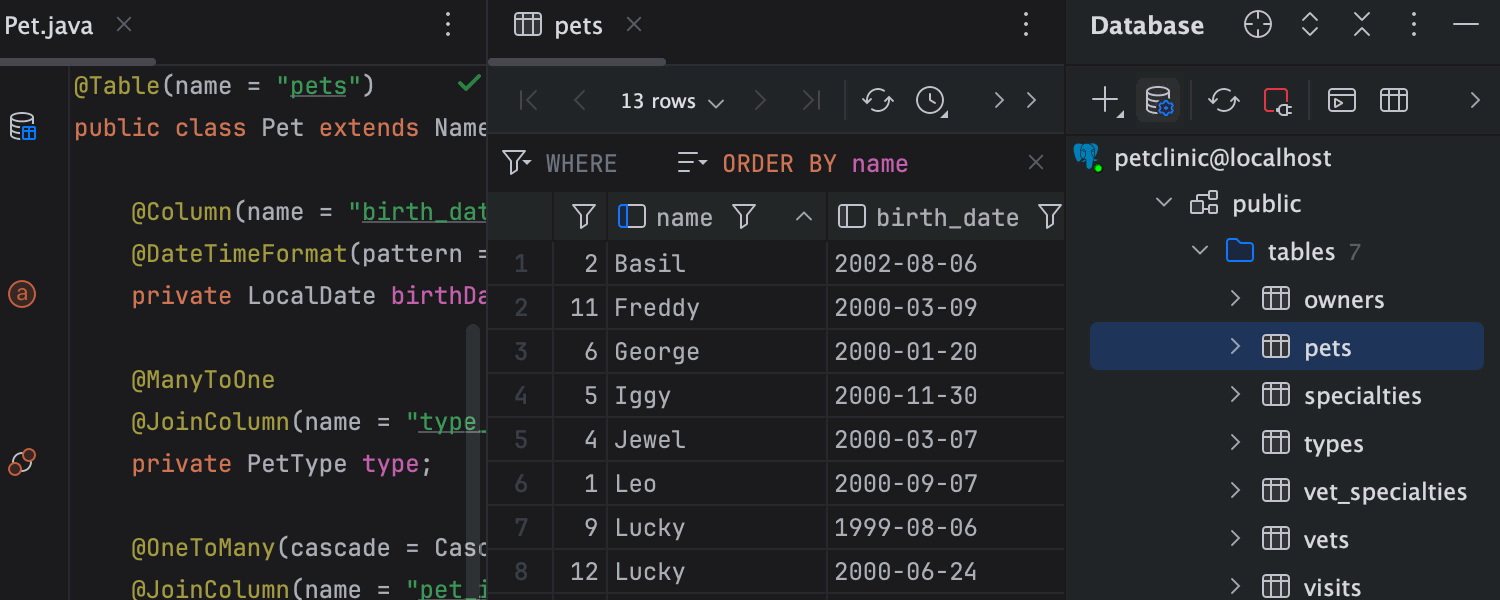
Database tools for Spring
Get intelligent coding assistance when editing SQL, connect to live databases, run queries, browse and export data, and even manage your database schemas in an intuitive GUI right inside the IDE.

Spring Beans Dependencies diagram
View and analyze dependencies between beans in your project with the Spring Beans Dependencies diagram. Find the Spring element you need and jump to it right from the diagram.
Spring Framework tutorials
Build modern web applications with support for microservice architectures, cloud systems, reactive processing, and serverless workloads in IntelliJ IDEA with ease.
-
Create your first Java Spring application with Spring Boot
This simple “Hello World” tutorial describes how to create and run a Spring application in IntelliJ IDEA.
-
Explore Spring support features
This tutorial shows you how IntelliJ IDEA helps with writing code, analyzing your Spring application, and managing it at runtime.