Code analysis
On-the-fly analysis
AppCode constantly keeps a watchful eye on the quality of your code. No need to run additional tools: all errors and warnings are shown right in the editor, and for most of them, the IDE has a quick-fix suggestion.
To go over the errors in a file, navigate from one highlighted line to another by pressing F2 /⇧F2.
In addition to detecting compiling errors, different code inefficiencies are identified as well: whenever there's unreachable code, unused code, non-localized string, unresolved method, memory leaks or even spelling problems, you'll see it right away.
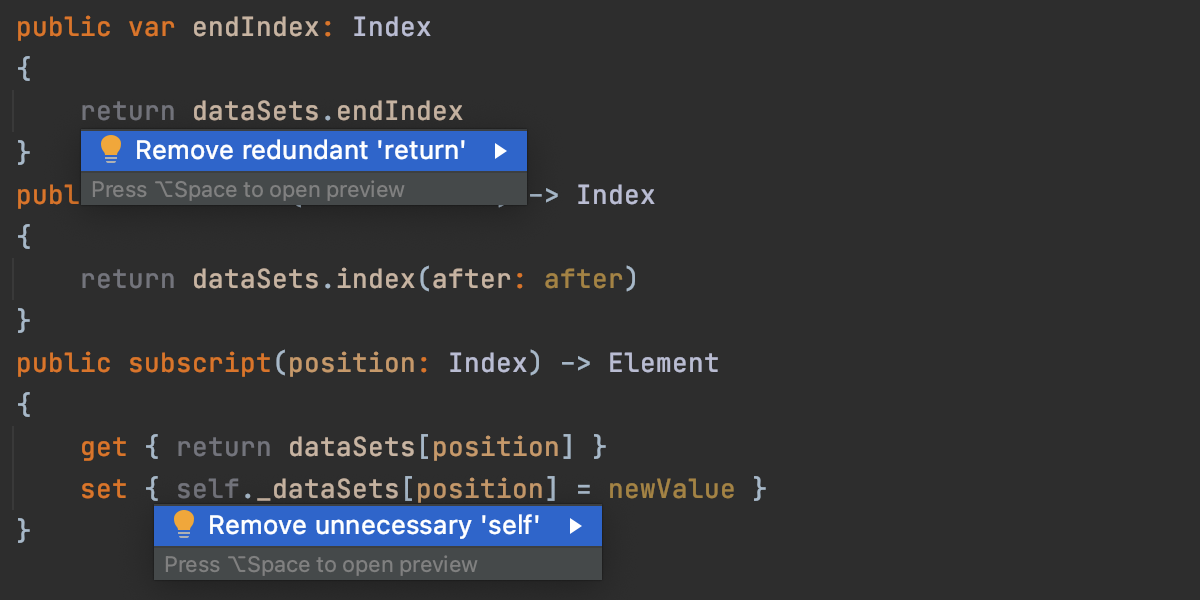
Quick-fixes
AppCode provides over 60 code inspections just for Swift, Objective-C, C and C++, plus a number of code inspections for other supported languages, all running on the fly.
On the right side of the editor you can see the analysis status of the whole file. The icon in the top-hand right corner changes its color when a problem is detected.
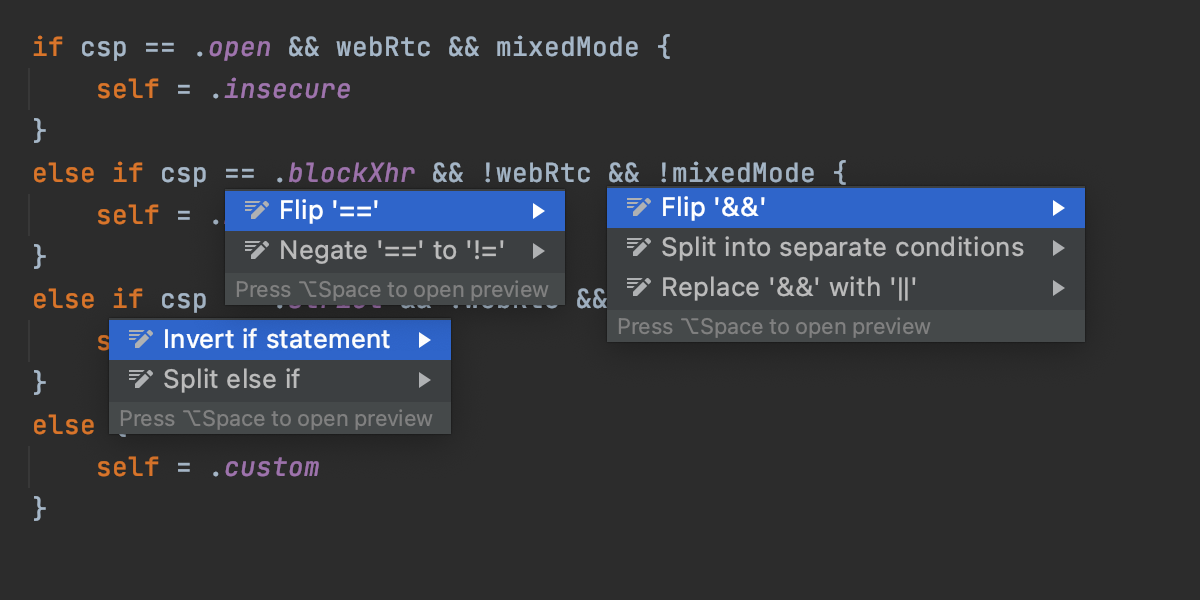
When a problem is highlighted, place the caret on it, press ⌥Enter and choose from the suggested quick-fix solutions. Alternatively, enter the context menu by clicking the light bulb next to the line.
Inspect code
AppCode comes with an integrated Clang Analyzer and can show you more than 2000 code
inspections and error diagnostics results from Clang compiler right in the editor.
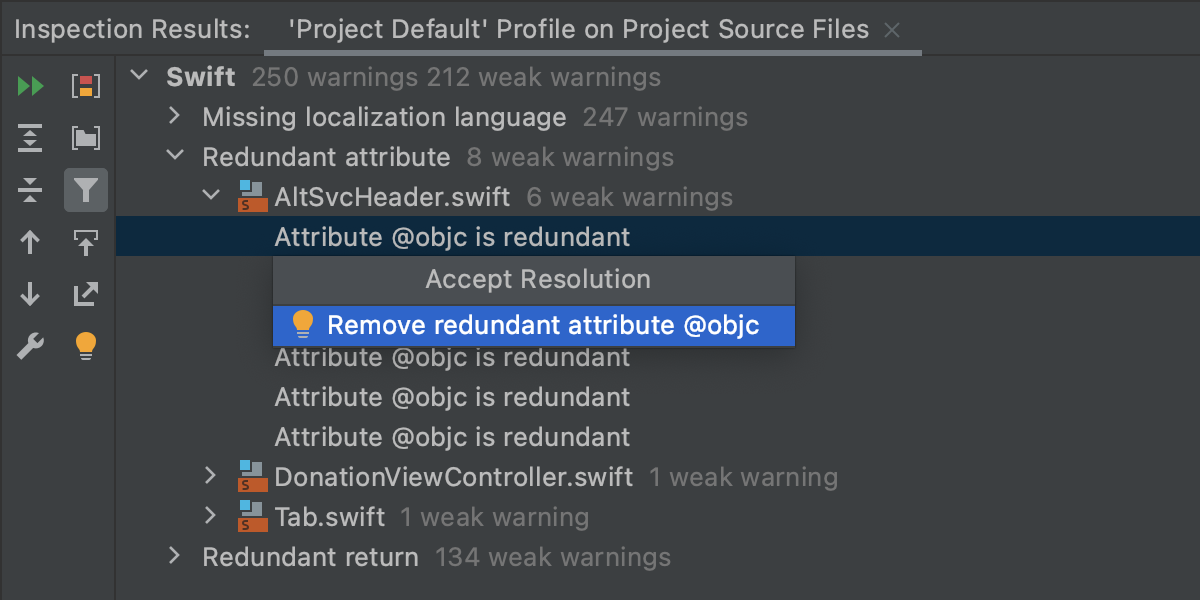
Alternatively, you can review them in bulk mode using Code | Inspect Code.
If you’d like to eliminate a particular problem from your entire code base, you can use Run inspection by name (⌥⇧⌘I ) and select the desired scope. A separate window with inspection results will open in which you can regroup issues and batch-apply quick-fixes to all the issues, where possible.