AI for Engineering Teams / AI Agent Observability for Software Engineering Teams: A Complete Guide

AI Agent Observability for Software Engineering Teams: A Complete Guide

AI agent observability is the practice of continuously monitoring what your AI agents actually do. That means tracking the tasks they run, what each one costs in AI credits, and whether the results meet the quality bar you've set. Skip it, and you're flying blind. Agents run, tasks get processed, credits get consumed, and you have no reliable way to know if any of it is actually working.

What AI agent observability tells you:

  1. Which agents are running and what tasks they're executing.
  2. How many tokens each task consumed and what it cost in AI credits.
  3. Whether outputs were accepted, revised, or rejected by your team.
  4. Where failures happened and why.
  5. Which agents are operating outside their expected behavioral range.

What is AI agent observability?

More formally, AI agent observability is the engineering discipline of making AI agent behavior visible, measurable, and auditable across your organization. It applies to any team that has deployed agents to handle real development work (code generation, automated code review, test writing, dependency updates, etc.) and needs to know whether those agents are doing that work correctly and efficiently.

The closest analogy in traditional engineering is APM (application performance monitoring) combined with distributed tracing. When you add monitoring hooks to a microservices system with OpenTelemetry, you get traces showing exactly which service handled a request. You can see how long each step took, where latency crept in, and what failed.

AI agent observability does the same thing for AI-driven workflows. It traces the full arc of an agent's actions, from the initial task prompt to the final output. That includes every intermediate tool call, model invocation, and decision made along the way.

The analogy only stretches so far, though. Traditional APM measures whether a system behaves correctly in a deterministic sense. It asks whether the API returned 200 and whether the response arrived under the latency threshold. AI agent observability has to cope with a different kind of system. The same prompt can produce meaningfully different outputs. "Correct" is often a judgment call. Costs scale with token consumption rather than CPU cycles.

AI agent observability covers three dimensions. Activity is what the agent did, step by step. Cost is how many tokens it consumed and what that translates to in AI credits. Output quality is whether the result was accepted, revised, sent back, or rejected. Put those three together, and you have a complete picture of whether your agents are delivering value or burning resources.

Why engineering teams need it

The common assumption is that AI agents are reliable enough to run without close monitoring once they're deployed. That assumption can be very costly.

Runaway AI credit consumption is the most immediate risk. An agent stuck in a retry loop, or one handed a scope it can't resolve efficiently, will burn through AI credits at rates that are hard to predict from first principles. Without usage tracking per agent, per team, and per task type, the bill arrives before anyone notices the problem.

Quality drift is subtler but just as damaging. An agent that worked well in the first sprint may start producing outputs that require more thorough review six weeks later. The codebase might have changed. A prompt could have been tweaked. Or a new model version is handling context differently than the last one. If your only signal is that the "agent ran successfully", you won't catch quality drift until a developer raises a complaint. By then, the damage is done, and developers are stuck reviewing and fixing the bad output.

Compliance exposure closes the argument for observability. If your organization has obligations around how AI is used in code generation or decision support, you need a record of what happened. Auditors and security teams don't accept "the agent handled it" as an answer. Without an audit trail, you can't demonstrate governance. And without demonstrated governance, you're exposed.

What it covers

A mature AI agent observability setup covers five areas. Most engineering teams start with one or two and expand from there.

Activity tracking is the foundation. Every agent run produces a trace. That trace captures the task ID, the agent that handled it, the model it called, the tools it invoked, and the sequence of actions it took. This is the equivalent of a request trace in a distributed system. Without it, you can't debug anything.

Cost and token usage translate agent activity into financial terms. Token counts tell you how much compute an agent used. Tracking against AI credits gives you a comparable unit across different models and providers. The goal is attribution: identifying which team, workflow, and agent type are consuming the most. This data feeds directly into capacity planning and spend governance.

Output quality monitoring tracks what happened to the agent's work after it was produced. The key signals are acceptance rate, revision rate, and override rate. Acceptance rate is the percentage of outputs accepted without revision, revision rate tracks how often a developer substantially rewrote the output, and override rate tracks how often a human rejected the output entirely. These metrics tell you whether the agent is actually pulling its weight or just generating busywork for your team.

Audit trails provide the immutable record of what happened, when, and who reviewed it. The next section covers these in detail.

Anomaly detection sits atop all of the above. Once you have baseline behavior for each agent, things like typical token consumption per task, latency, and acceptance rate, you can alert when an agent deviates significantly from that baseline. An agent that suddenly starts consuming three times its normal tokens per task is either being given harder work or behaving badly. Either way, you want to know.

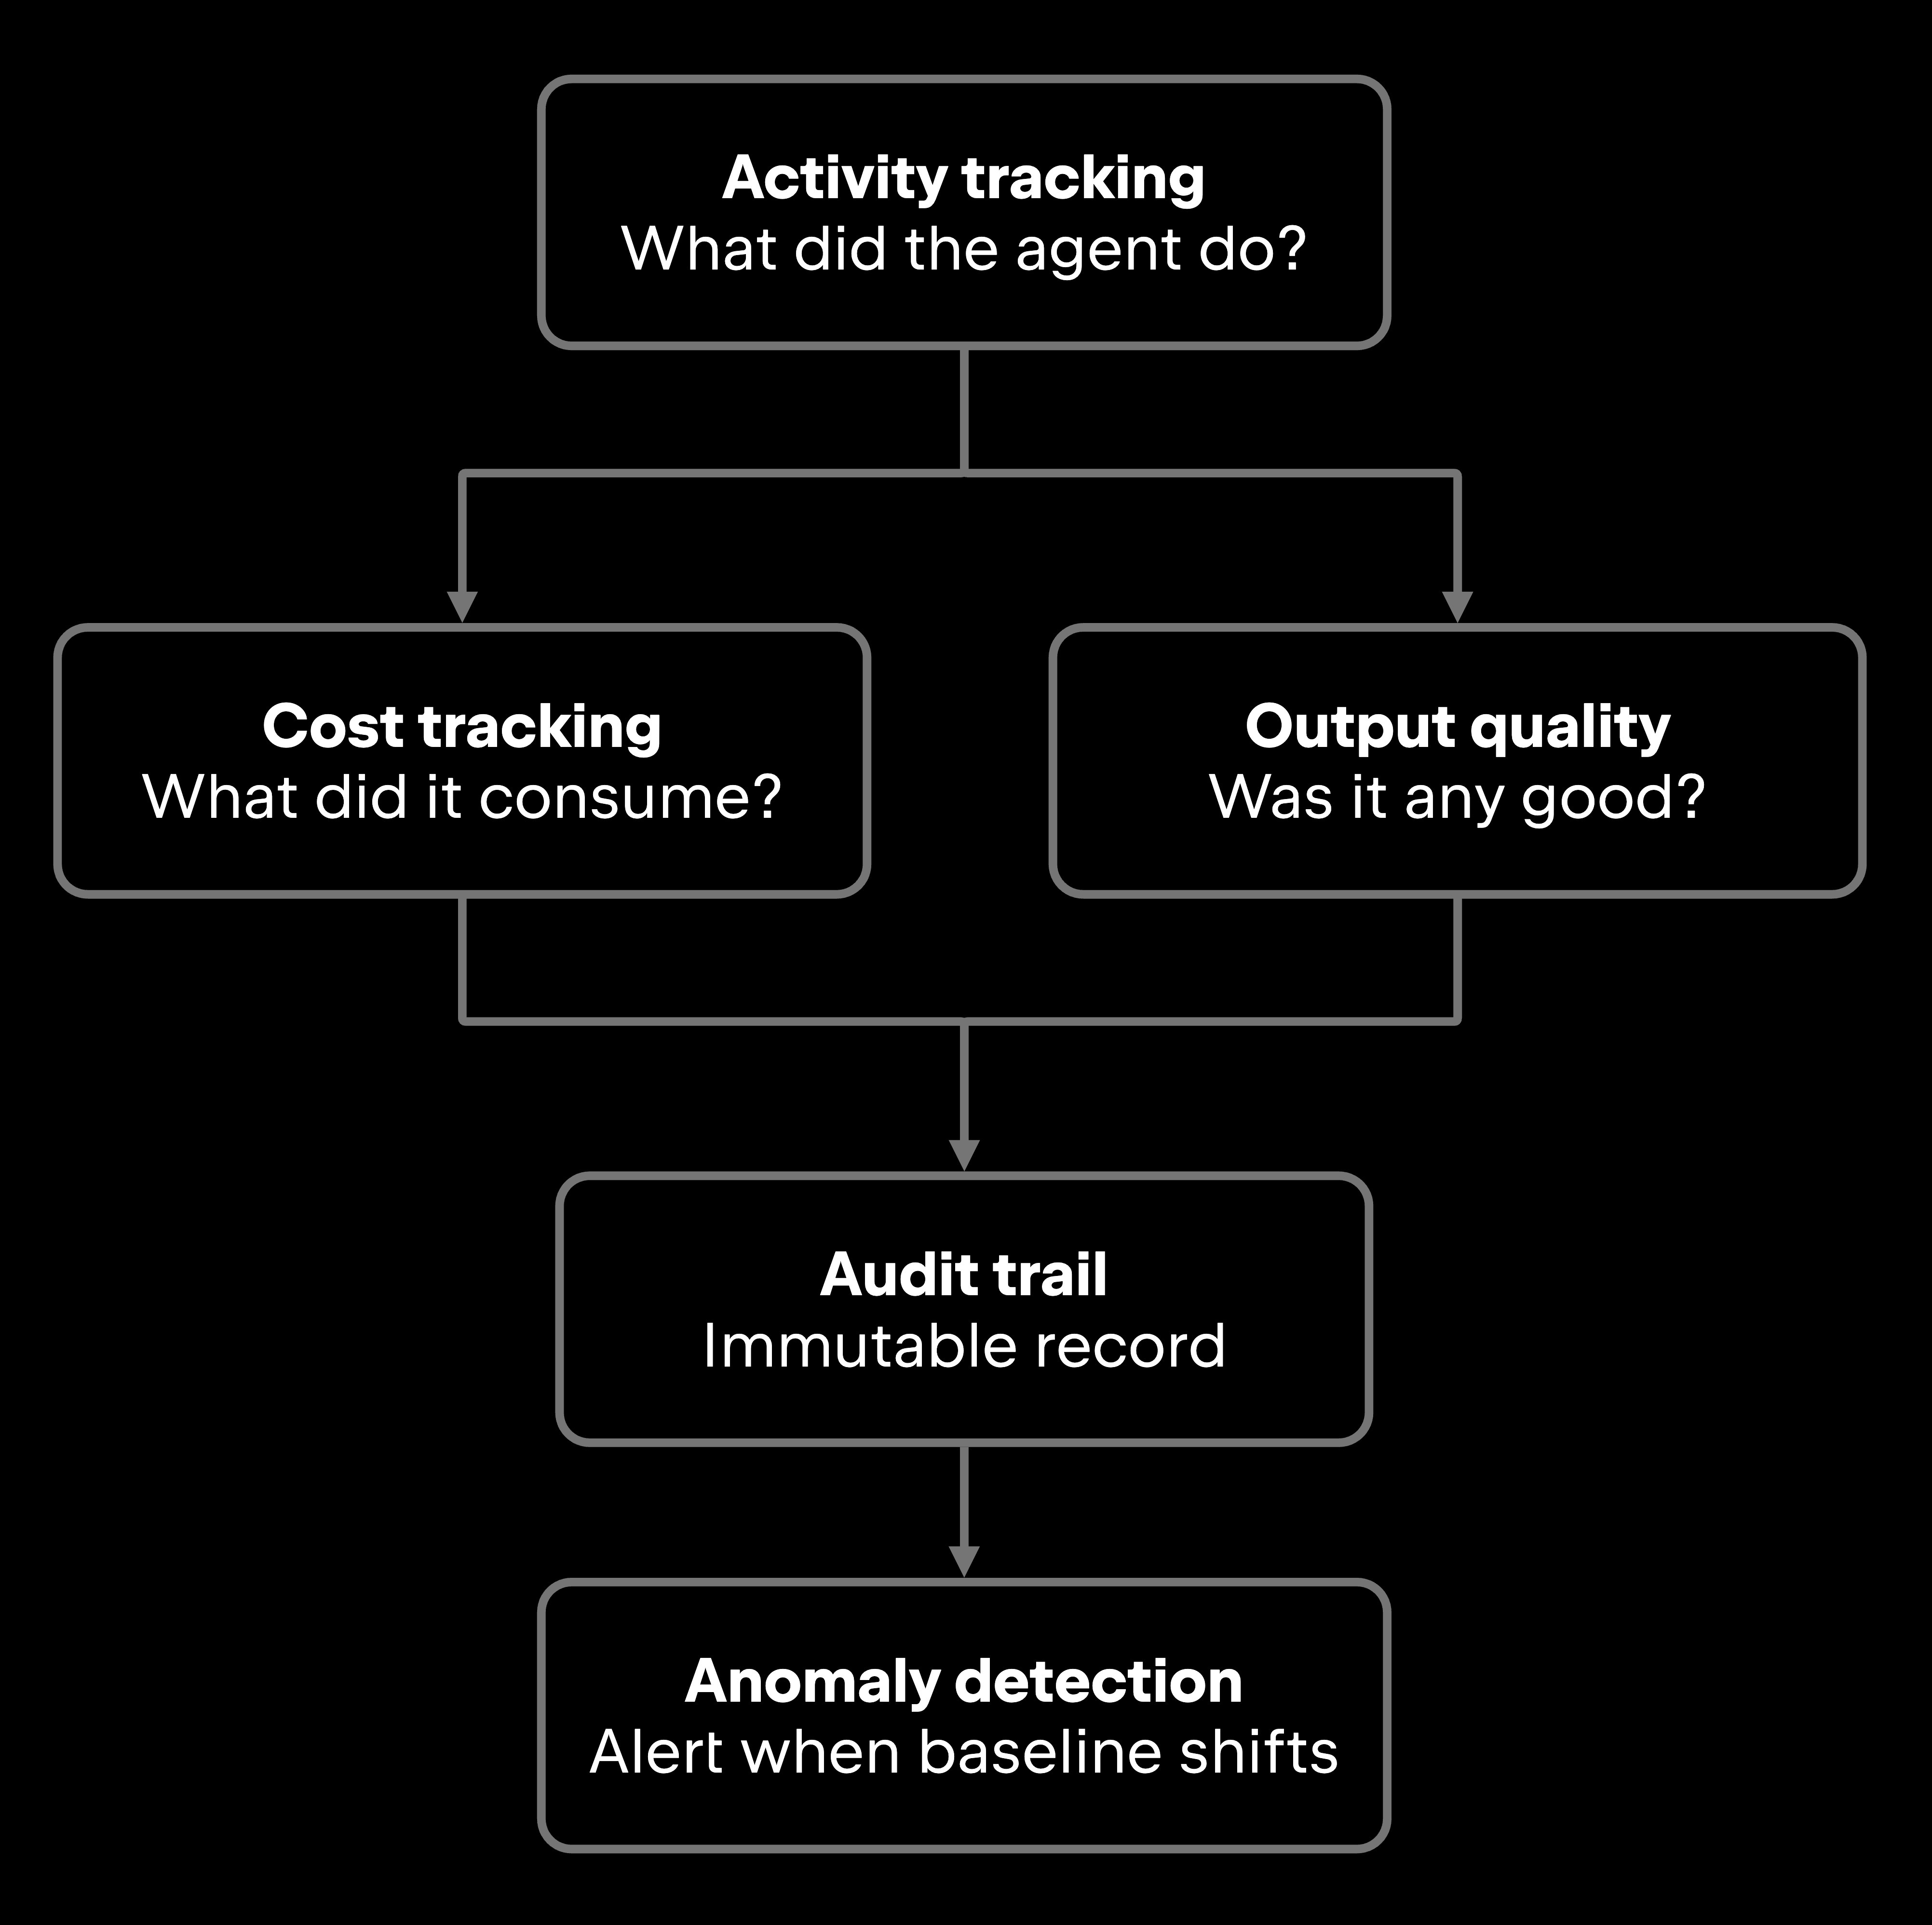
Activity and cost tracking both feed the audit trail. Output quality signals feed the audit trail alongside them. Anomaly detection sits on top of the full audit record to alert when baselines shift.

How to build an AI agent audit trail

An AI agent audit trail is an immutable, structured log of every action an agent took, giving you a record you can reconstruct, query, and present to stakeholders without piecing together context from scattered logs.

The following provides recommended data that an audit trail should capture:

  • Agent ID and version: Which specific agent handled the task.
  • Task and input: The prompt or task description sent to the agent.
  • Model used: Which LLM was called, and the version, if available.
  • Tool calls: Which external tools or APIs the agent invoked during execution.
  • Output: The full response or code the agent produced.
  • AI credit cost: Total tokens consumed, and the corresponding AI credit spend.
  • Latency: How long the task took from start to finish.
  • Human review outcome: Accepted, revised, or rejected, and by whom.
  • Errors and retries: Any failed attempts before the final output.

The practical challenge is capturing all of this without adding significant overhead to agent execution. Instrumenting at the framework level rather than inside each individual agent keeps that overhead low. Libraries like Tracy use OpenTelemetry to collect this data automatically across LLM calls and tool invocations. The audit trail becomes a natural byproduct of normal execution, not something you have to bolt on manually.

Store audit trail data in a queryable format. Flat log files work for debugging individual runs but break down when you need to answer the question: "How much did the code-review agent cost across all teams last month?", which is exactly what your engineering leadership will eventually ask.

How AI agent observability differs from application observability

Traditional application observability (the kind you'd implement with OpenTelemetry, Prometheus, or a distributed tracing stack) measures infrastructure health. It covers latency, error rates, CPU and memory consumption, and request throughput. These signals are deterministic. A request either succeeded or it didn't. A service either responded within the SLA, or it didn't.

AI agent observability adds behavioral and semantic quality signals that traditional tooling doesn't cover. An agent can execute successfully (no errors and no timeouts), and still produce an output that wastes a developer's time. Output acceptance rate, override rate, and task completion quality require instrumentation that understands what the agent was supposed to accomplish, not just whether it ran.

The other meaningful difference is cost attribution. Most teams don't need to track compute costs at the per-request level with traditional application observability. AI agent observability does, because AI credit consumption scales directly with agent usage and efficiency. Traditional monitoring will tell you the agent ran clean. It won't tell you that it just cost you three hours of review time.

How to implement AI agent observability

Implementation follows a consistent pattern regardless of the agent framework you're using.

Step 1. Instrument your agents. Start at the framework level. If you're building on the JVM, Koog includes out-of-the-box configurable observability tooling for monitoring agent execution. For Kotlin projects, Tracy uses OpenTelemetry to track LLM usage and tool calls with minimal code changes, and the output feeds into any OpenTelemetry-compatible backend. If you're using a different stack, the same principle applies, so instrument at the framework layer, not per-agent.

Step 2. Centralize the data. Agent traces, cost data, and output quality signals need to live in one place. Fragmented logs across individual developer machines or per-project databases make it impossible to answer organization-wide questions about agent behavior or spend.

Step 3. Set alerts. Define the baseline behavior for each agent class and alert when an agent deviates from it. A code-generation agent that usually consumes a predictable number of tokens per task and suddenly consumes three times that is worth investigating before the next billing cycle, not after.

Step 4. Review regularly. Treat agent performance reviews the same way you'd treat service reliability reviews. Weekly or bi-weekly reviews of acceptance rates, AI credit consumption, and error rates catch drift before it becomes a complaint in someone's inbox.

Step 5. Connect to governance. Observability data becomes useful when it feeds into policy decisions about which models are approved, which agent types are permitted to run unsupervised, and how AI credit budgets are allocated across teams.

JetBrains Central, part of JetBrains AI for Teams and Organizations, is where this data actually lives. It pulls AI analytics, observability, and cost management into a single console, surfacing adoption metrics, usage patterns, and cost attribution across teams and models. It also connects observability data to governance: approved models, enforced policies, and a single view of AI activity across IDEs and workflows for engineering leaders who'd otherwise have to piece this together from five different tools.

Platform teams don't have to live in that console either. The JetBrains Central CLI exposes the same data programmatically, so it plugs into your team's existing reporting pipeline.

Closing thoughts

AI agent observability is roughly where distributed tracing stood a decade ago. Engineering teams know they need it. Most just haven't made it standard practice yet. The teams that build it into their agent infrastructure now will have a real answer for what their agents are costing, whether those agents are actually delivering value, and where the failure points sit, well before those failures turn into incidents.

You don't need to start big. Start monitoring at the framework level. Centralize your traces. Establish baseline metrics for the agents that matter most to your team. From there, you can build toward full cost attribution, output quality tracking, and governance integration, maturing the practice the same way you would any other observability discipline.

FAQ

What is AI agent observability?

AI agent observability is the practice of continuously monitoring what your AI agents do, how much each task costs in AI credits, and whether their outputs meet the quality bar your team requires. It covers activity tracking (which agents ran, what they did), cost attribution (token and credit consumption by agent, team, and task type), output quality signals (acceptance and revision rates), and audit trails (an immutable record of every agent action). The goal is the same as any other form of engineering observability, giving you the data you need to debug problems, detect drift, and make confident decisions about systems you didn't write yourself.

How do engineering teams monitor what AI agents are doing?

Engineering teams monitor AI agents by instrumenting at the framework level to collect structured traces of agent activity, including task ID, model called, tools invoked, tokens consumed, and output produced. Those traces feed into a centralized analytics layer where teams can track usage patterns, flag anomalies, and attribute AI credit spend to specific teams or workflows. Teams running JetBrains AI for Teams and Organizations can use JetBrains Central's analytics capabilities to monitor AI adoption, usage, and cost across the organization from a single interface.

What metrics matter most for AI agent observability?

The five metrics that give the clearest picture of agent performance are task completion rate (how often the agent finishes without an error or timeout), acceptance rate (what percentage of outputs went through without meaningful revision), cost per task in AI credits (average and distribution), error rate and retry count, and override rate (how often a human discarded the output entirely). Latency matters too, but it's usually a secondary concern unless agents are blocking developer workflows in real time. Acceptance rate and override rate are the hardest to collect but the most informative because they tell you whether the agents are useful, not just whether they're running.

When should engineering teams start implementing AI agent observability?

The right time to implement observability is before agents are running in production at any meaningful scale. Retrofitting instrumentation after the fact means you've already accumulated unattributed costs, undetected quality drift, and gaps in your audit record. Starting at the framework level during initial deployment keeps overhead low and ensures every agent run produces a trace from day one.

What should an AI agent audit trail record?

An audit trail entry should record, at minimum, the agent ID and version, the task or input prompt, the model used, every tool call made during execution, the full output produced, the AI credit cost, task latency, the human review outcome (accepted, revised, or rejected), and any errors or retries. These fields give you enough to reconstruct what happened in any given agent run, attribute costs accurately, and demonstrate to auditors that AI activity is logged and governed.

How is AI agent observability different from traditional application monitoring?

Traditional application monitoring tracks infrastructure health, things like latency, error rates, memory, and throughput, in a deterministic environment where correct behavior has a clear definition. AI agent observability adds signals that traditional tooling doesn't cover, like whether the output actually helped the developer or whether they ended up rewriting it from scratch. It also adds per-task cost attribution, since AI credit consumption scales directly with agent usage. An agent can execute without a single error and still quietly drain your engineering team's time, and traditional monitoring simply won't catch that.

Why is an audit trail required for AI agent governance?

Security teams need a verifiable record of what AI agents did, when they did it, and who reviewed the output. An audit trail provides that record in a queryable, immutable format, making it possible to demonstrate governance without reconstructing context from scattered logs. Without one, you can't answer compliance questions about AI use in code generation or decision support, and you can't attribute costs or quality issues to specific agents or workflows.

JetBrains AI Solutions

Optimize your workflow. With AI built for you.

Junie

The AI coding agent with deep IDE integration that plans before it writes, then codes and tests while you stay in flow.

JetBrains AI in IDEs

Set of AI-powered capabilities built into JetBrains IDEs for software developers. It is not a standalone product or service, but an IDE-native experience composed of AI features, LLMs, agents, and integrations.

Air

Agentic Development Environment for engineering teams building products with AI.

AI for Teams and Organizations

An open system for agentic software development. Govern AI access across your engineering org, manage agents and models, and keep costs under control.

JetBrains Context

A repository intelligence layer for coding agents. It builds a semantic index of your codebase so agents retrieve what they need instead of exploring it file by file.

Central CLI

One CLI for every terminal agent. Claude Code, Codex, Gemini, and others plug into JetBrains AI and behave exactly as they do standalone. Access is granted centrally and instantly, with models, limits, and usage analytics governed in one place.