Qodana / Static Code Analysis Guide / What Is Code Coverage?
Code coverage is a metric that shows how much of your source code is executed when your tests run and is one of Qodana’s top 6 metrics to empower your team. It helps developers understand which parts of an application are well tested, which areas are risky, and where additional tests are needed.
JetBrains tools including IntelliJ IDEA, Kotlin Multiplatform, and Qodana provide built-in coverage engines that help teams measure, visualize, and improve test coverage throughout the development workflow.
Code coverage gives teams visibility into the relationship between their tests and the real behaviour of their systems.
When used correctly, it helps you uncover untested logic paths, avoid regressions by ensuring tests exercise critical code, reduce the chance of shipping unintended behaviour, prioritize risky areas of large and complex codebases and make test quality measurable - not just test quantity
A common misconception is that code coverage guarantees quality. It does not. Instead, it shows you where your tests aren’t looking yet.
When you run test suites with coverage enabled, the coverage engine instruments your code and tracks which lines, branches, or instructions were executed during the test run.
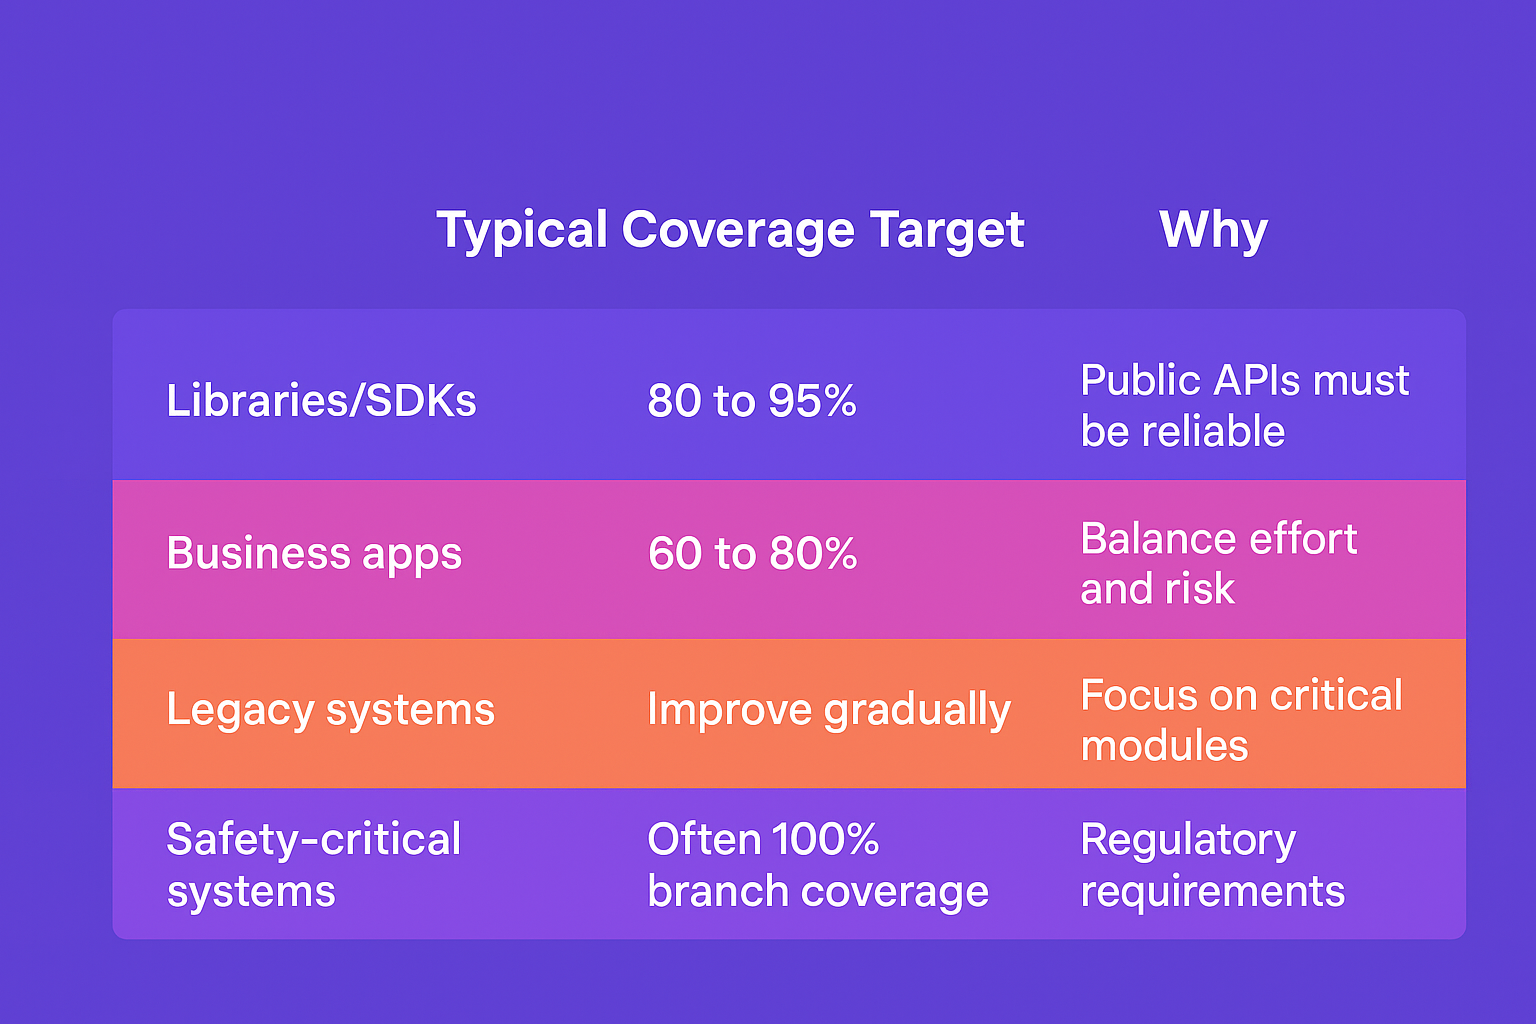
The basic workflow looks like this:
JetBrains IDEs show this directly in the gutter, while Qodana produces coverage insights centrally as part of CI.
Although “line coverage” is the most popular metric, JetBrains products support several levels of detail:
Shows which lines of code were executed during tests.
Useful for a quick overview of how thoroughly code is exercised.
Shows whether both outcomes of conditional statements were tested.
This is important in languages like Java and Kotlin where complex logic often hides in conditions.
Looks at low-level bytecode execution.
JetBrains coverage engines use this for extremely precise reporting.
Indicates whether a method was entered at all during a test run.
This helps when you want to ensure API-level usage coverage.
Code coverage percentage = (the number of lines of code tested by the algorithm / the total number of lines of code in a system component) * 100
However, there are two other strategies:
1) Measuring by statement
2) Measuring by branch, which is better connected to the cyclomatic complexity metric, as the complexity shows how many tests you need to implement to cover the code.
IntelliJ IDEA and other JetBrains IDEs provide live visual feedback:
This immediate feedback helps developers adjust their tests while writing them.
Qodana integrates code coverage into continuous inspection:
Coverage becomes part of the wider quality picture, not an isolated number.
You can also view code coverage in the Insights Dashboard which shows codebase health indicators projects.
The right coverage target depends on your project’s goals and risk profile. Software developers seem to disagree widely about measurement value but we can provide some practical guidance:

The most reliable rule:
Aim for meaningful tests, not inflated numbers.
Qodana enhances coverage by connecting it with static analysis:
This gives teams a smarter way to prioritise testing work and reduce technical debt.

Code coverage is a lens that helps developers understand their codebase, build safer systems, and confidently deliver changes at scale.
By combining JetBrains IDE coverage tools with Qodana’s continuous analysis, teams get:
If you want test coverage to become an actionable part of your development workflow rather than an afterthought, Qodana brings it all together.