Evaluate Expression During Debugging
Select your code and execute it, in the right context.
Debugging means poking around, usually at a point in the execution. You set a breakpoint, fire up the debugger, and start pokin'.
Sometimes "poking" means "typing in expressions and seeing the result values." This is where Evaluate Expression helps. It is a popup window where you can type in values and see the results, in the scope of the stopped line: all the values in that block, passed in, etc.
There are several ways to get to the popup:
-
Click the debug toolbar button to launch it
-
Invoke the Evaluate Expression action ⌥⌘F8 (macOS) / Ctrl+Alt+F8 (Windows/Linux).
-
Right-click in the editor and choose Evalute Expression
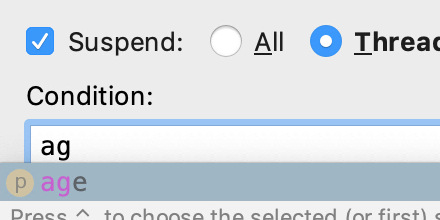
Note that, if you have a selection in the editor, that selection is filled into the Evaluate Expression input box. This is a very handy way to stop on a line, then execute part of that line, without retyping or even cut-and-paste. This also means Evaluate Expression can be driven with the keyboard instead of the mouse.
As you are typing in the Evaluate Expression input box, autocomplete and other features are available. Also, previous expressions you've typed are available as autocomplete and in the dropdown.
If you type something in that causes a new variable to be defined in that scope, or changes an existing variable, the Variables pane will reflect it. Meaning, you are indeed changing the scope.
One last point: if you move around in the stack frames (left panel), Evaluate Expression will be driven by different scope. Thus if you want to "poke around" inside some code that called the line at the breakpoint, it's easy.