What’s New in PyCharm 2024.1.4
View and navigate URLs directly from the editor tab,
get context-based model suggestions for Hugging Face,
and enjoy smart code assistance for TypedDict
Gutter actions and inlay hints for URLs PyCharm Professional
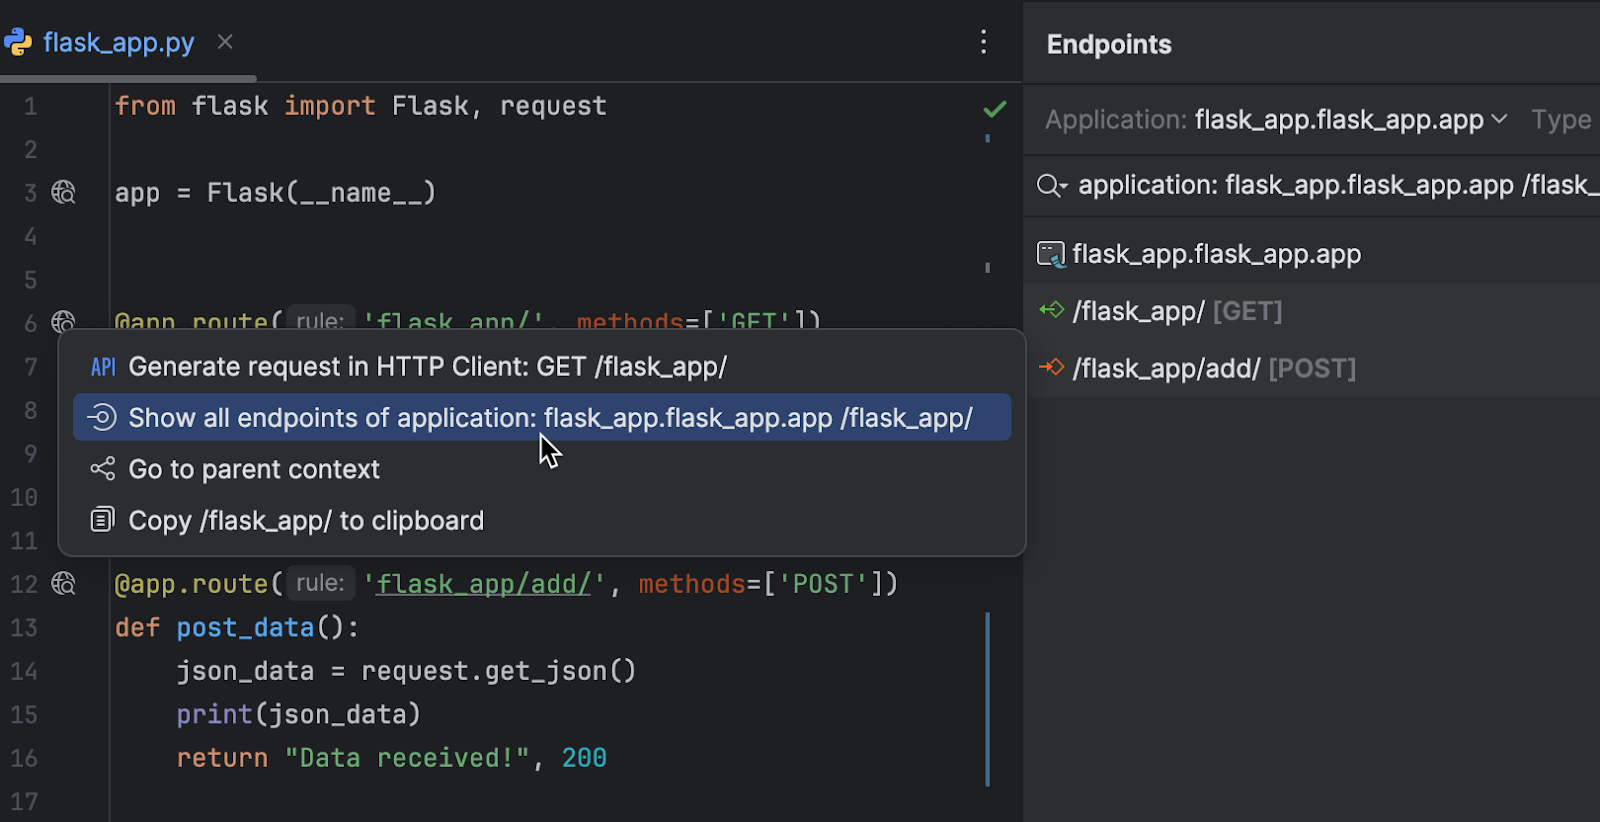
New gutter icons provide an easy way to manage URLs in Flask, FastAPI, and Django projects. In just a few clicks you can test an endpoint by running the request in the HTTP Client, view all lower-level endpoints, navigate one level up, or copy the URL to the clipboard.
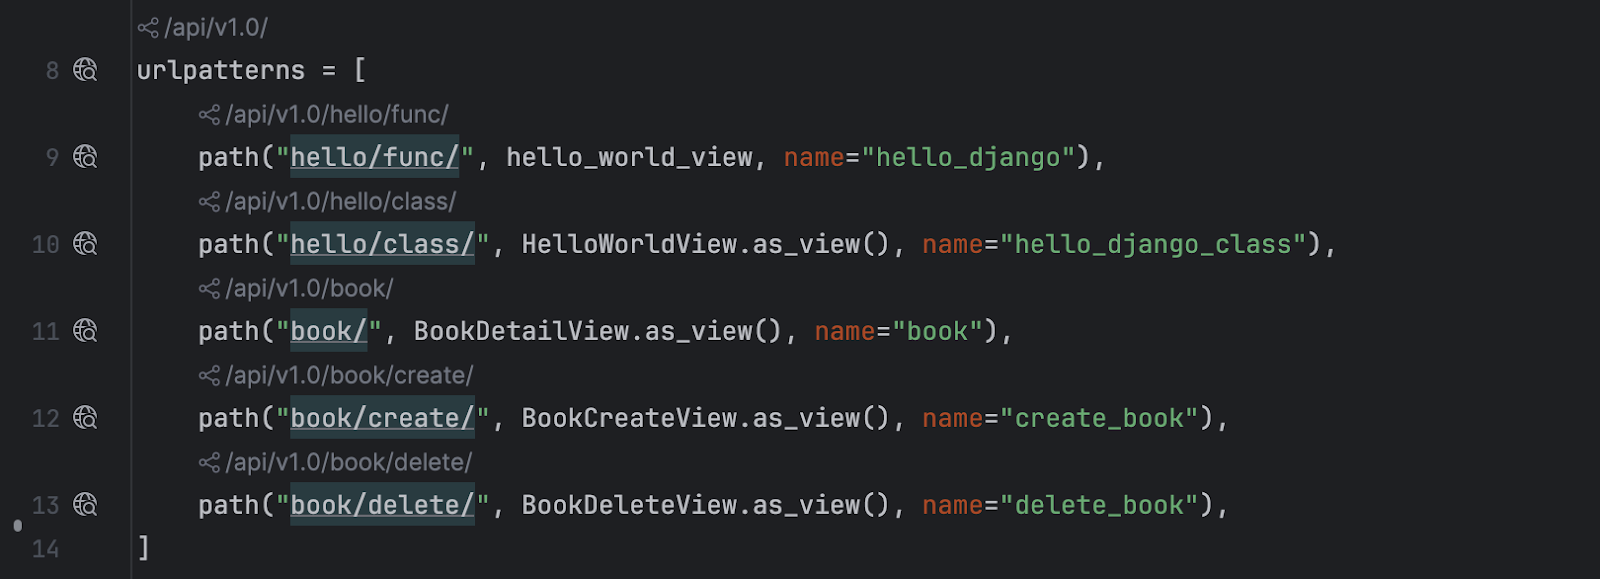
New inlay hints with endpoint URLs further contribute to code readability for Python web frameworks. Clicking on such a hint will navigate you to the parent route or open a dropdown if there are several. Hold ⌘, ⌥, Ctrl, or Alt to copy the URL to the clipboard.
PEP 692: Smart code assistance for TypedDict
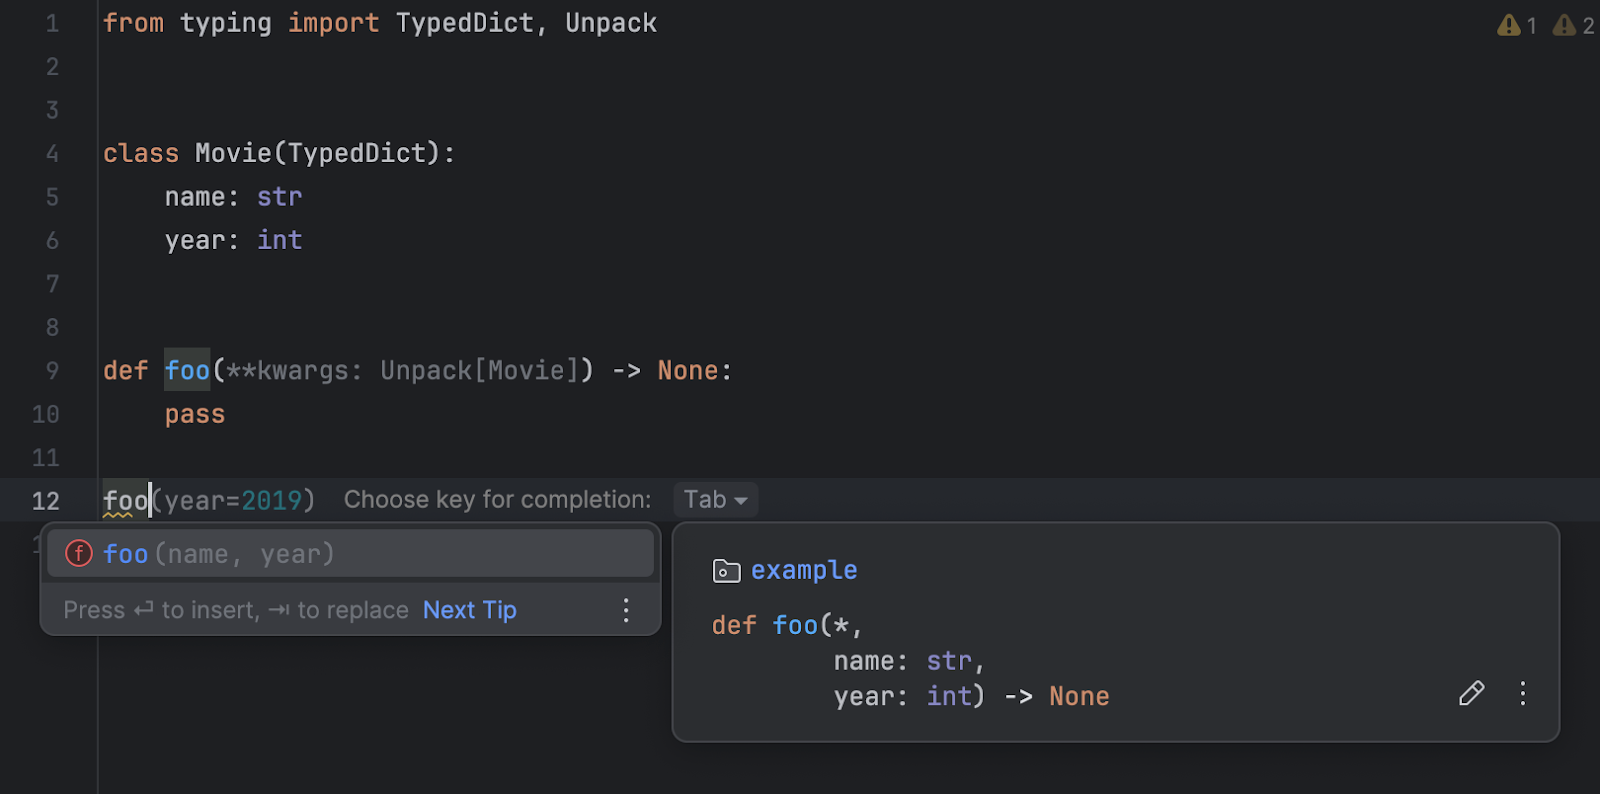
We’ve added support for
PEP 692. Keyword arguments
defined as TypedDict are now available when
you invoke parameter info (Ctrl + P),
as well as in code completion and in the quick documentation
popup (Ctrl + Q). Now you
have access to yet another tool that lets you use the
latest type hinting capabilities in Python to develop
an easy-to-understand codebase.
Warnings about missing packages in requirements.txt
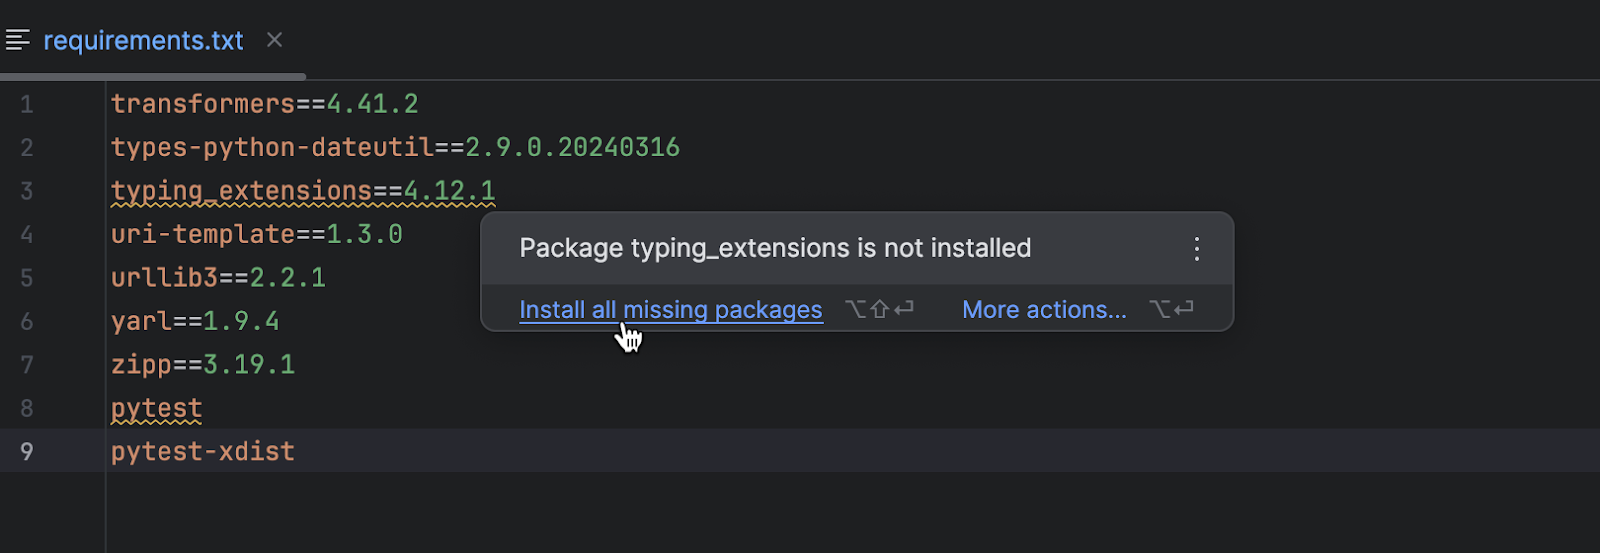
PyCharm now underlines packages that are listed in
requirements.txt but that are not installed on
the current Python interpreter with a yellow squiggly line.
Hover over the package name and click Install all missing packages
to immediately set up your development environment.