Tutorial: Debug in IRB/Rails console
After you have run the IRB or Rails console, RubyMine creates a temporary run/debug configuration. This configuration allows you to rerun the console or launch it in the debug mode. In this tutorial, we'll show you how to load and debug specific parts of code in the IRB console.
A sample Ruby application used in this tutorial has two files: script.rb and song.rb. We'll debug the to_s method called for the newly created Song object. Use the code snippets below to create the files for the procedure.
Perform the following steps to debug this program code in the IRB console.
Debug in IRB/Rails console
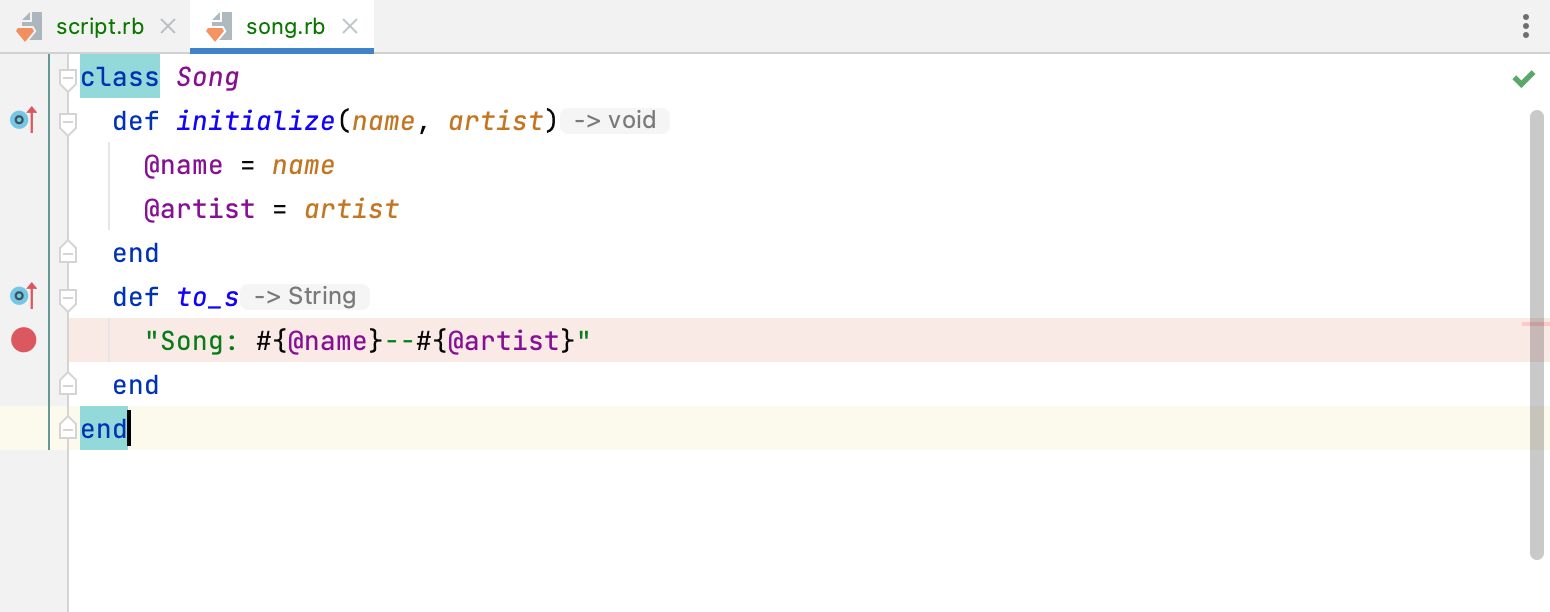
Open the song.rb file and set a breakpoint within the to_s method as follows.

Run the IRB console configuration in the debug mode. To do this, select this configuration on the main toolbar and click the
button.

In the opened song.rb file, place the caret at any line and select from the main menu. This will load code from the file to the IRB console.
Open the script.rb file and select the to_s method call as follows.

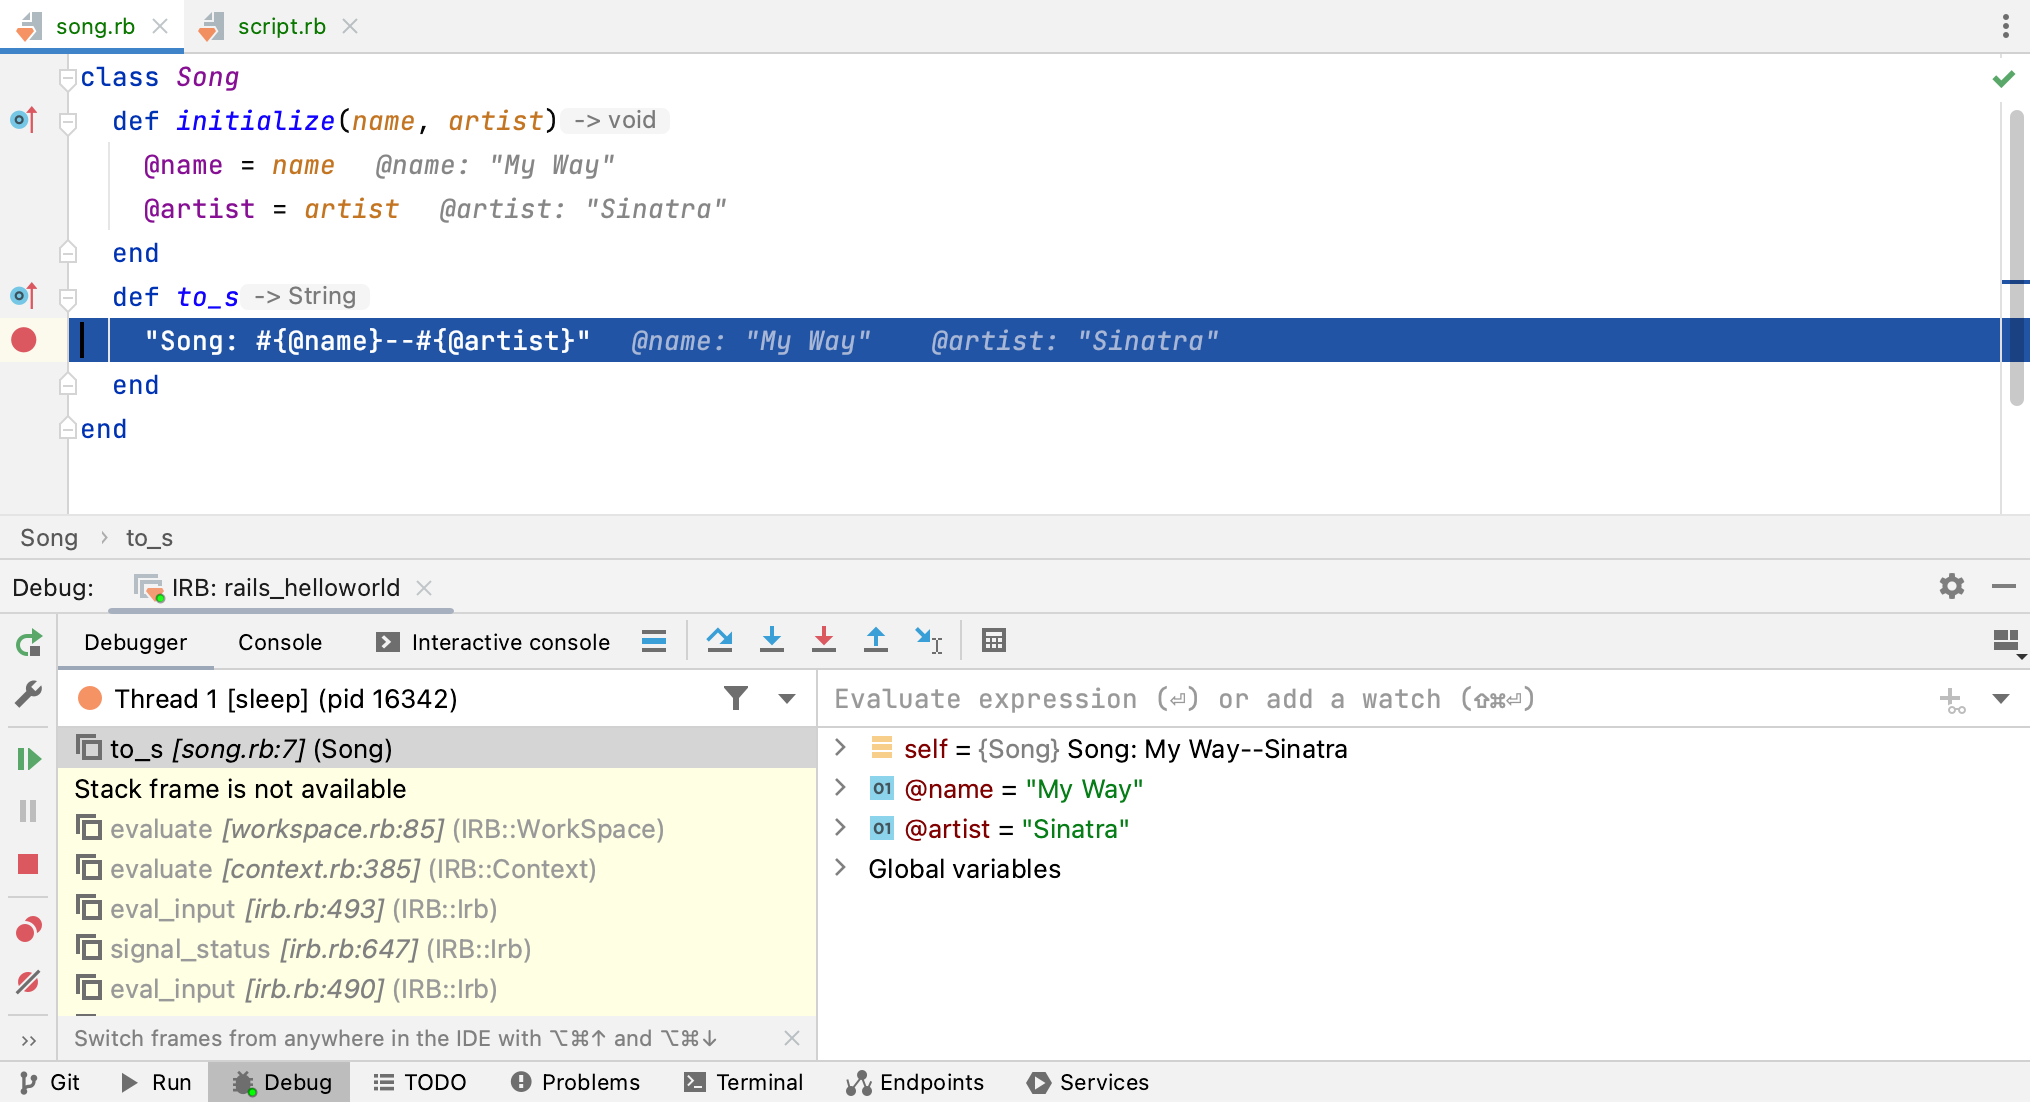
Then, select from the main menu. RubyMine loads this selection to the IRB console and stops program execution at the breakpoint.

In the invoked Debug tool window, you can investigate the application state: frames, variable values, and so on. Learn more at Examine suspended program.