Data-driven Project Analytics
Your VCS is a source of valuable data showing how your project evolves over time. Upsource keeps track of all commits, revisions and personal contributions in your project. It continuously analyzes these data and is capable of highlighting areas in need of refactoring or process adjustment.
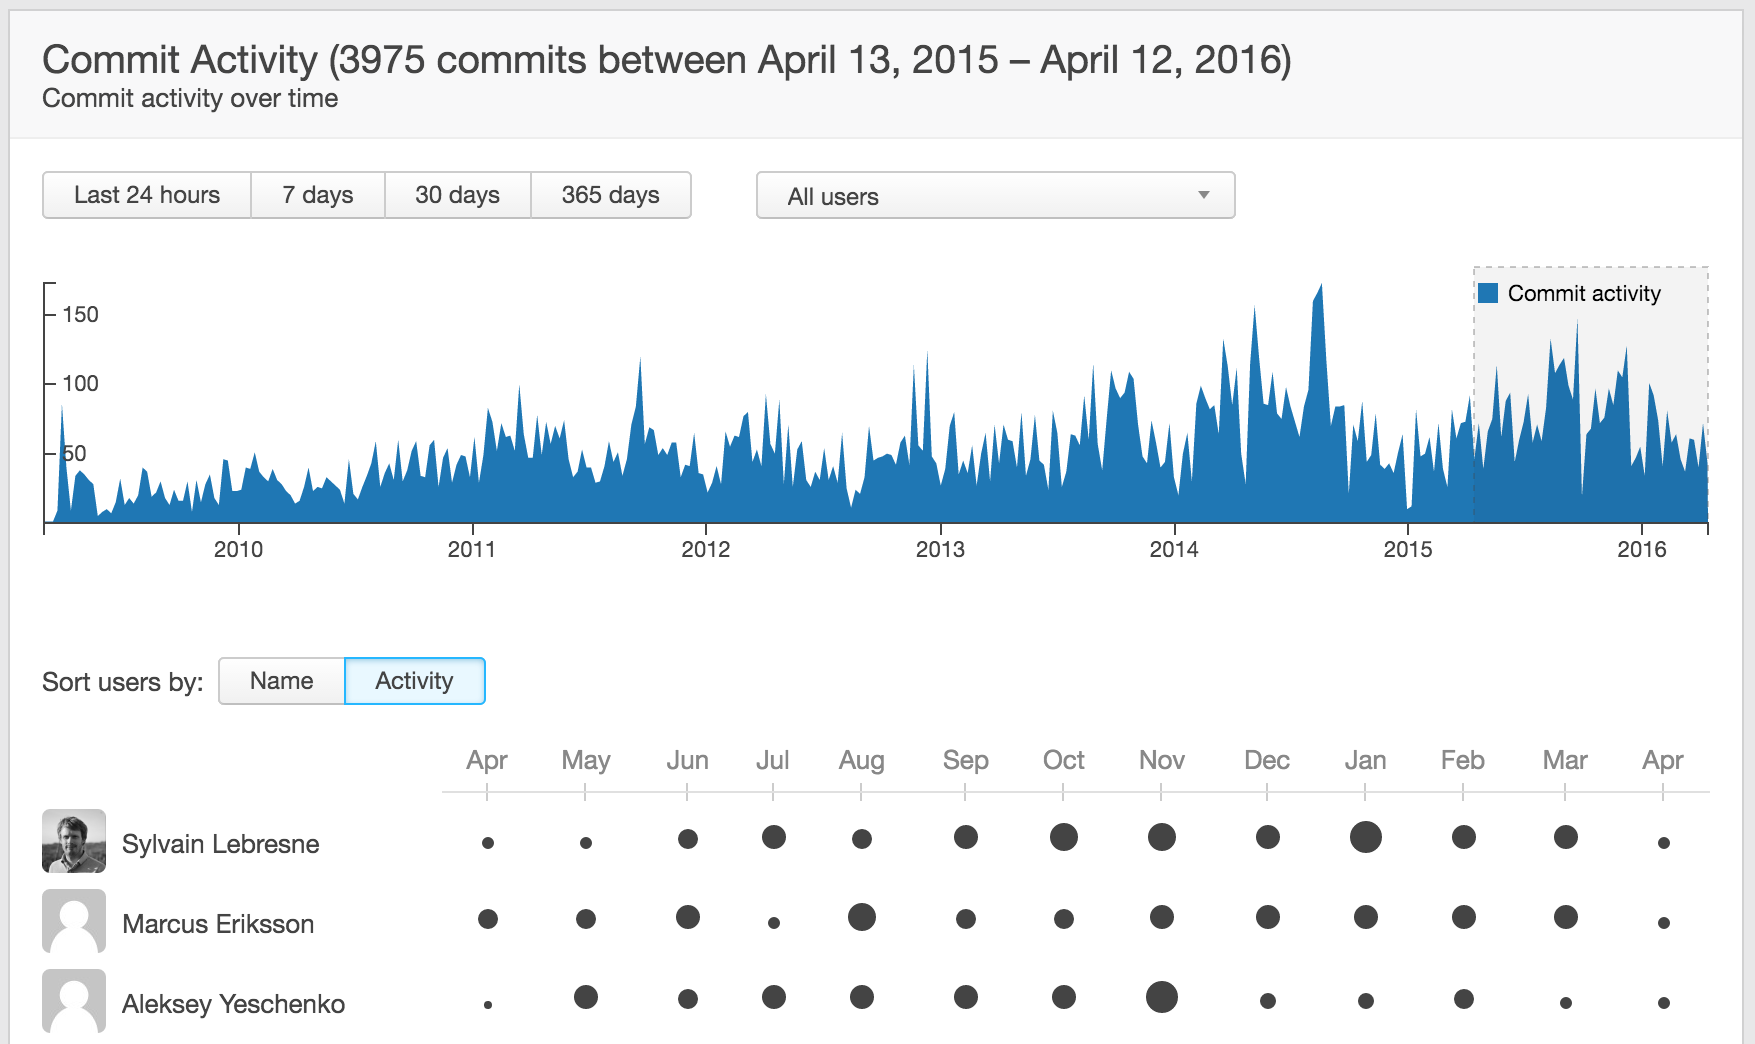
Commit Activity
See how the development pace in the project has been changing over time. You can explore any particular period, see individual activity, and even review the contribution distribution across project modules. If you're new to the project, use this chart to quickly discover the responsibility scopes of your teammates.
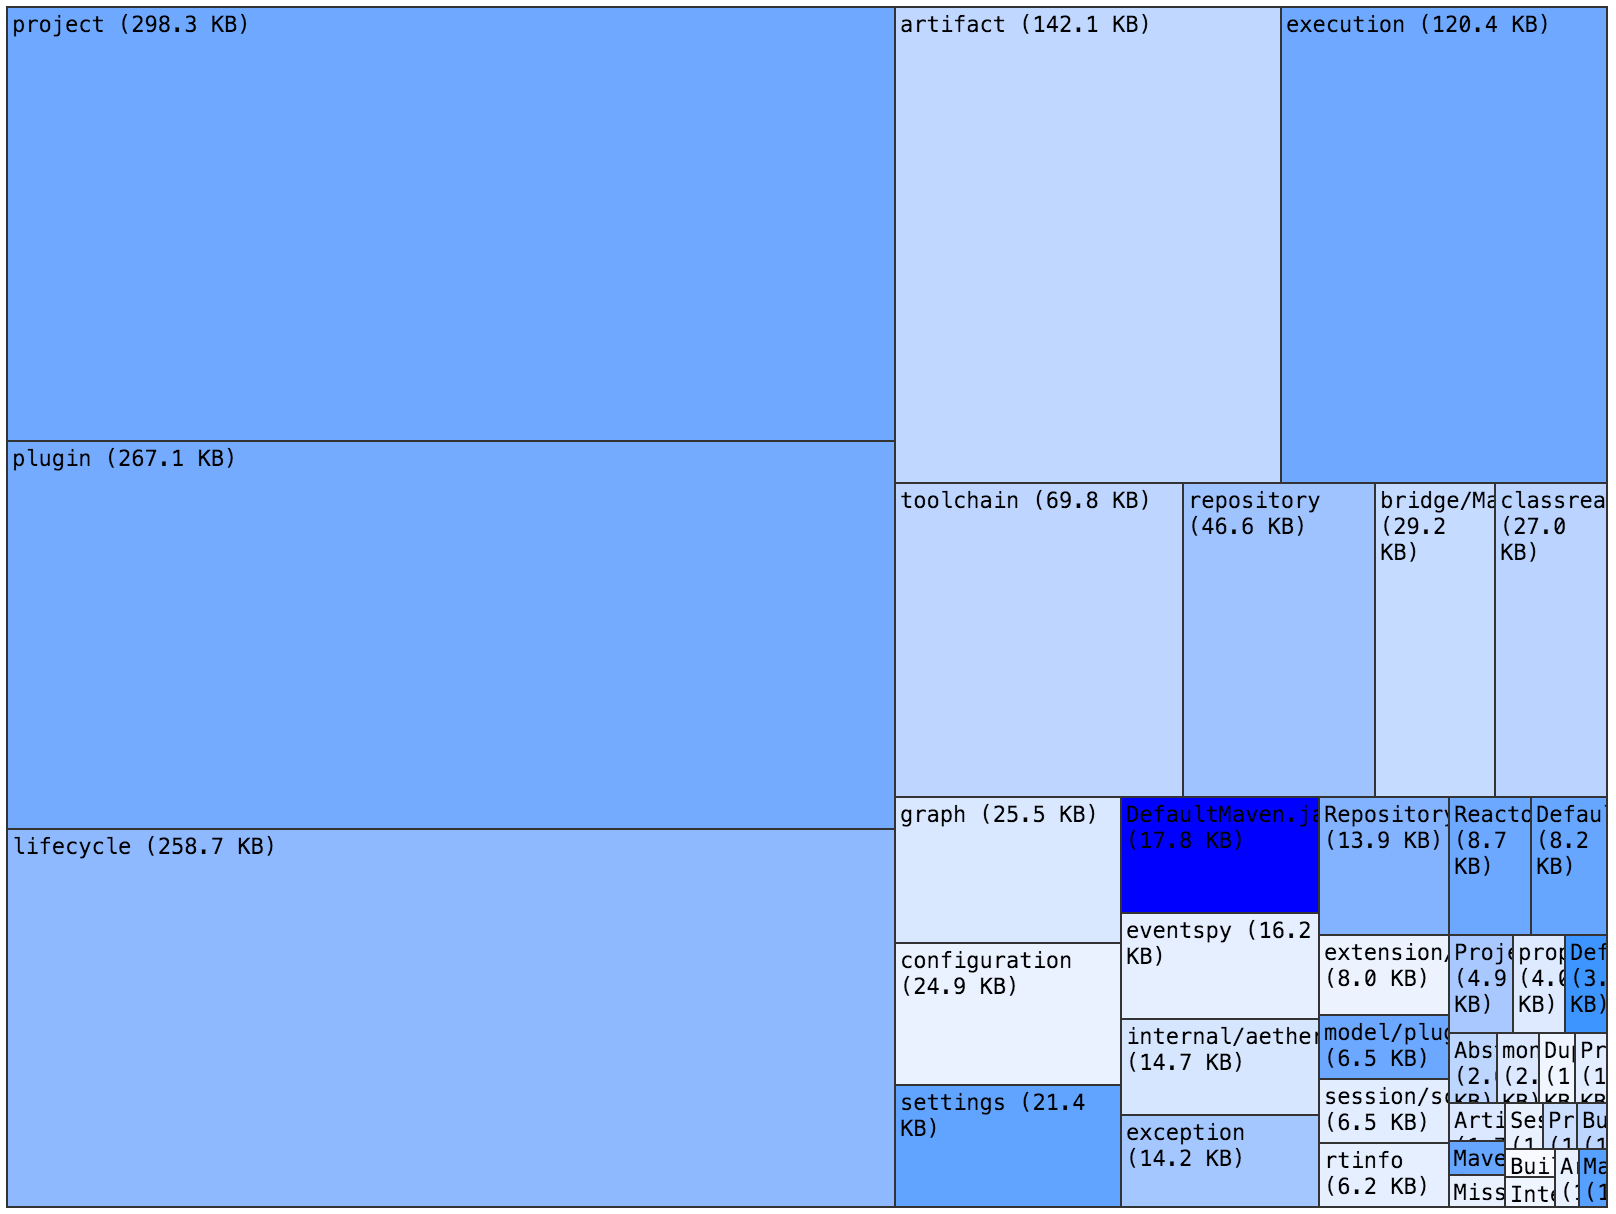
Project Treemap
Get a bird’s-eye view of the project structure and pinpoint files and directories with unusual maintenance patterns, e.g. hotspots. Project Treemap helps teams detect candidates for refactoring and better plan their QA efforts.
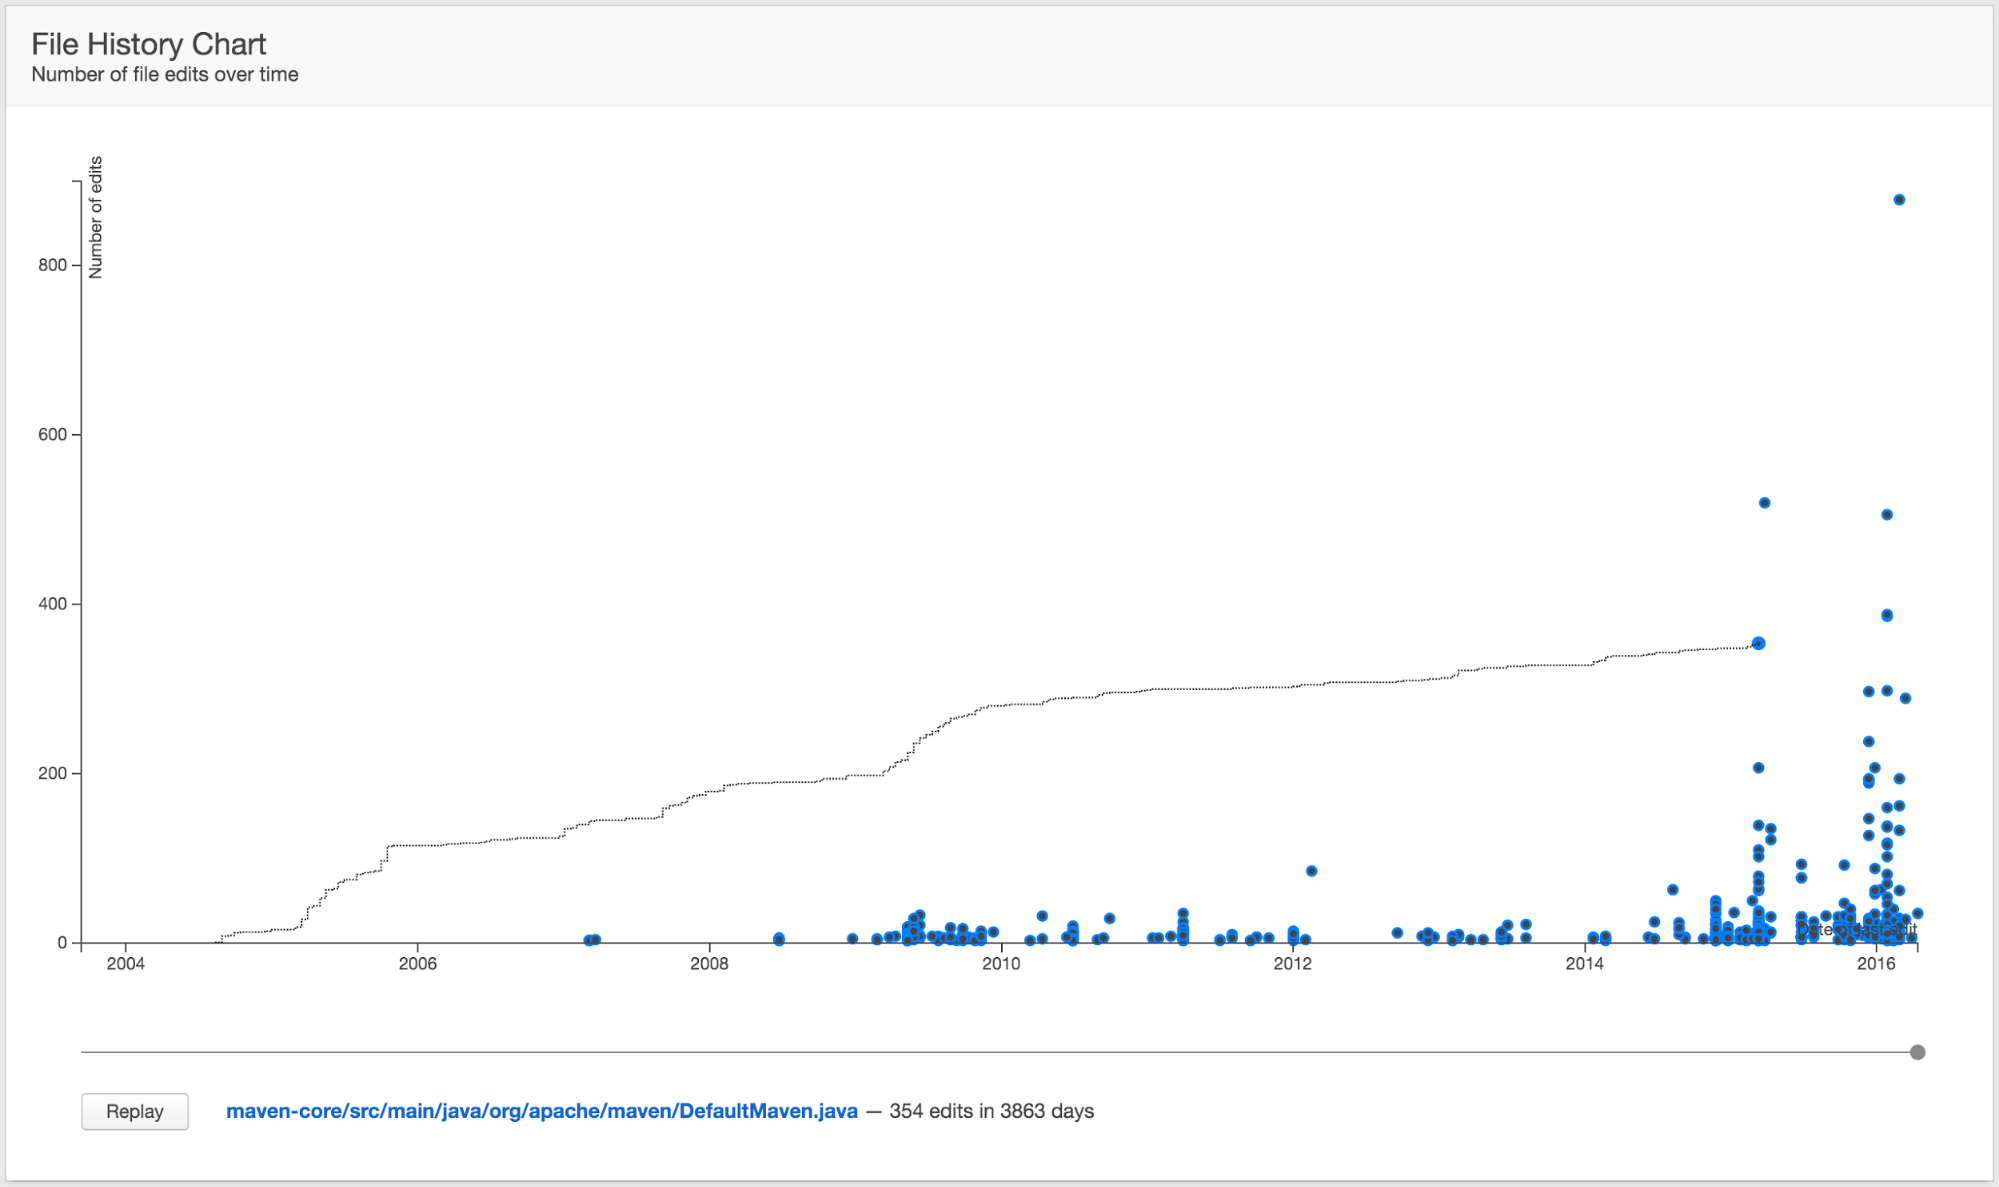
File History
Easily identify abandoned files – files that experienced enough edits to be among the most edited, but have not been edited for a long time. These are represented by the points lying closer to the middle of the chart than most.
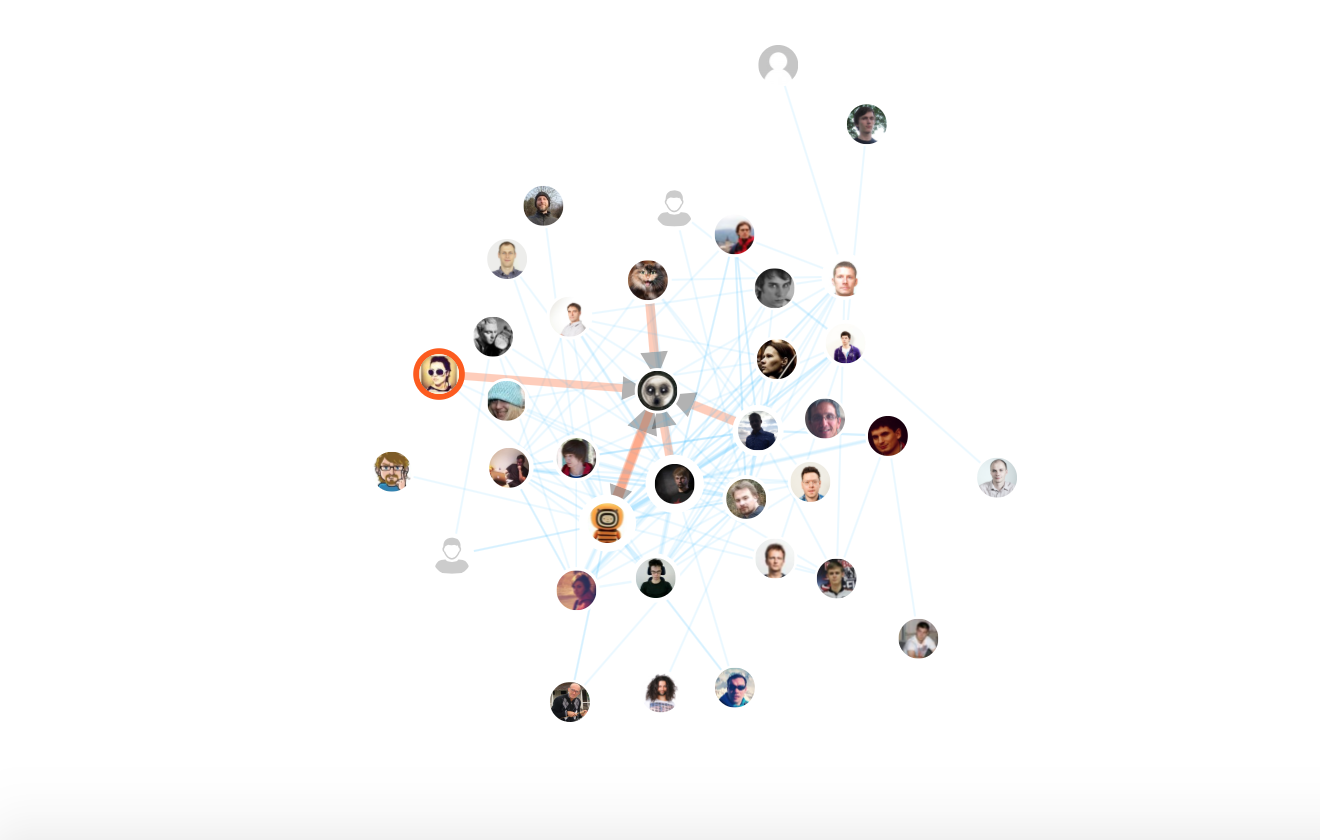
Reviewers
See interactions in your project and code review relationships that have been built. Each node represents a project contributor. The more two people review each other's changes, the stronger the link between them becomes. The graph is interactive – try dragging the nodes or clicking on them.
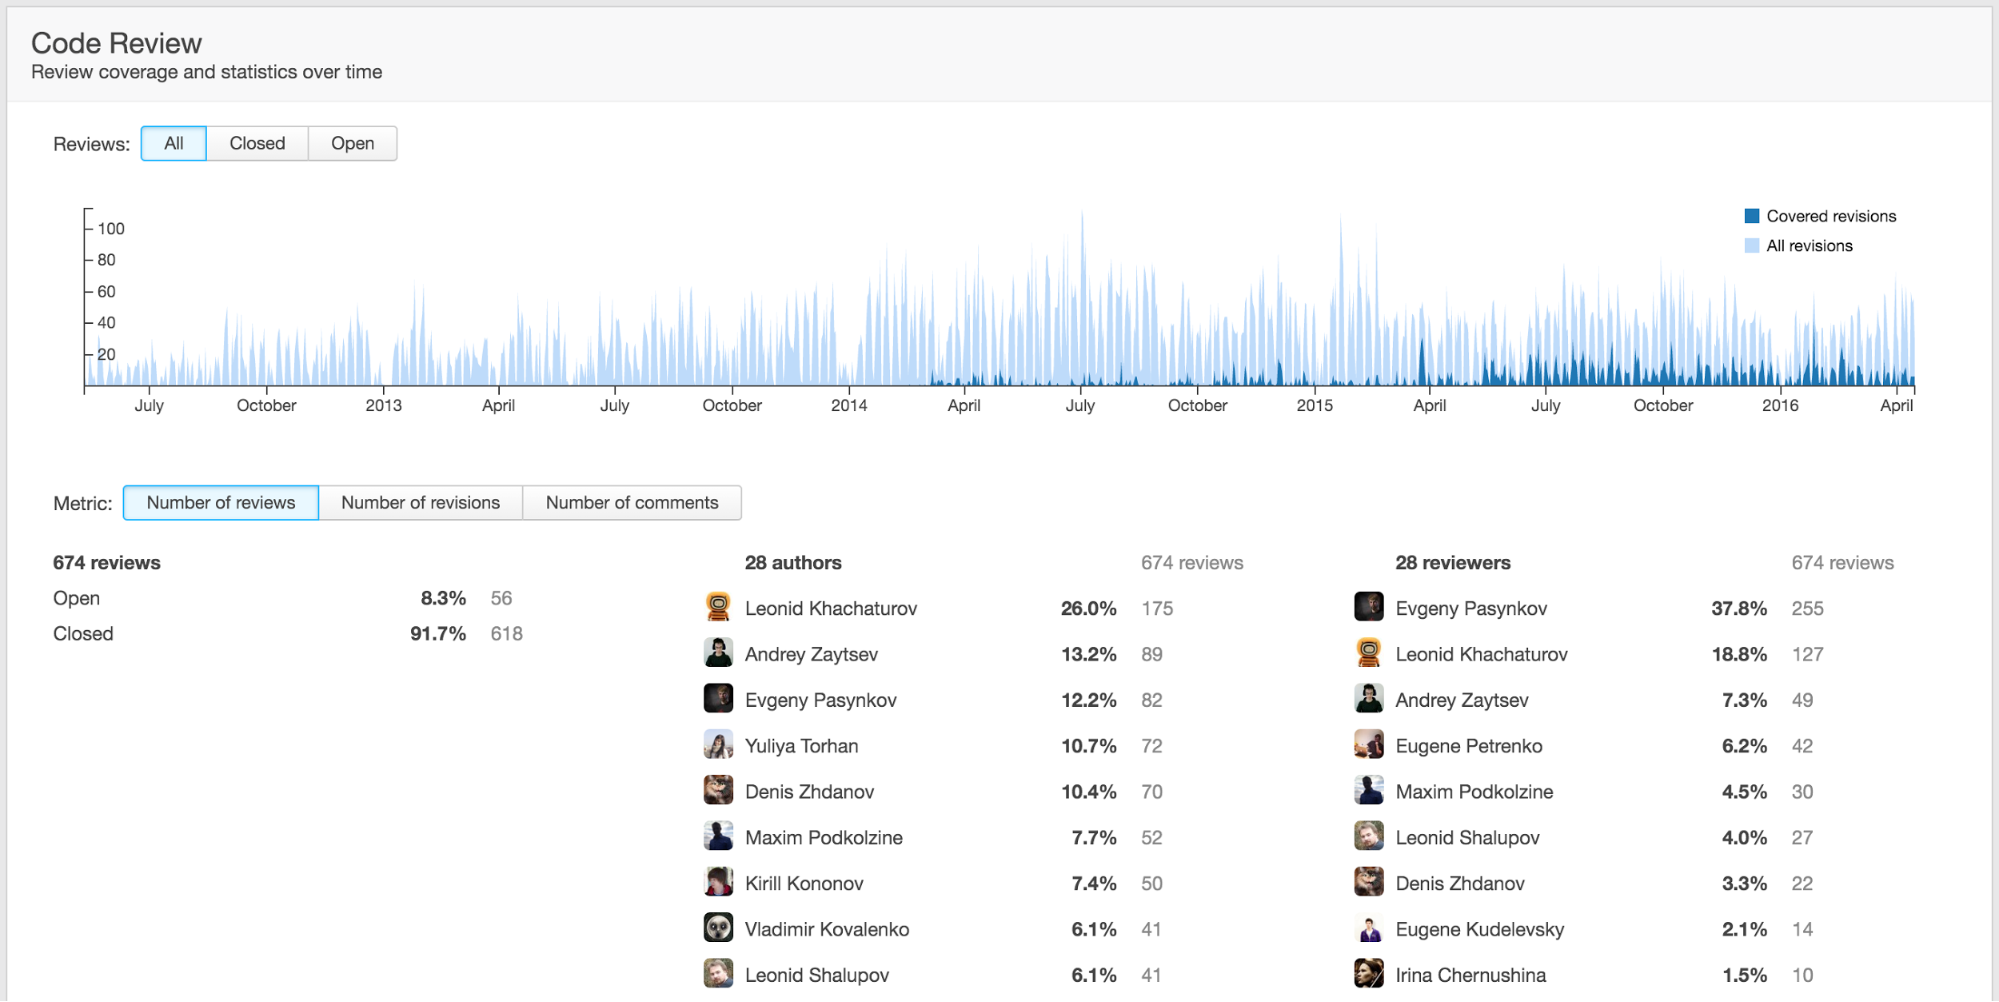
Code Review
Discover how well your project is covered with code reviews, and to what degree each user is involved in the review process. After consulting these statistics, you will understand who is mostly reviewing the code and whose changes get reviewed the most, and may even want to tune your code review process.