New UI
The new user interface (UI) is a redesigned look of WebStorm and other JetBrains IDEs. It has been created to simplify the design and make essential features more accessible – resulting in a cleaner and more modern look and feel.
In this article, you’ll learn about the key changes in the new UI and how to get started with it.


The new UI is still in active development. Should you have any questions or feedback, please share them as described below.
How to enable the new UI
Go to , select the Enable new UI checkbox, and restart the IDE.

Key changes
Themes
We’ve introduced three new themes in this UI – Light, Dark, and Light with Light Header. All of them have been designed to provide improved contrast and a consistent color palette.


You can switch to another theme in . Please note that not all custom themes are fully supported yet.
Fonts
The Inter font is now used for the UI elements. Previously, the default OS fonts from each platform were used, and they were rendered differently.
If you would like to change the UI font, go to , select the Use custom font checkbox, and choose your preferred font.
Icons and compact mode
Our new icon set features distinct shapes and colors to enhance legibility. If you work on a smaller screen, you can enable Compact Mode from in the main menu. This will reduce the heights of toolbars and tool window headers, scale down the spacings and paddings, and provide smaller icons and buttons.

Main window header
We’ve simplified the main window header. It provides access to essential actions through icons and widgets. The main window header is also customizable, allowing you to add more actions to the toolbar such as Git push. To do this, right-click an icon or a widget, select Customize Toolbar from its context menu, and then add the preferred actions in the Customize Main Toolbar dialog that opens.

1. Main menu (Windows and Linux only)
The main menu is located under the hamburger icon. To open it, press Alt+\.
You can return the standard menu bar. To do that, go to and enable the Show main menu in separate toolbar option.
2: Project widget
The project widget shows the current project's name and lets you switch between recent projects, create new projects, and open the existing ones.
3: VCS widget
The VCS widget shows the current branch, allows switching branches, and provides access to essential VCS actions like update, commit, and push changes.
It replaces the old branch widget previously located in the status bar at the bottom of the main window, and the VCS actions icons previously located in the navigation bar in the upper right corner.
4: Run widget
This widget allows you to run and debug your application using a run/debug configuration. You can select the configuration you want to run, change the mode for it (run or debug) as well as edit, pin, or delete configurations.

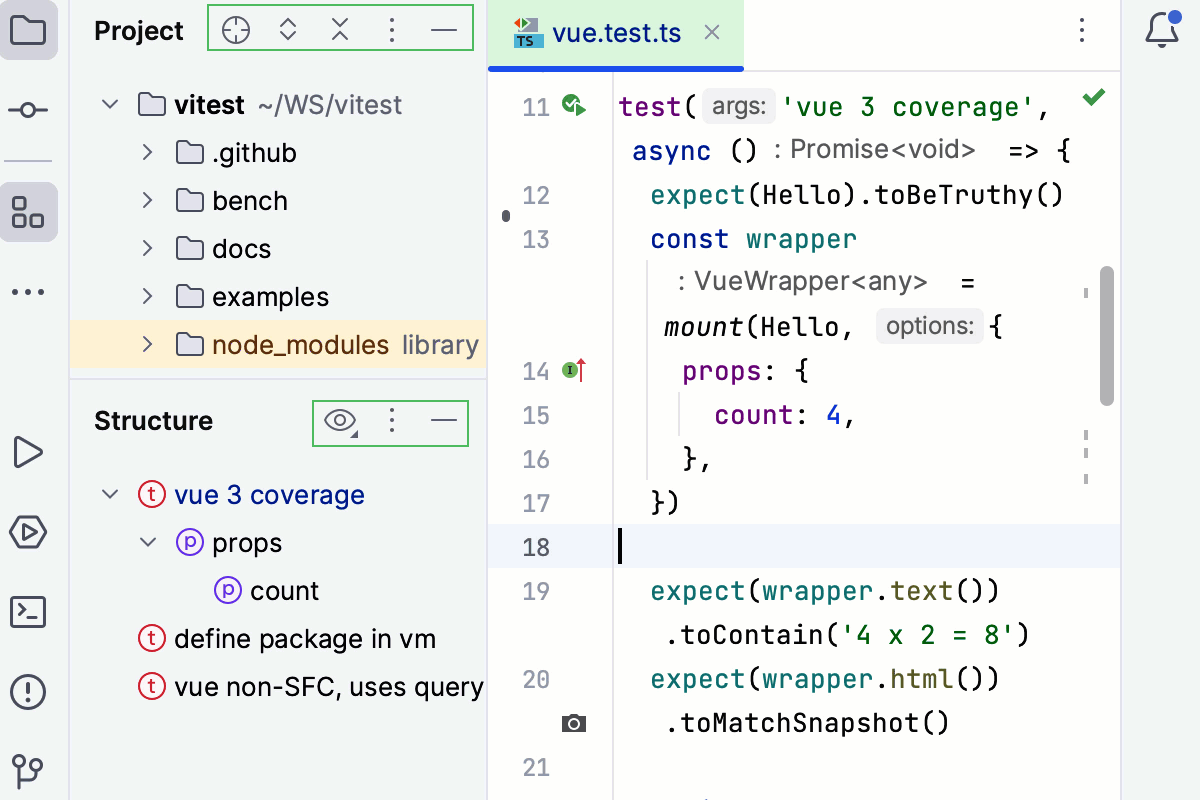
Tool windows
The tool windows have a new layout and behavior in the new UI:
To reduce the elements present in the visible area, some actions appear only on hover. To make the tool window buttons visible at all times, open the Settings dialog (Ctrl+Alt+S) , go to Advanced Settings, and select the Always show tool window header icons in the new UI checkbox in the Tool Windows area.
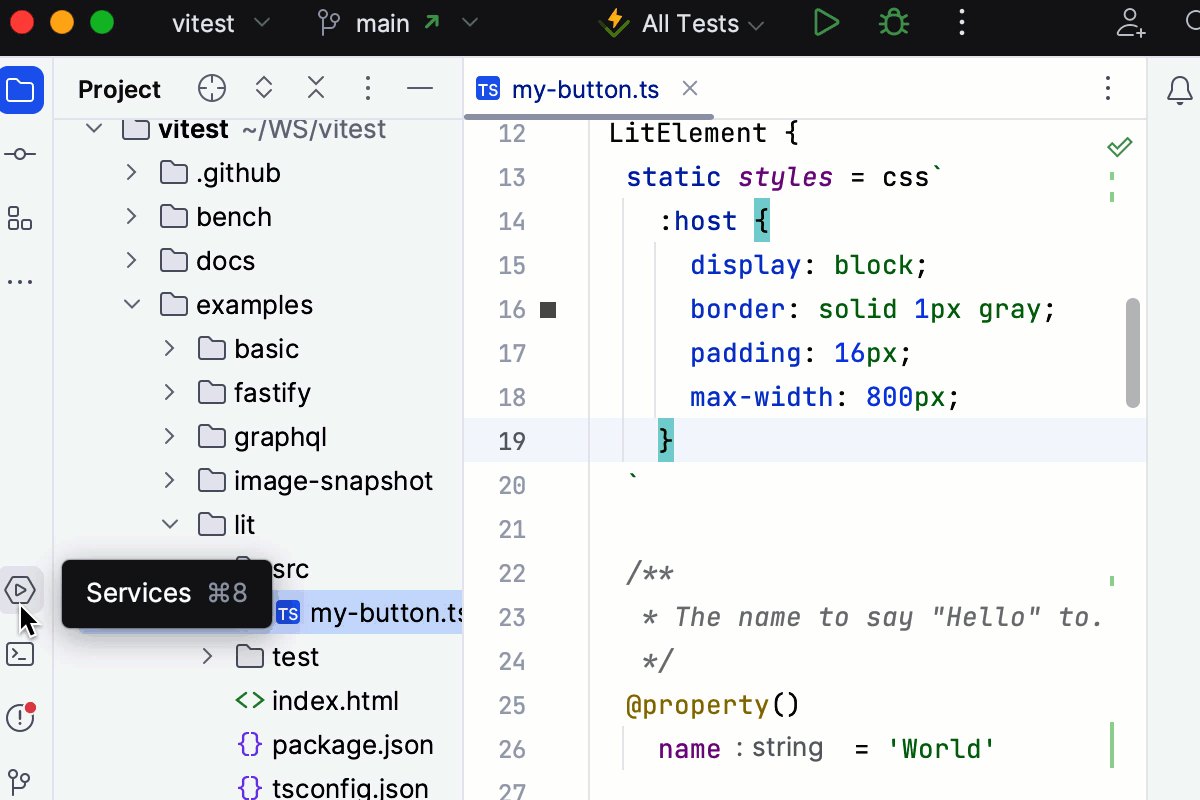
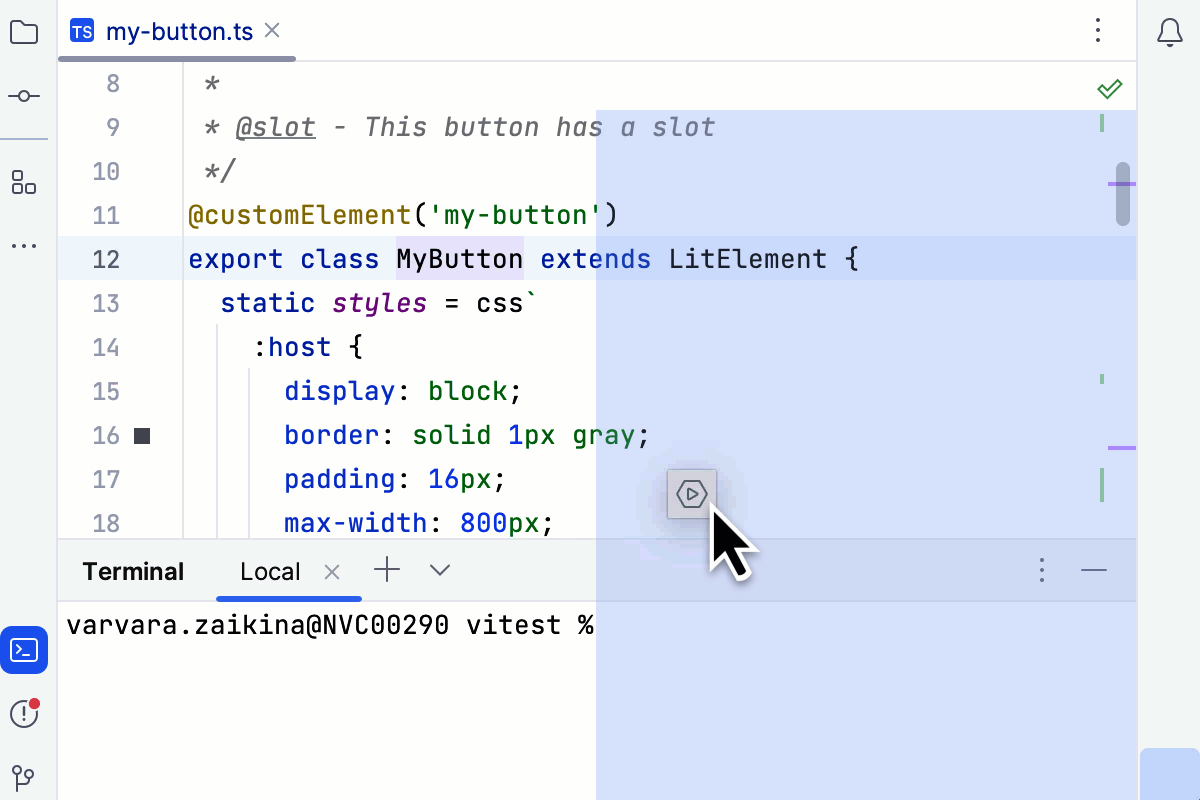
Tool window icons located at the top left and top right of the border will open vertical windows on the left and right sides accordingly.
Tool window icons located at the bottom left and bottom right of the border will open horizontal tool windows at the bottom of WebStorm.
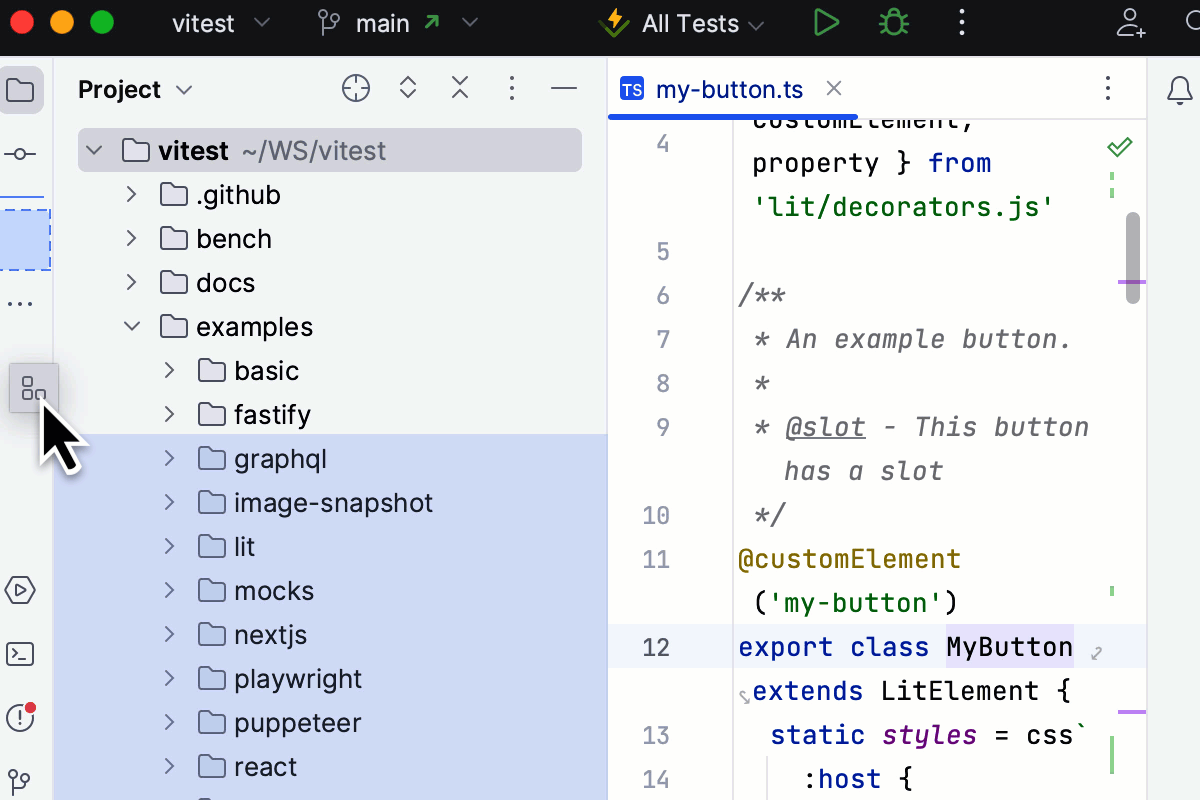
Use the vertical and horizontal split to arrange tool windows: drag a tool window icon along the sidebar and drop it under the separator for the vertical split or on the other sidebar for a horizontal split.
Tool windows not present in the UI border can be found under the More tool windows button. When a tool window is opened from More tool windows, its button will be added to the UI border at its default location.
Navigation bar
The navigation bar is now located in the status bar at the bottom of the main window.

If you prefer the former location, you can move it back to the top or turn it off completely. To do so, go to the main menu and select .
Editor tabs
Working with multiple editor tabs is now more convenient. If tabs don’t fit the screen, you can choose between using a scroll bar or squeezing the tabs to place all of them on the screen. Open the Settings dialog (Ctrl+Alt+S) , go to , and select the required option.


Gutter
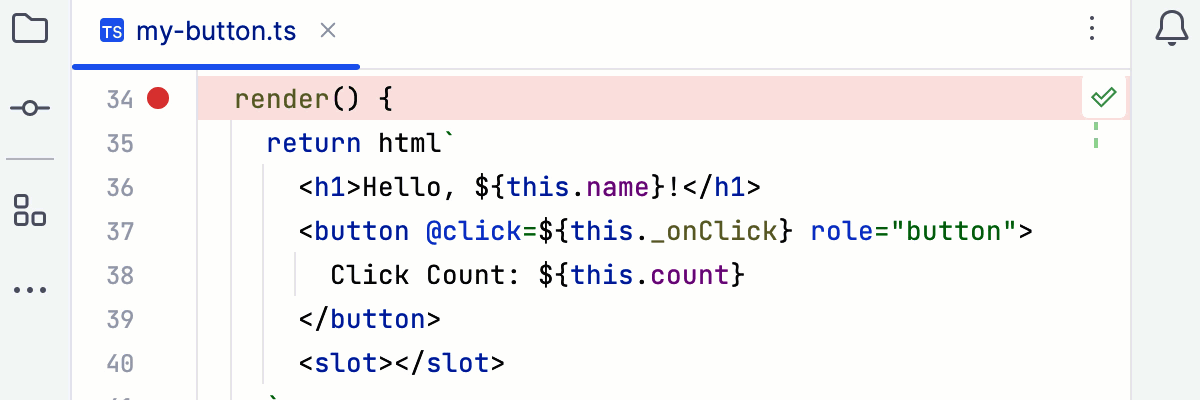
Breakpoints are now placed over line numbers by default to save horizontal space. You can place breakpoints near line numbers: press Ctrl+Shift+A, type
Breakpoints Over Line Numbers, and disable the option.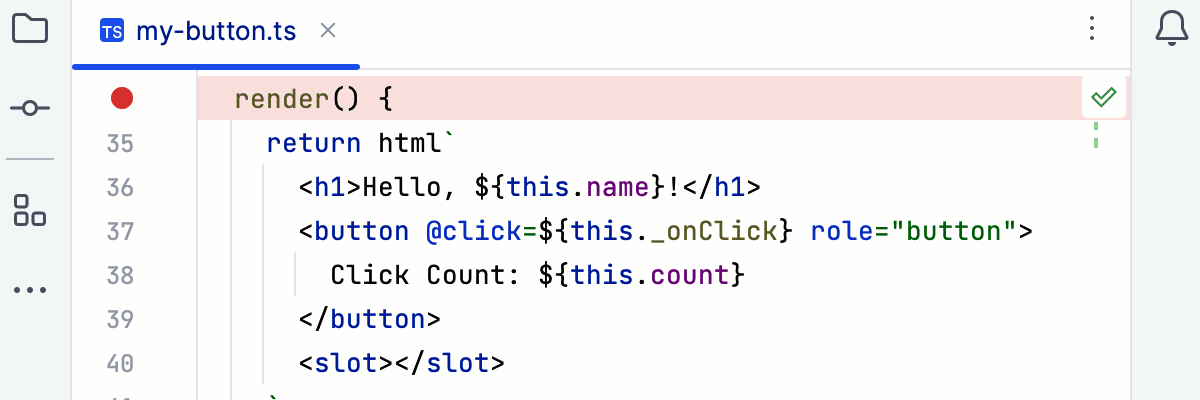
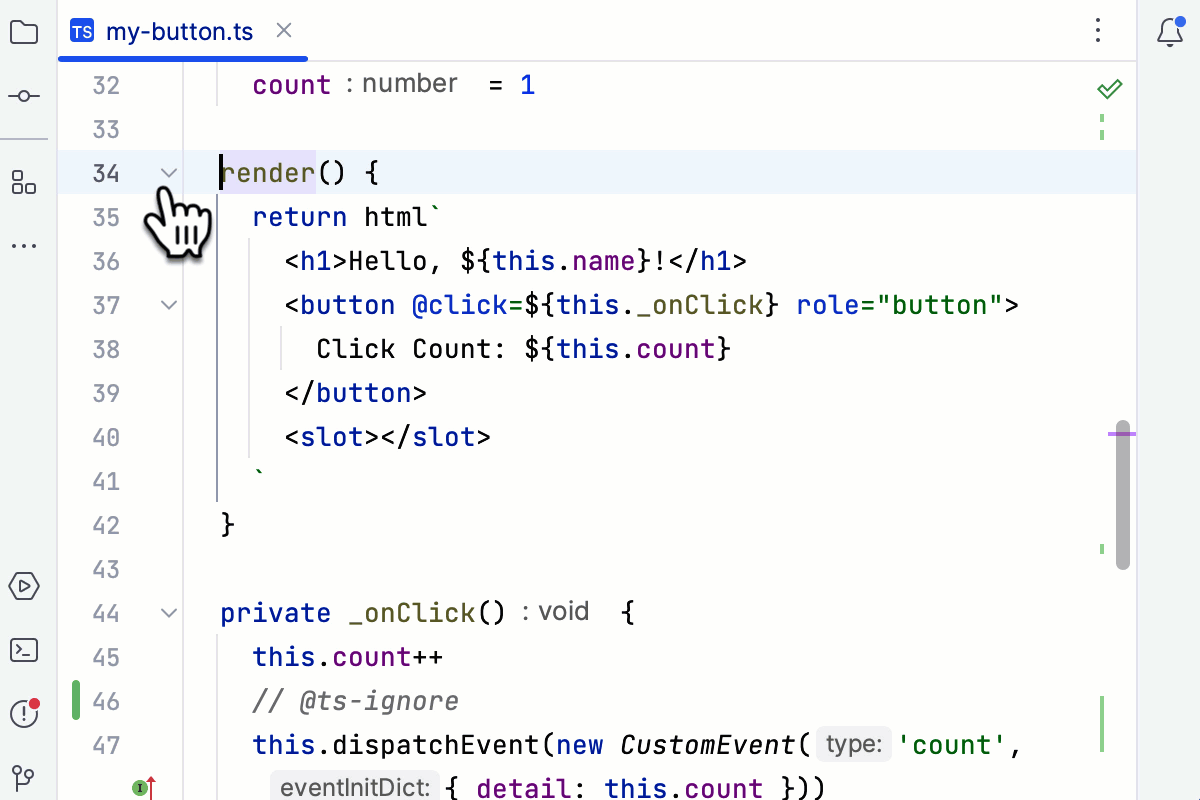
Folding icons have been updated. Icons for unfolded areas show up on hover for a less cluttered look.
You can configure the IDE to always display folding icons: go to and select Always next to Show code folding arrows.
Annotations (
Git Blame) have an updated color palette to help you see the recent changes faster.
Running and debugging
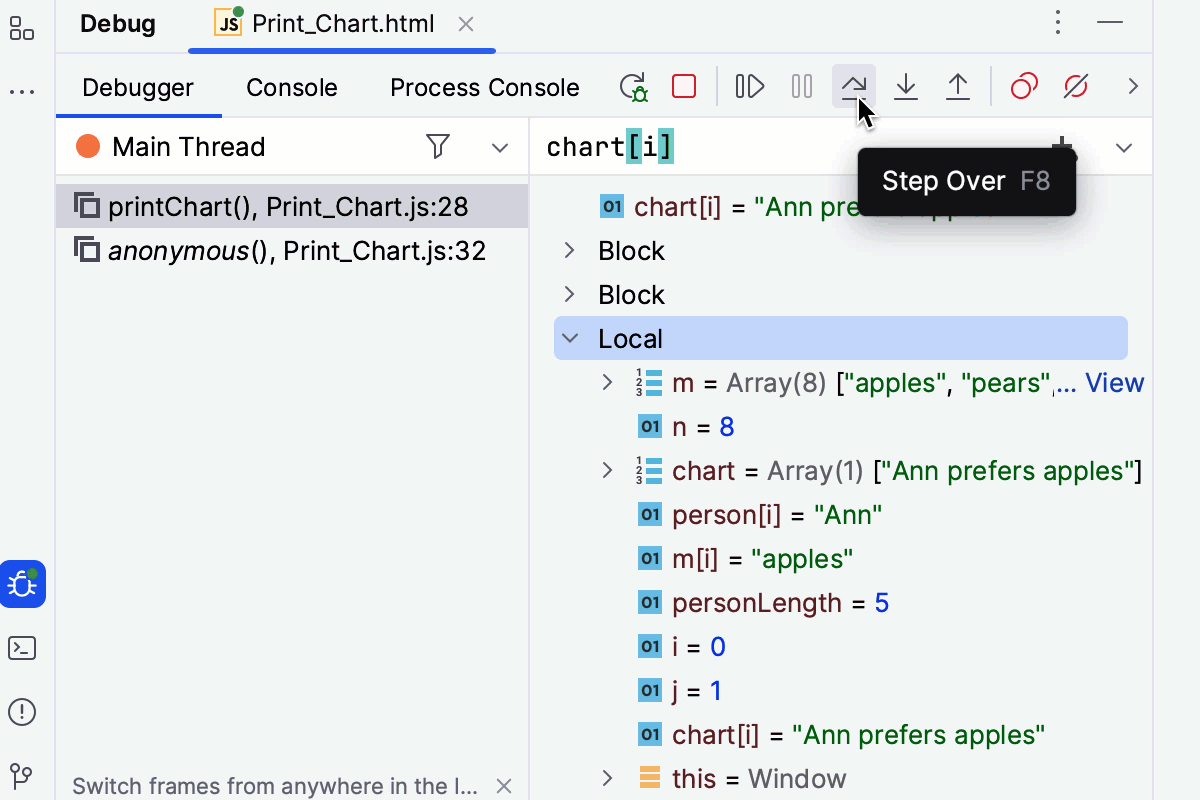
Debug tool window
Two separate toolbars with the main debug actions have been moved to a single toolbar near the tool window tabs. Tabs for switching between the Threads & Variables view and the Console now also appear in the tool window tabs when there is a single running configuration.
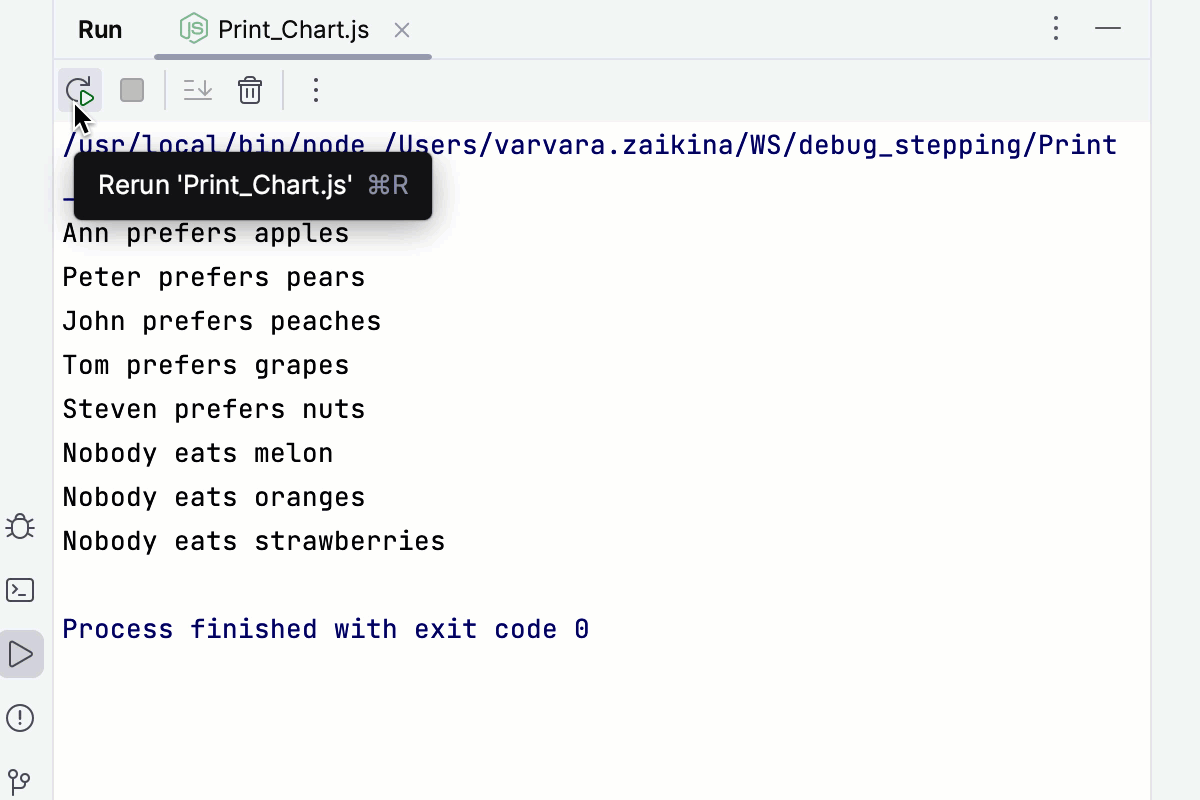
Run tool window
The toolbar with run actions was moved to the tool window tabs to be consistent with the Debug tool window.
How to share feedback
Go to and click Submit feedback… to share your thoughts with us.
