Step through the program
Stepping is the process of controlling step-by-step execution of the program.
After you have started the debugging session and suspended your program, WebStorm provides you with a set of stepping actions. The choice of a particular stepping action depends on your strategy, such as whether you need to go directly to the next line or inspect the intermediate method calls as well.
The stepping buttons are located on the Debug tool window toolbar. You can access more stepping actions under the ![]() menu.
menu.

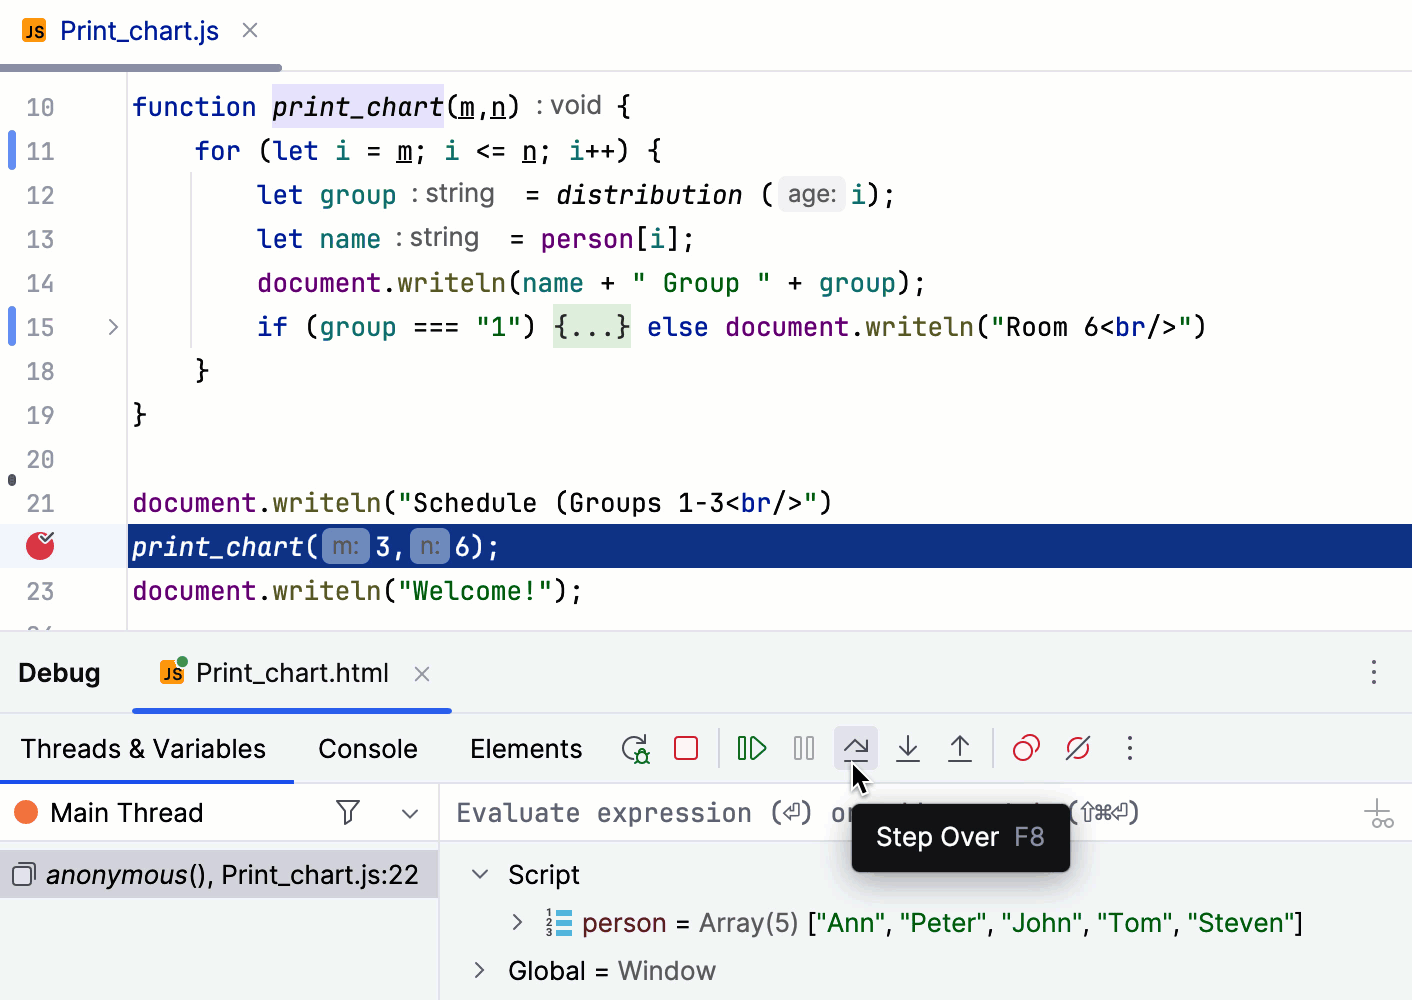
Step over
Steps over the current line of code and takes you to the next line even if the highlighted line has method calls in it. The implementation of the methods is skipped, and you move straight to the next line of the caller method.
In the example, line 22 is about to be executed. If you step over, the debugger will move straight to line 23 without visiting the print_chart() method.
If there are breakpoints inside the skipped methods, the debugger will stop at them.
To skip any breakpoints on the way, use Force step over Alt+Shift+F8.
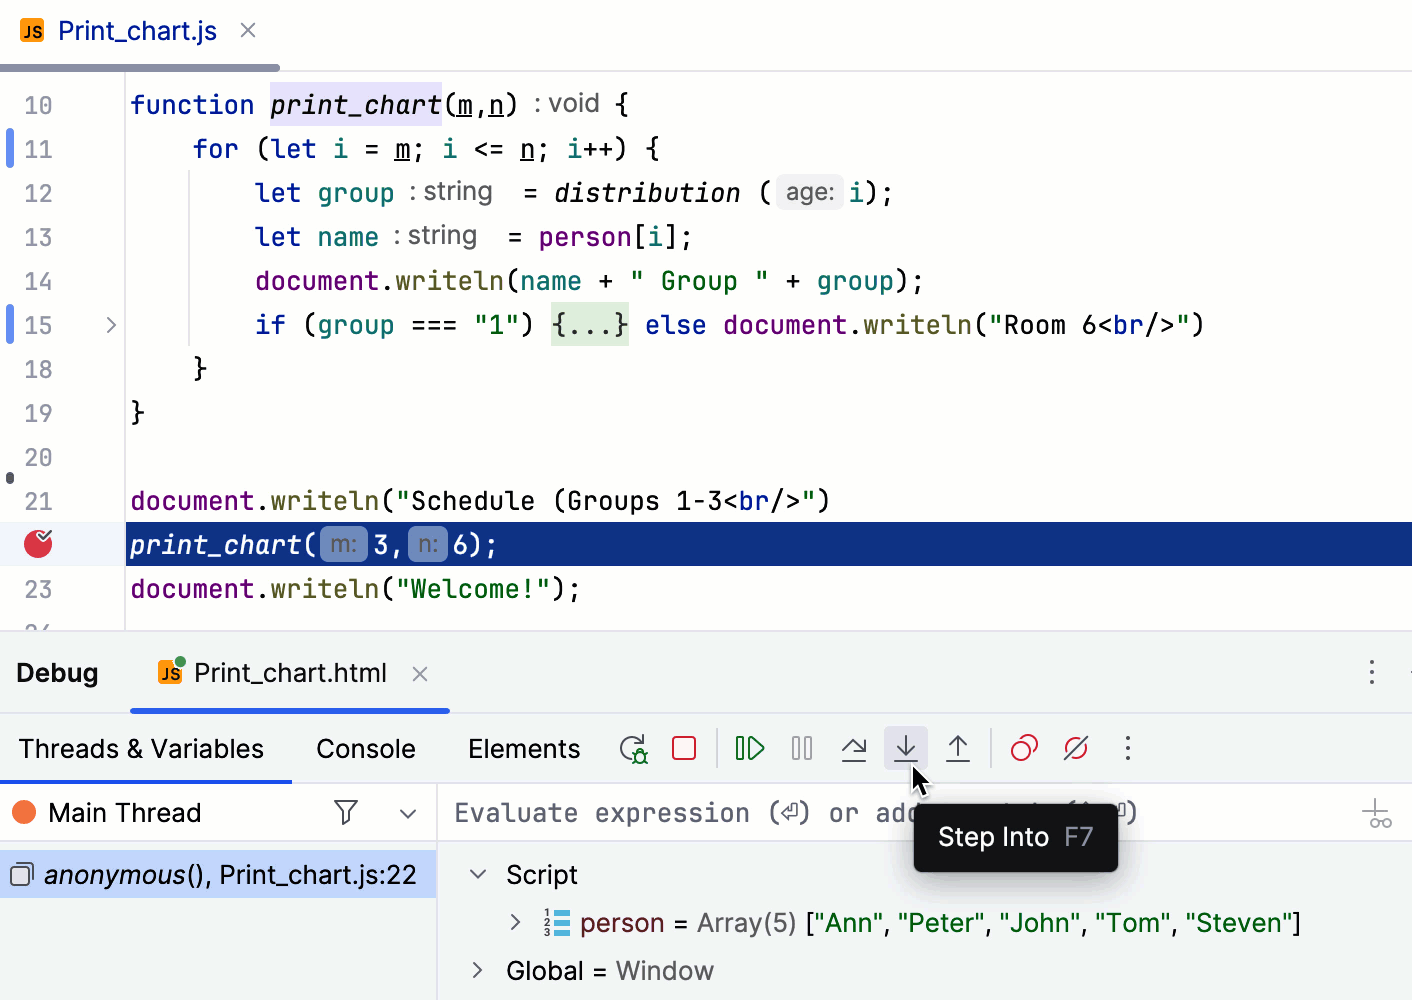
Step into
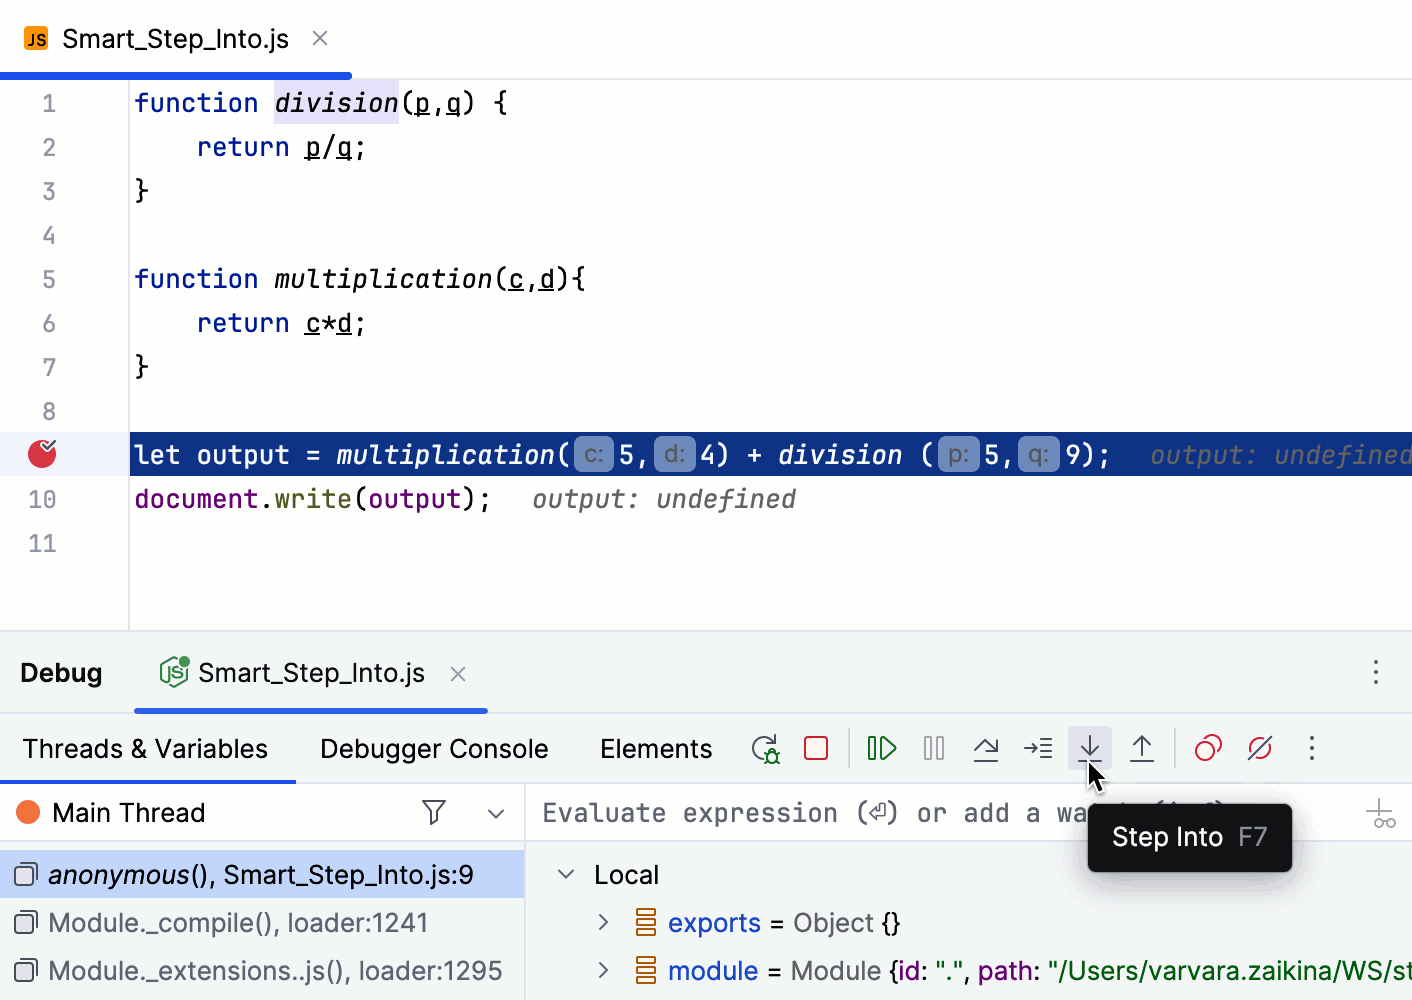
Steps inside the code of a called function.
In the example, line 22 is about to be executed. If you step into, the debugger will enter the implementation of the print_chart() method allowing you to examine in detail how its result is produced.
If there are several method calls on the line, WebStorm asks you which method to enter. This feature is called Smart step into.
By default, Smart Step Into is used automatically every time you invoke Step Into F7 on a line with multiple method calls. You can turn off automatic Smart Step Into and enter each called method in the order they are called using the Step Into and Step Out buttons.
Some scripts are skipped by Step into as you normally might not need to debug them.
Suppress stepping into scripts
In the Settings dialog (Ctrl+Alt+S) , go to . The Debugger. Stepping page opens.
To suppress automatic Smart Step Into, clear the Always do smart step into checkbox.
To skip all library scripts, select the Do not step into library scripts checkbox. See example below.
To suppress stepping into some specific scripts, select the Do not step into scripts checkbox and create a list of such scripts using the toolbar buttons.
Smart step into
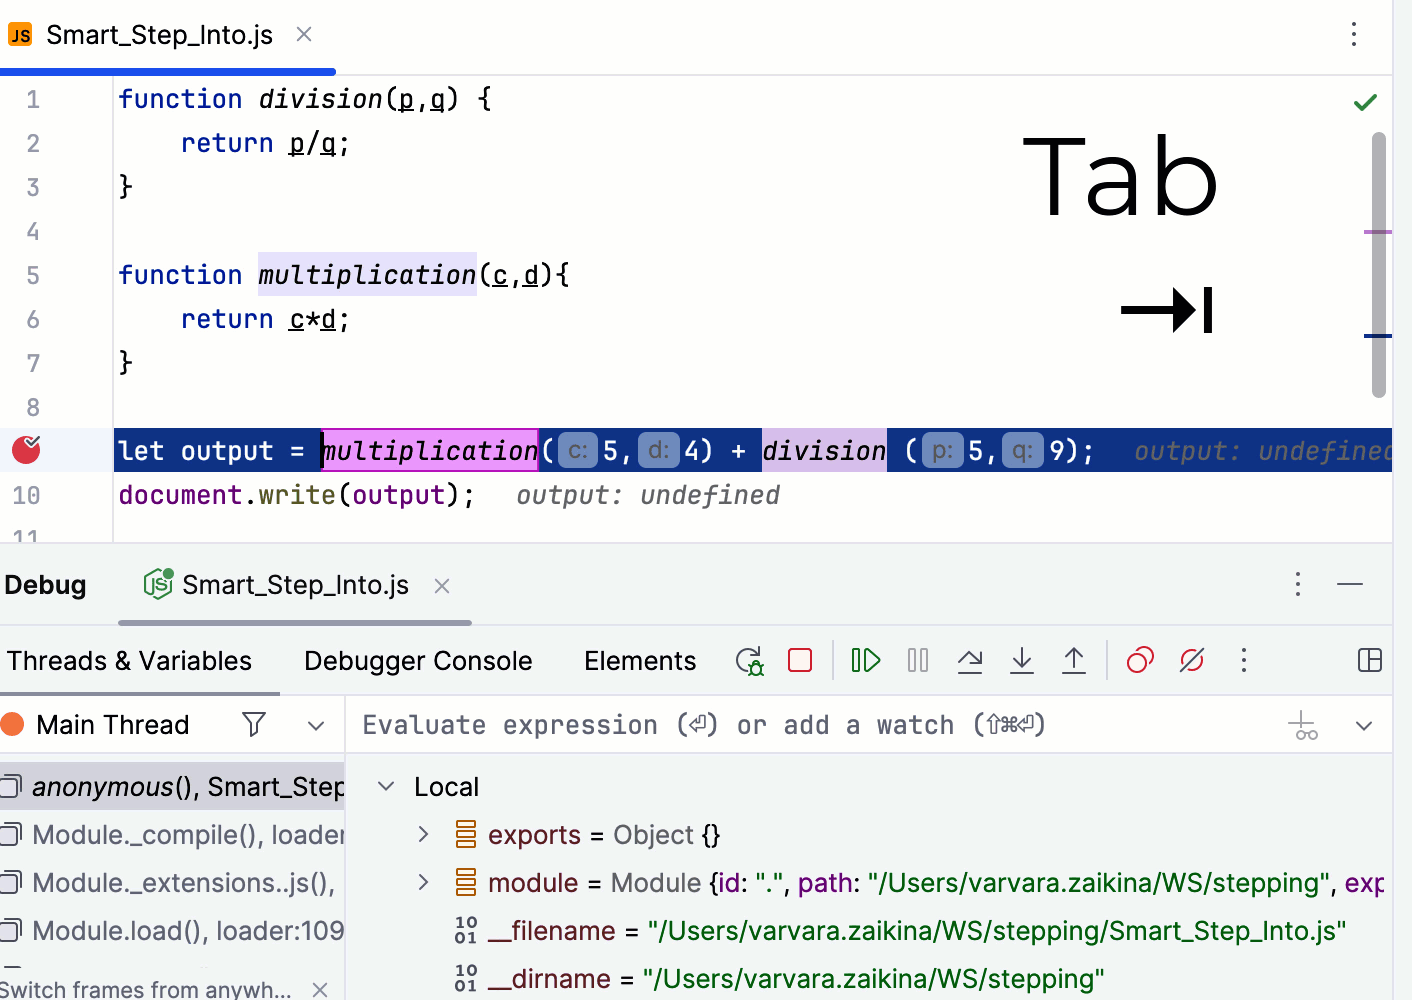
Smart step into is helpful when there are several method calls on a line, and you want to be specific about which method to enter. This feature allows you to select the method call you are interested in.
Use Tab to switch between the method calls and press Enter to select the method to step into.
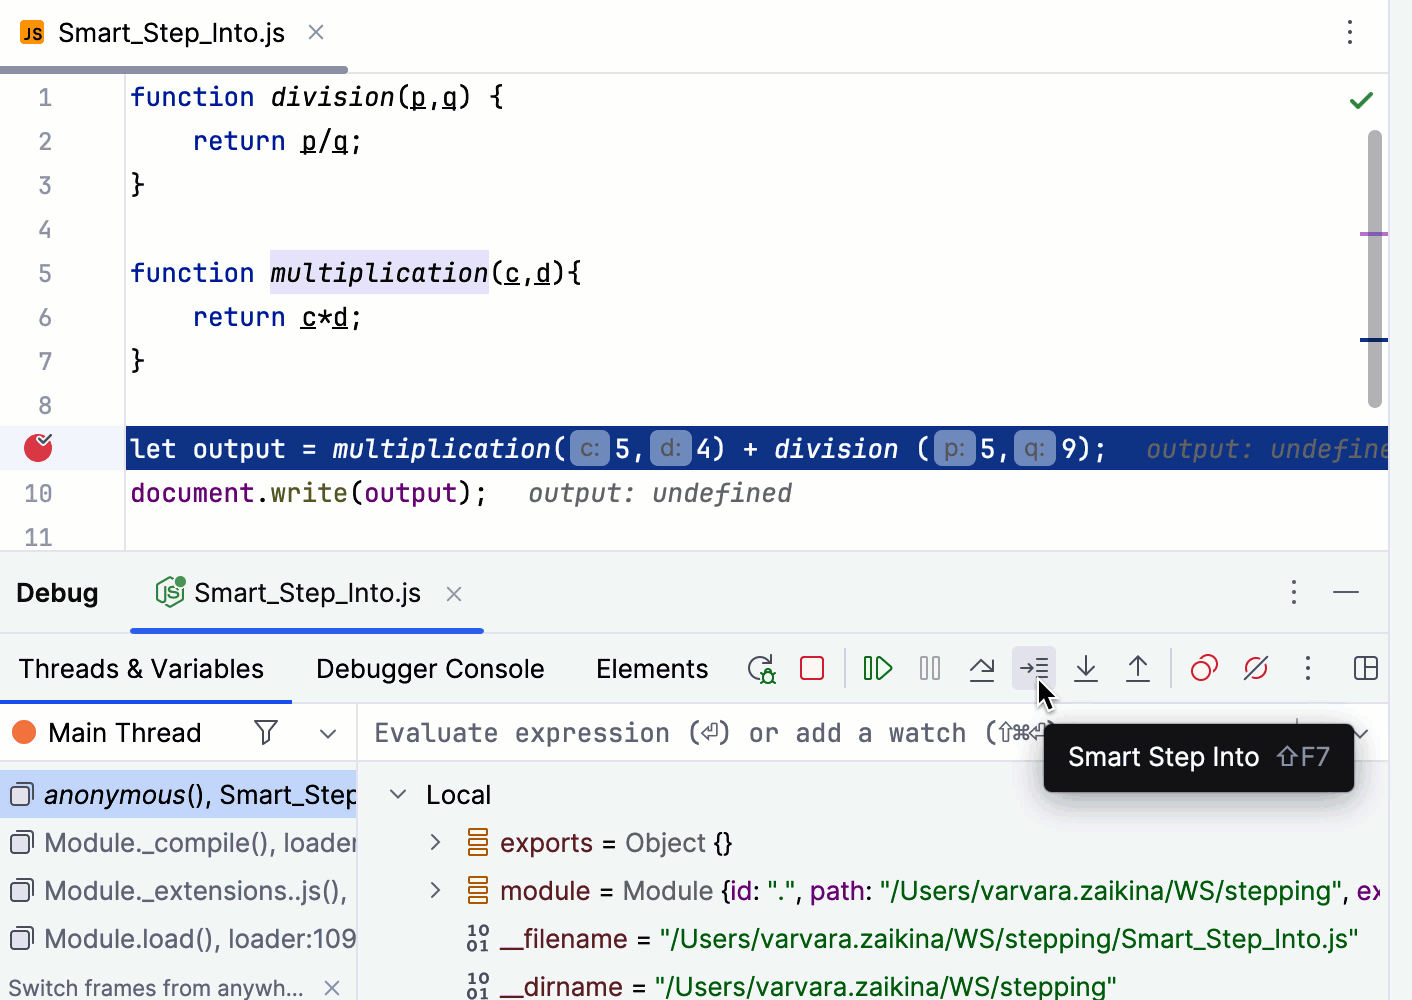
By default, Smart Step Into is used automatically every time you invoke Step Into on a line with multiple method calls.
To suppress automatic Smart Step Into, open the Settings dialog (Ctrl+Alt+S) , go to , and clear the Always do smart step into checkbox.
After that, the ![]() icon appears on the toolbar of the Debug tool window. Click this icon or press Shift+F7 to invoke Smart Step Into manually.
icon appears on the toolbar of the Debug tool window. Click this icon or press Shift+F7 to invoke Smart Step Into manually.
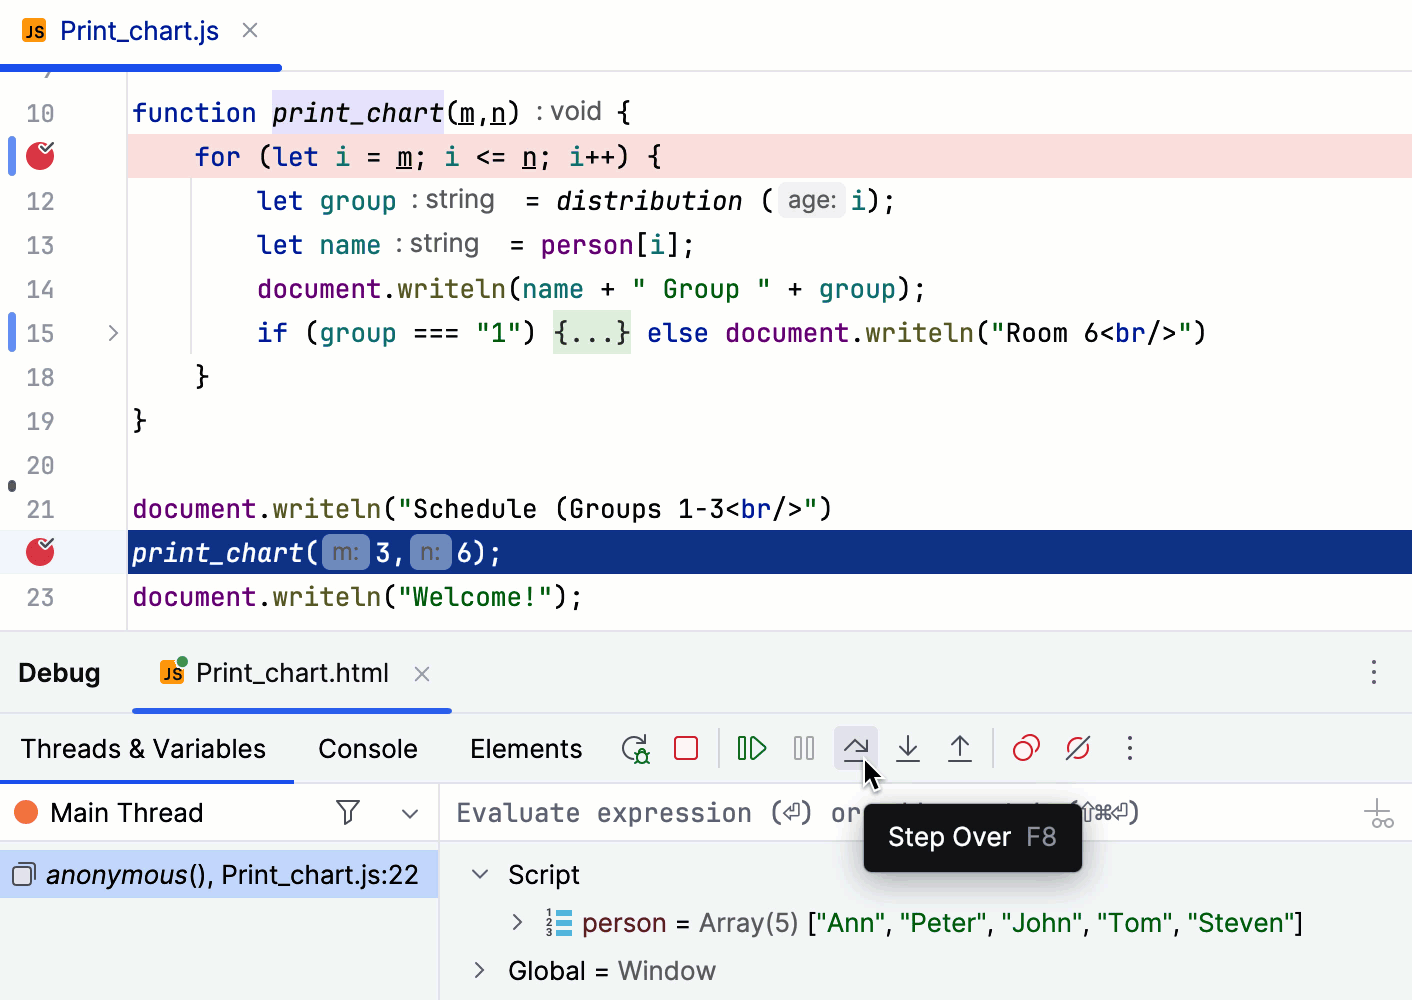
Step out
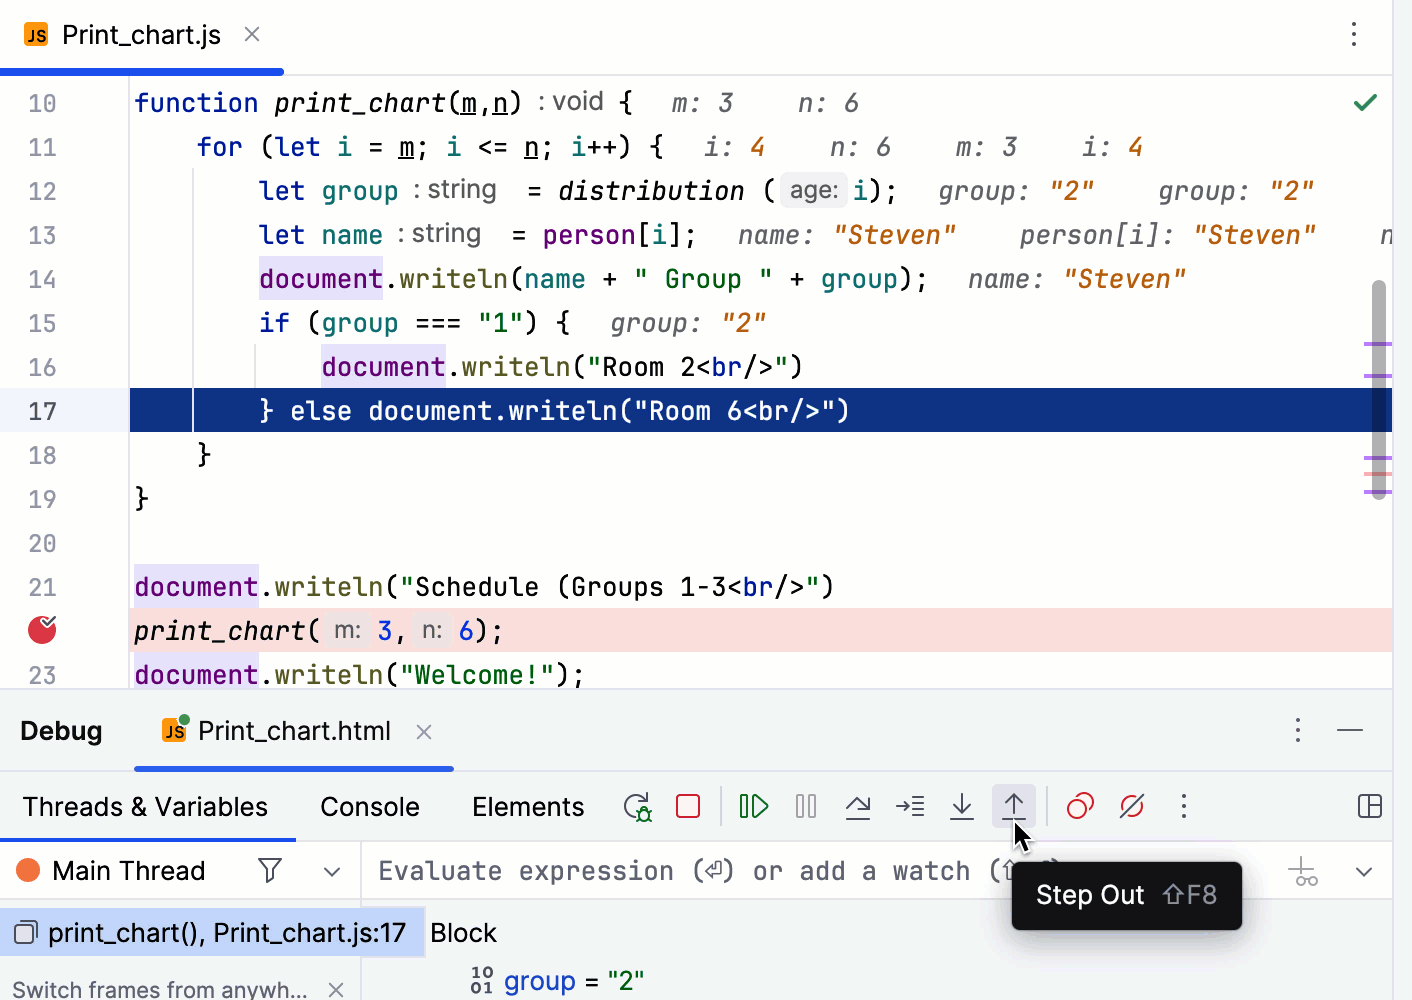
Steps out of the current method and takes you to its call.
In the example, stepping out skips all iterations of the loop and takes you straight to its call.
Run to cursor
Continues the execution until the position of the caret is reached.
Place the caret at the line where you want the program to pause and select Run to Cursor from the
 menu or press Alt+F9.
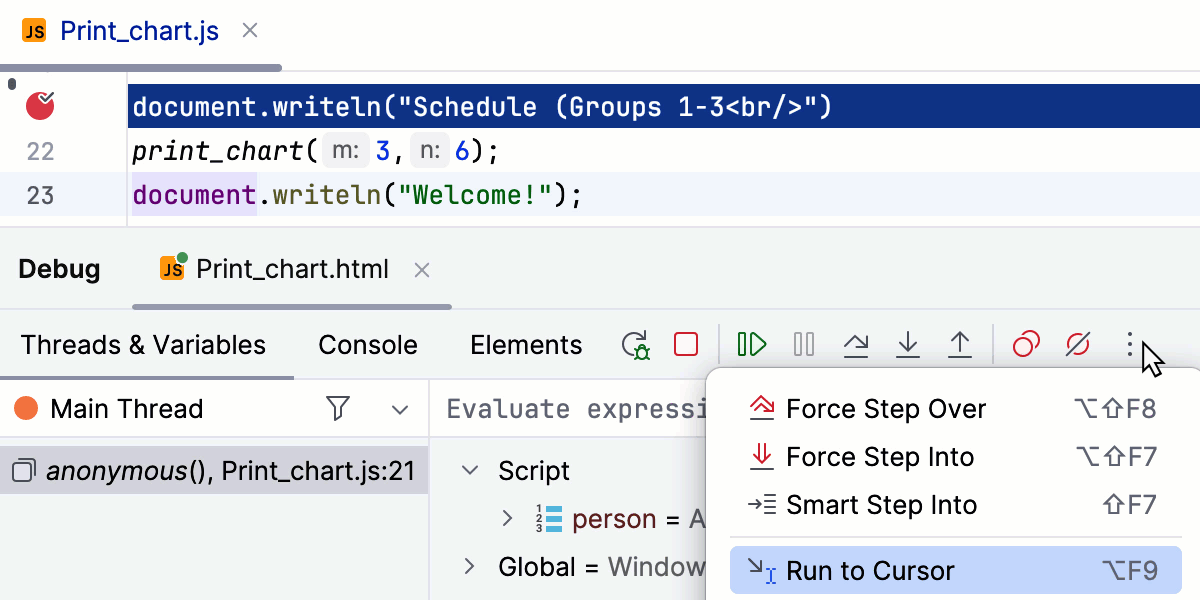
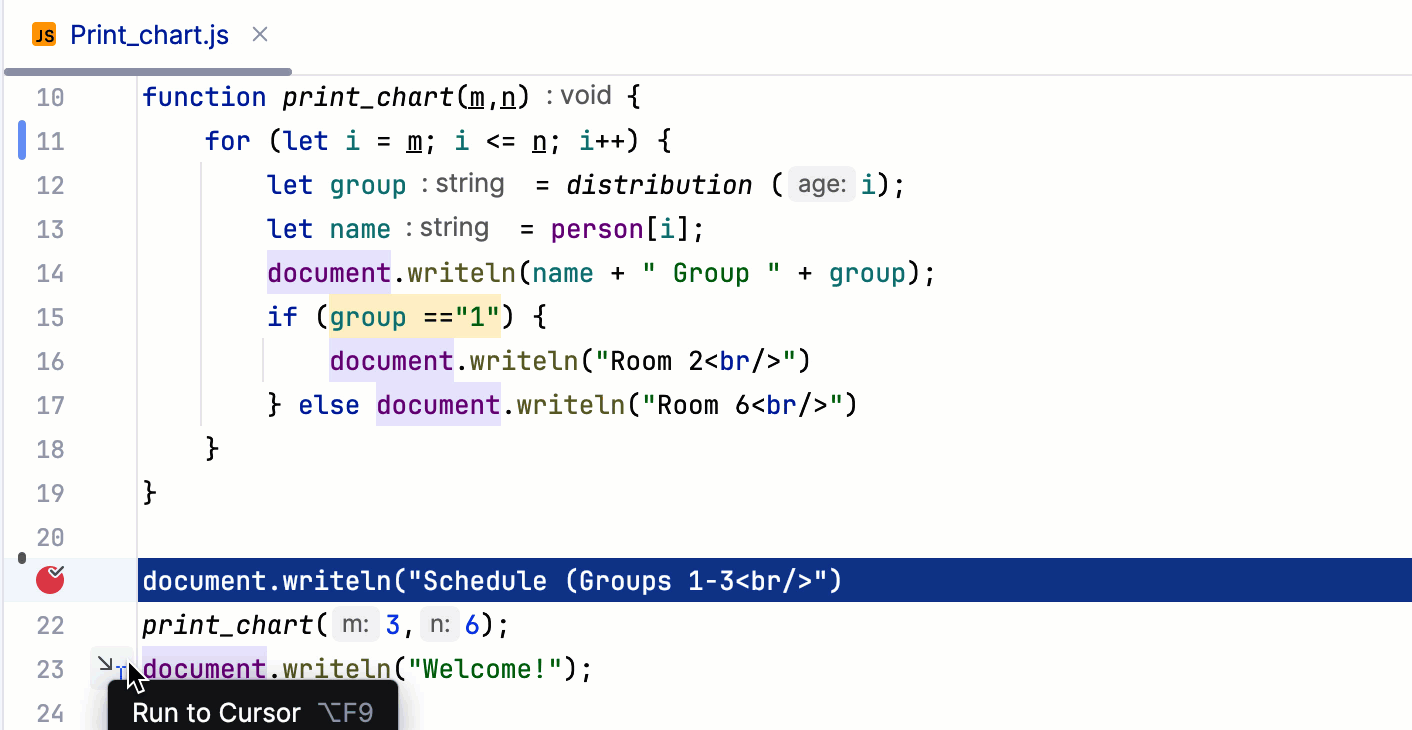
Hover over the gutter next to the line where you want to run to and click
 .
.
In the example, Run to Cursor will continue the execution and stop at line 23 as if there were a breakpoint.
If there are breakpoints in the print_chart() method, the program will be suspended there.
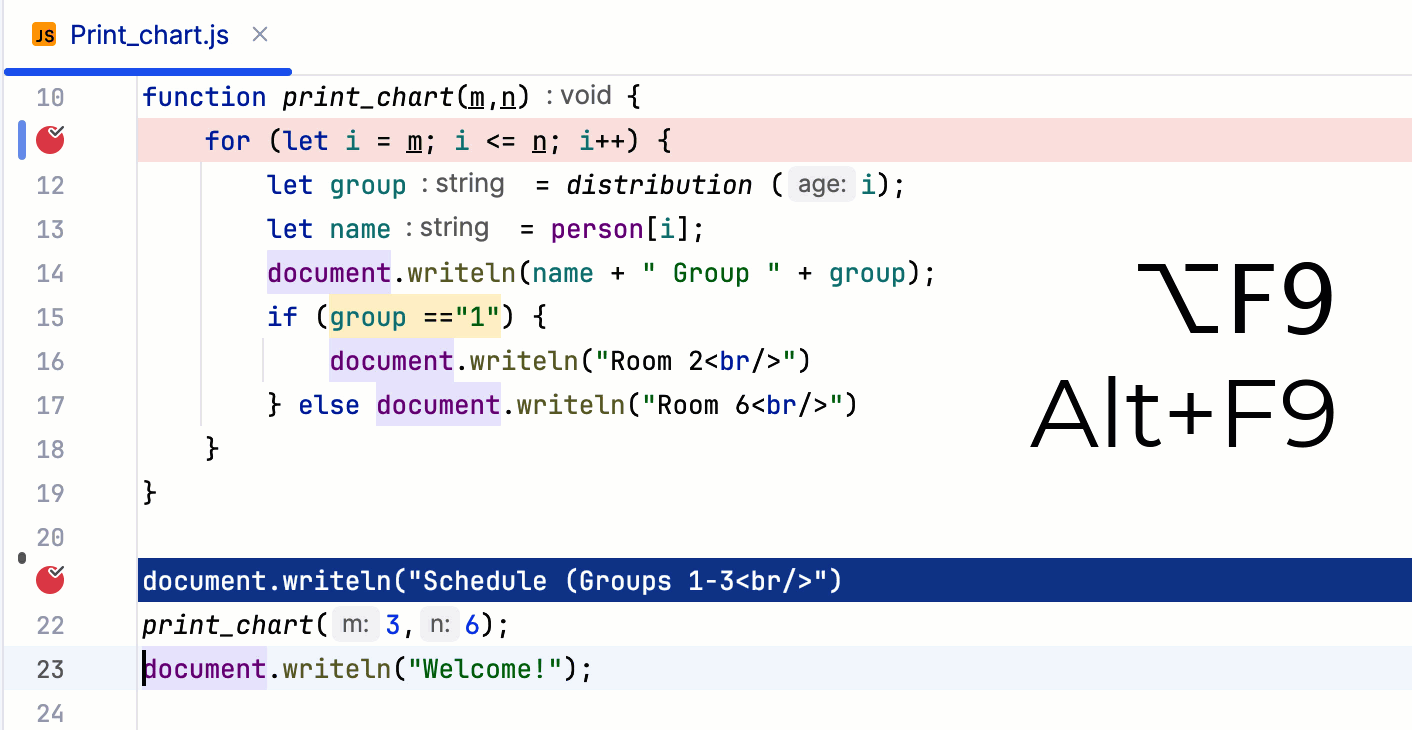
To skip any breakpoints on the way, use Force run to cursor.
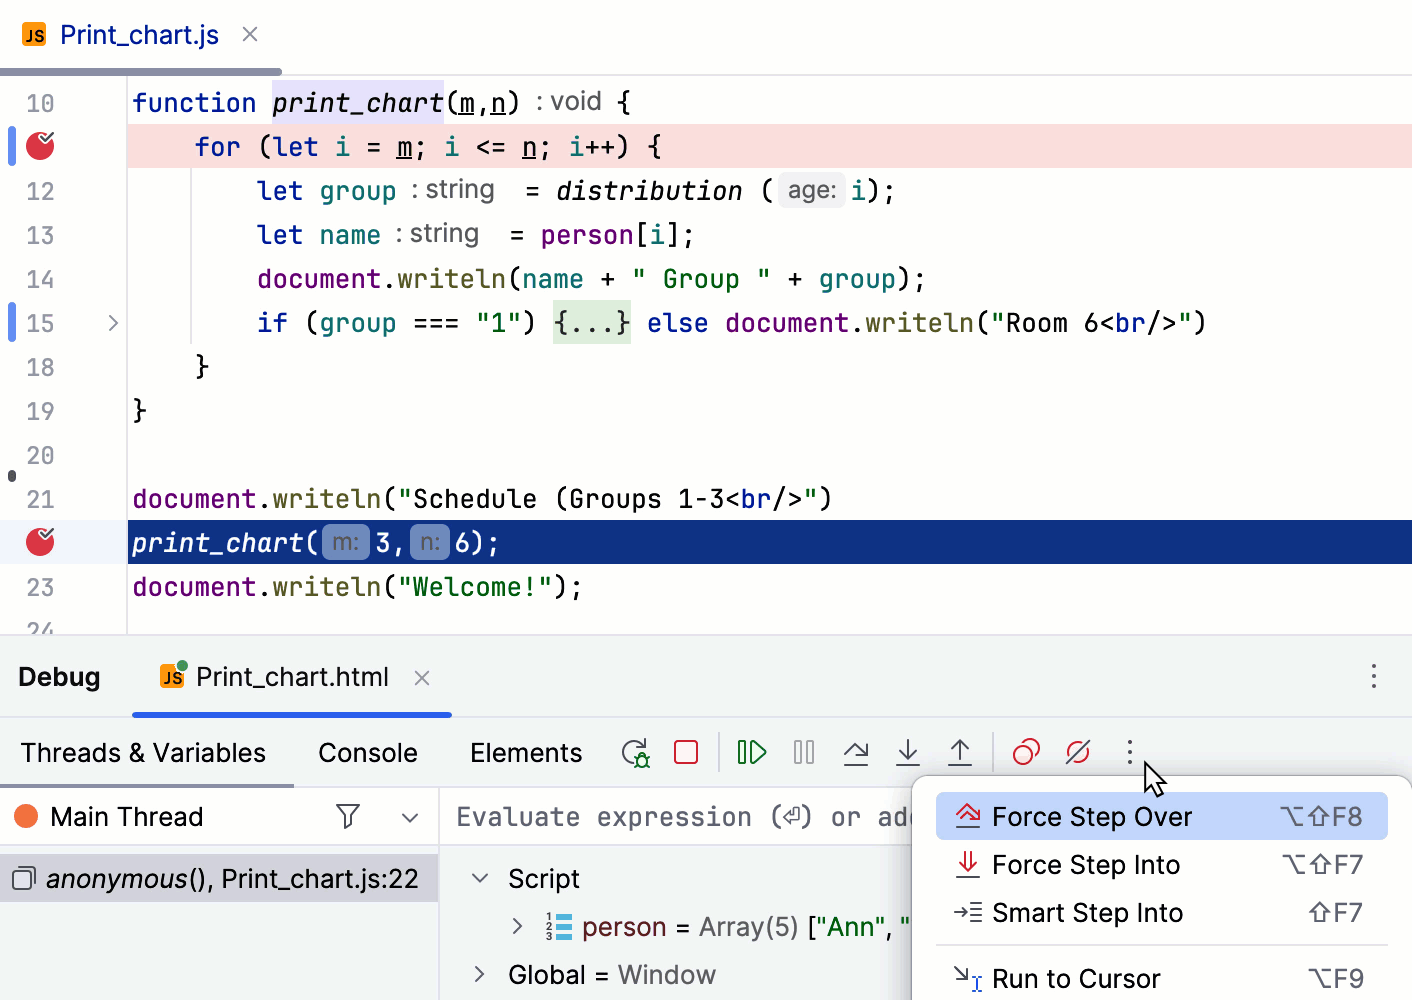
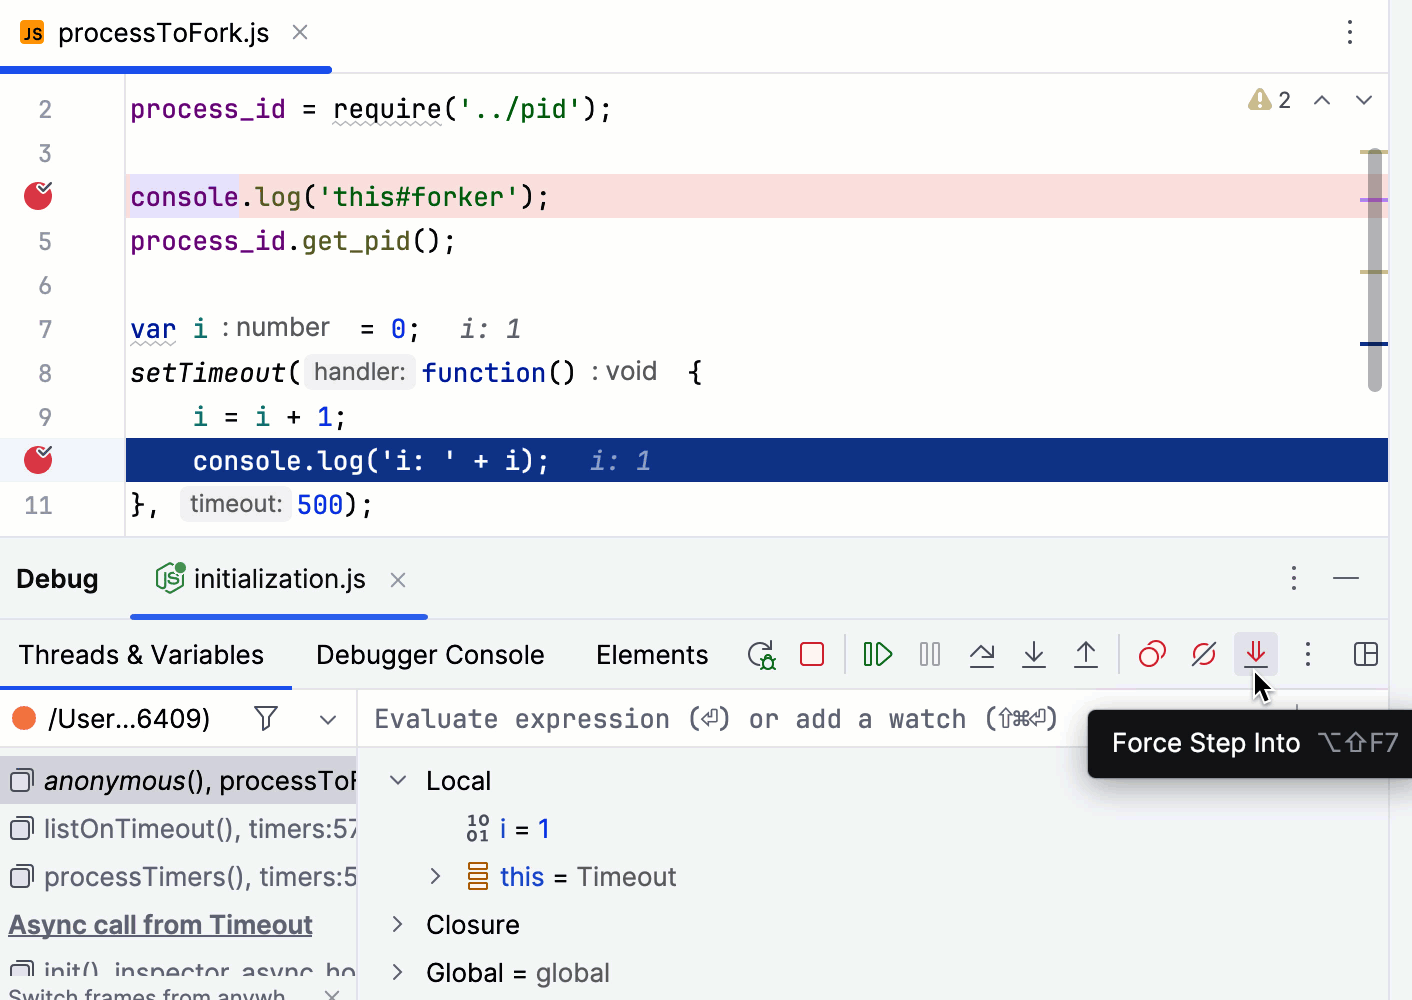
Force step into
Steps in the method even if this method is skipped by the regular Step Into.
Press Alt+Shift+F7.
Click
on the toolbar and select Force Step Into from the list.
Click
 on the toolbar.
To add
to the debugger toolbar, right-click the toolbar, select Add to Debugger Toolbar from the context menu, and then select Force Step Into from the list.
Go to .
Example
In the example below, the debugger skips a library method console.log() with regular Step Into at line 4 but enters this method at line 10 with Force Step Into.
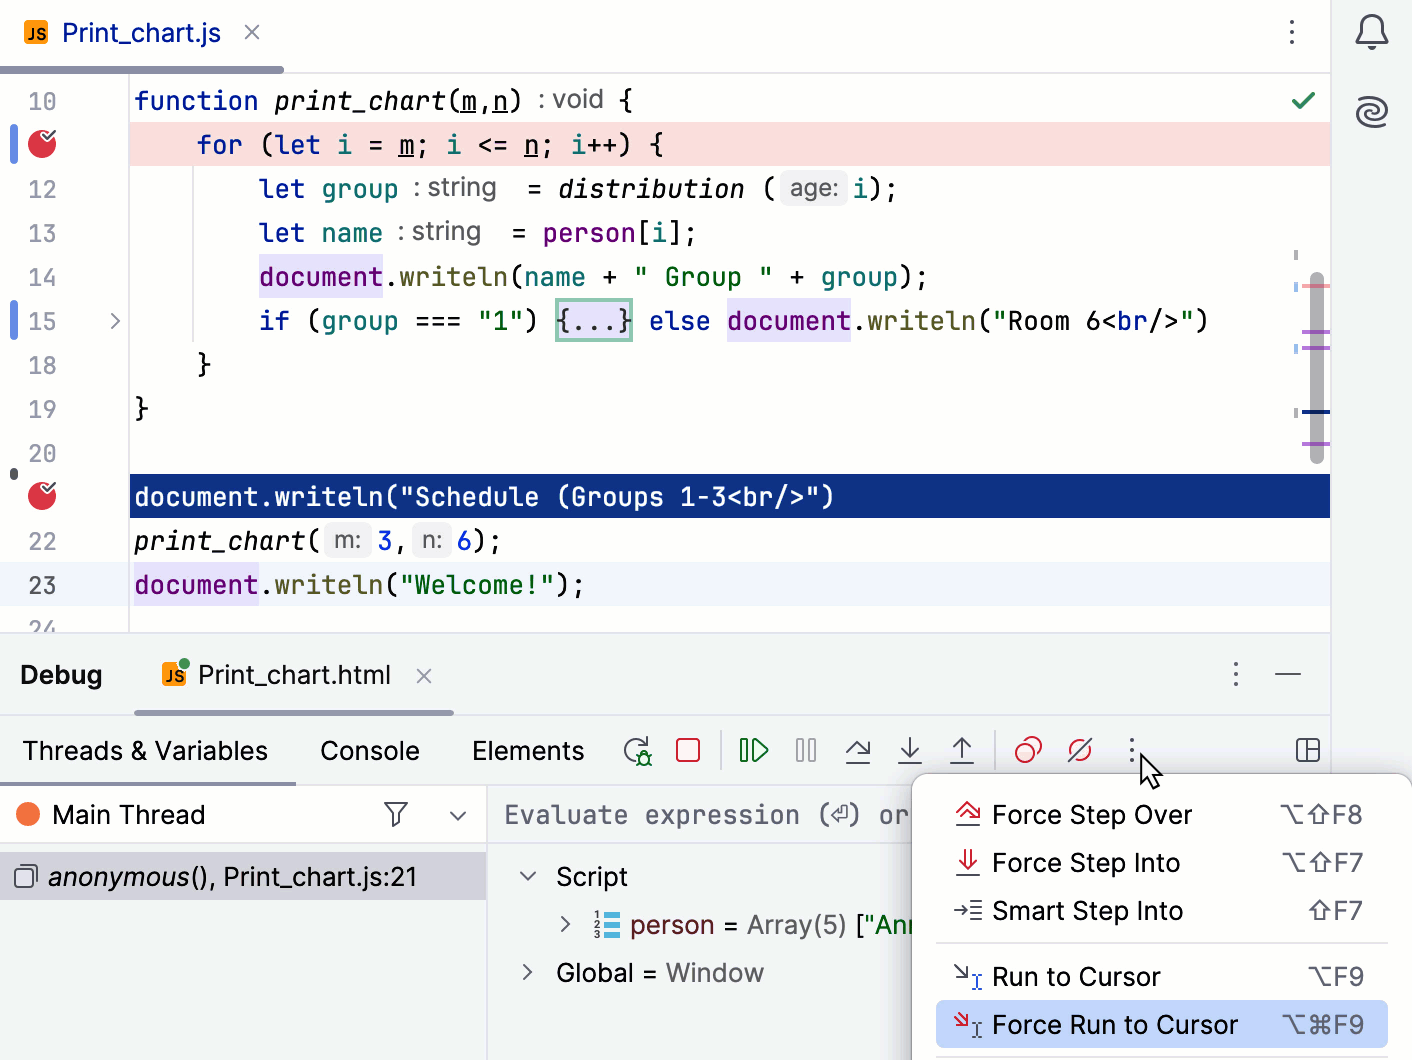
Force run to cursor
Continues the execution until the position of the caret is reached. All breakpoints on the way are ignored.
Place the caret at the line where you want the program to pause.
Select Force Run to Cursor from the
menu or press Ctrl+Alt+F9.
In the example, Force run to cursor will continue the execution and stop at line 24 as if there were a breakpoint. The breakpoint inside print_chart() will not have any effect.
Force step over
Steps over a line with a call of a method where breakpoints are set. The breakpoints are ignored.
In the example, force stepping over takes you to the print statement on line 22 even though there is a breakpoint in the print_chart() method, which would otherwise, with Step Over, suspend the application in all iterations of the loop.