Reporting
Report everything
YouTrack comes with 20 reports in 4 categories to help you track, manage, and analyze a wide range of performance and progress indicators:
- Issue distribution reports
- Timeline reports
- Time management reports
- State transition reports
Reports have visibility settings, so you can keep them private, share them with specific users or teams, or make them public. In the same way, you can also specify which users can edit a report. Multiple reports can be combined on dashboards.
Get YouTrack for free for a team of 10.
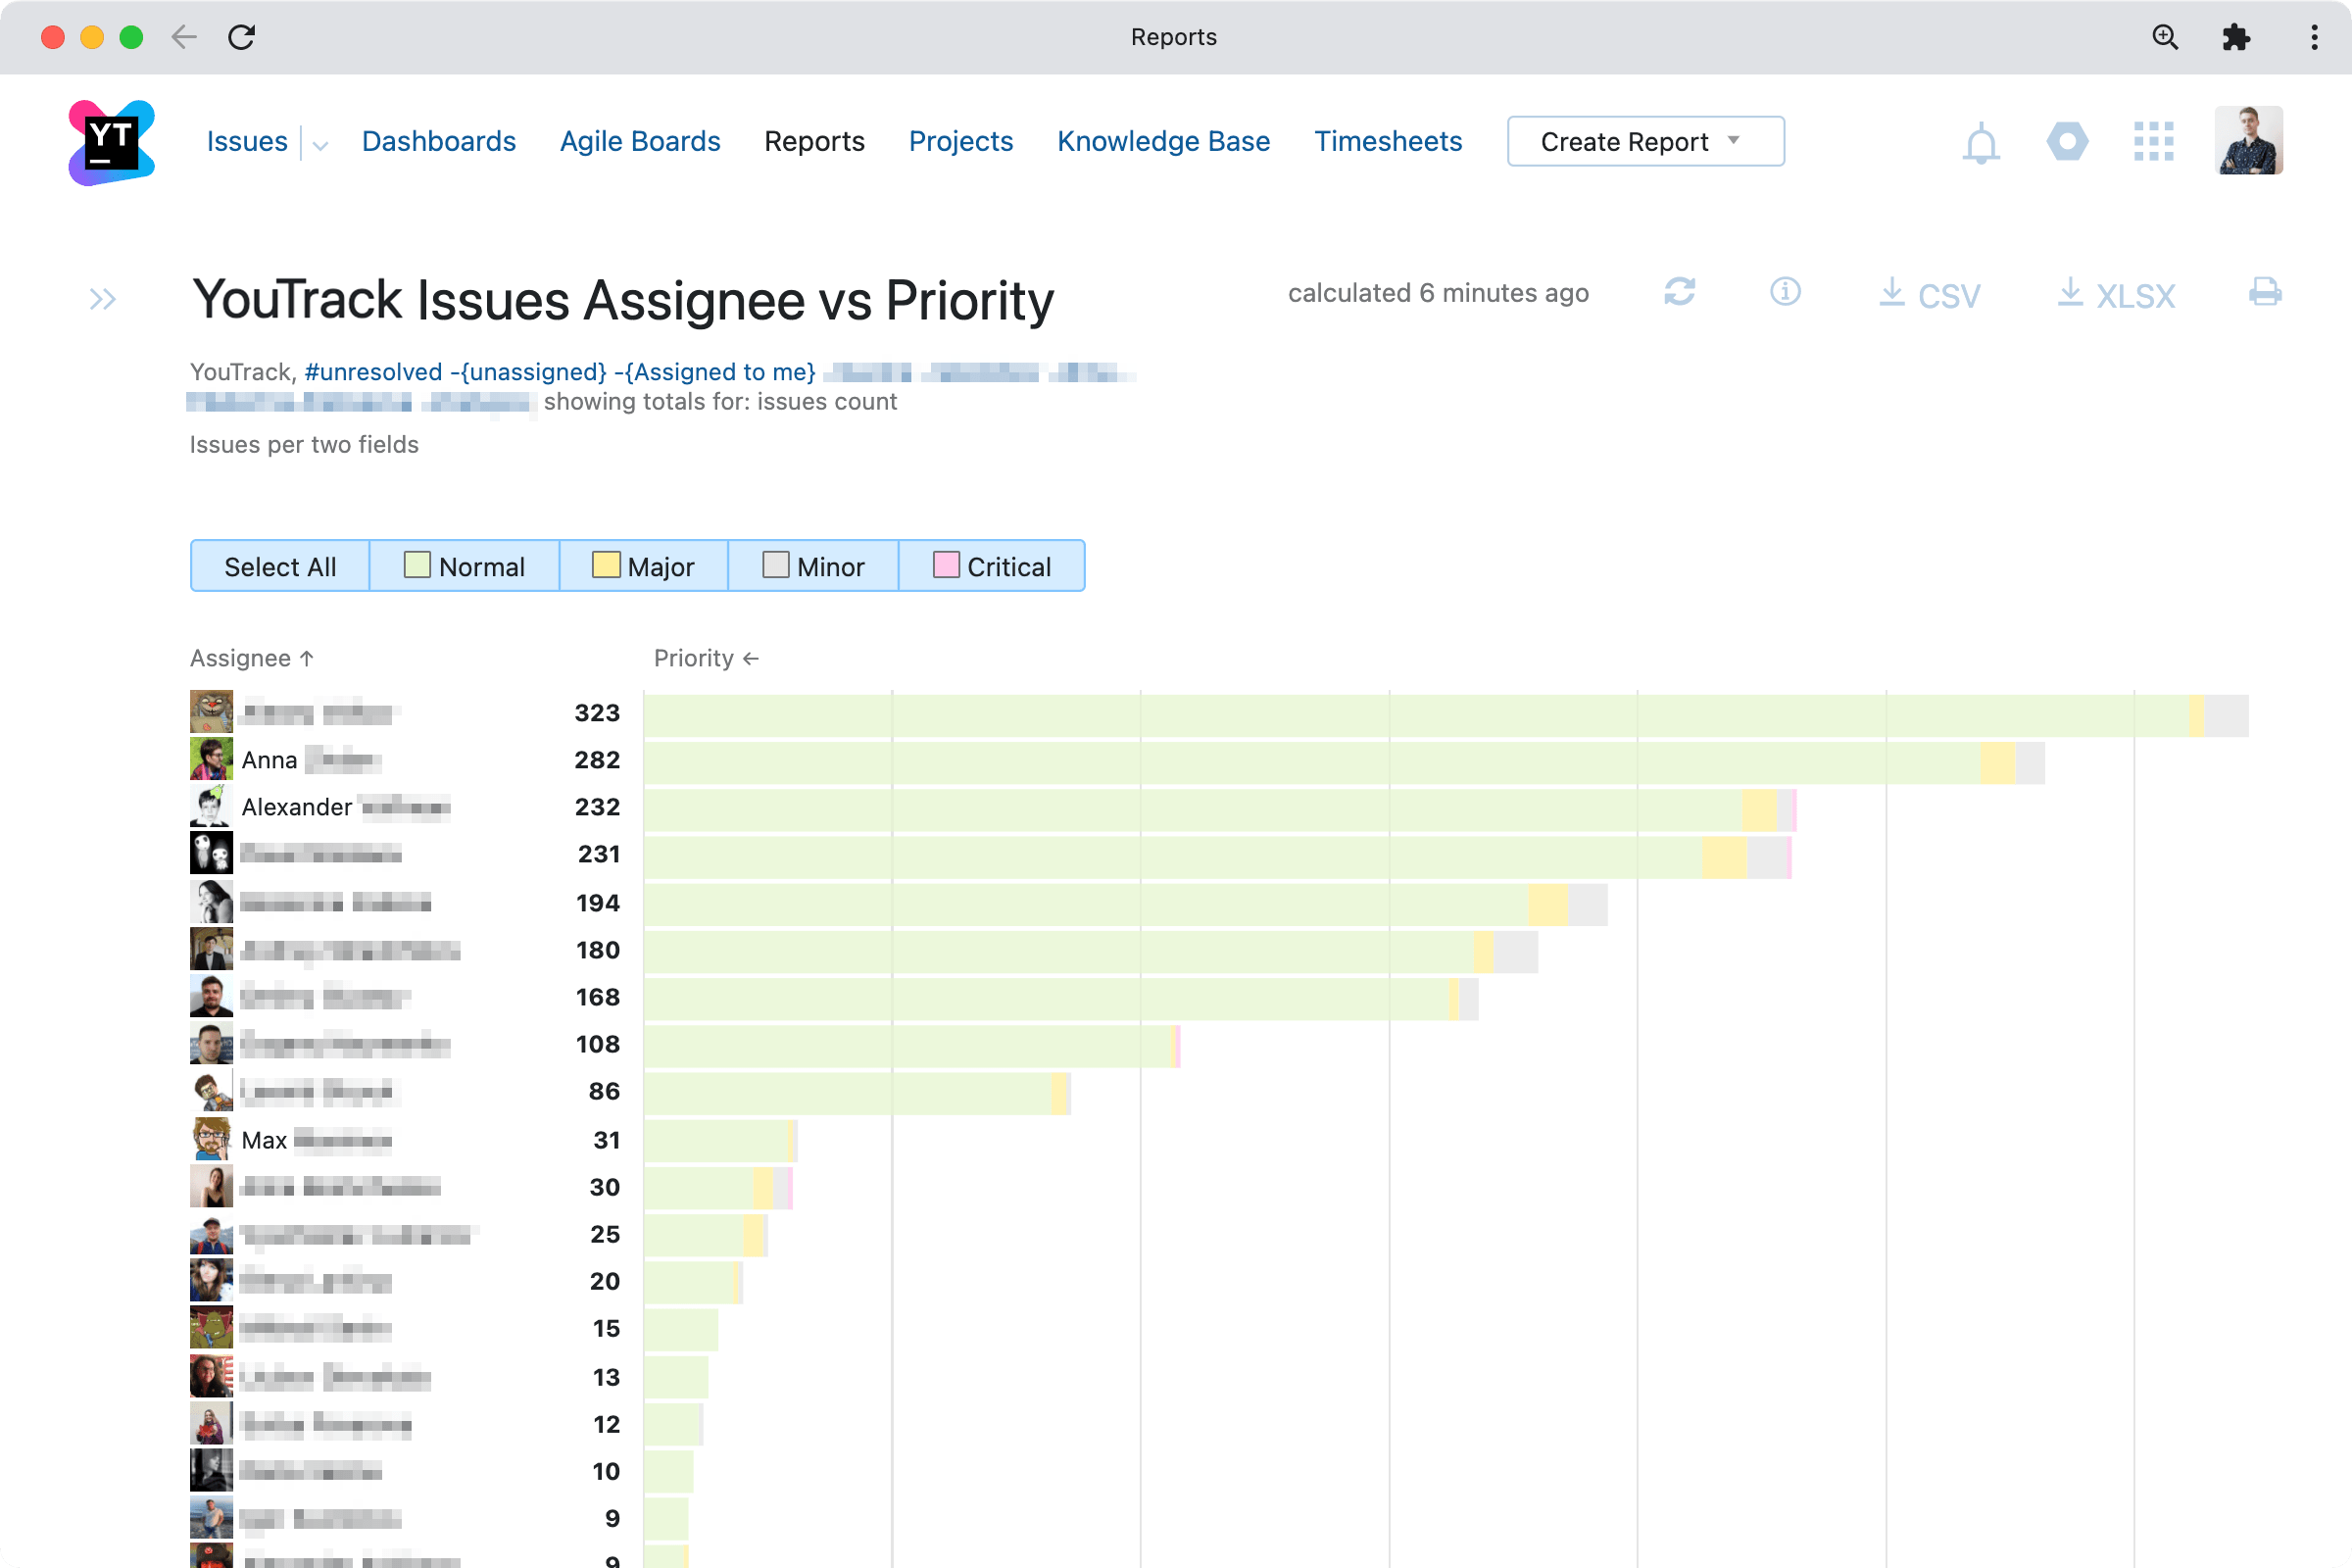
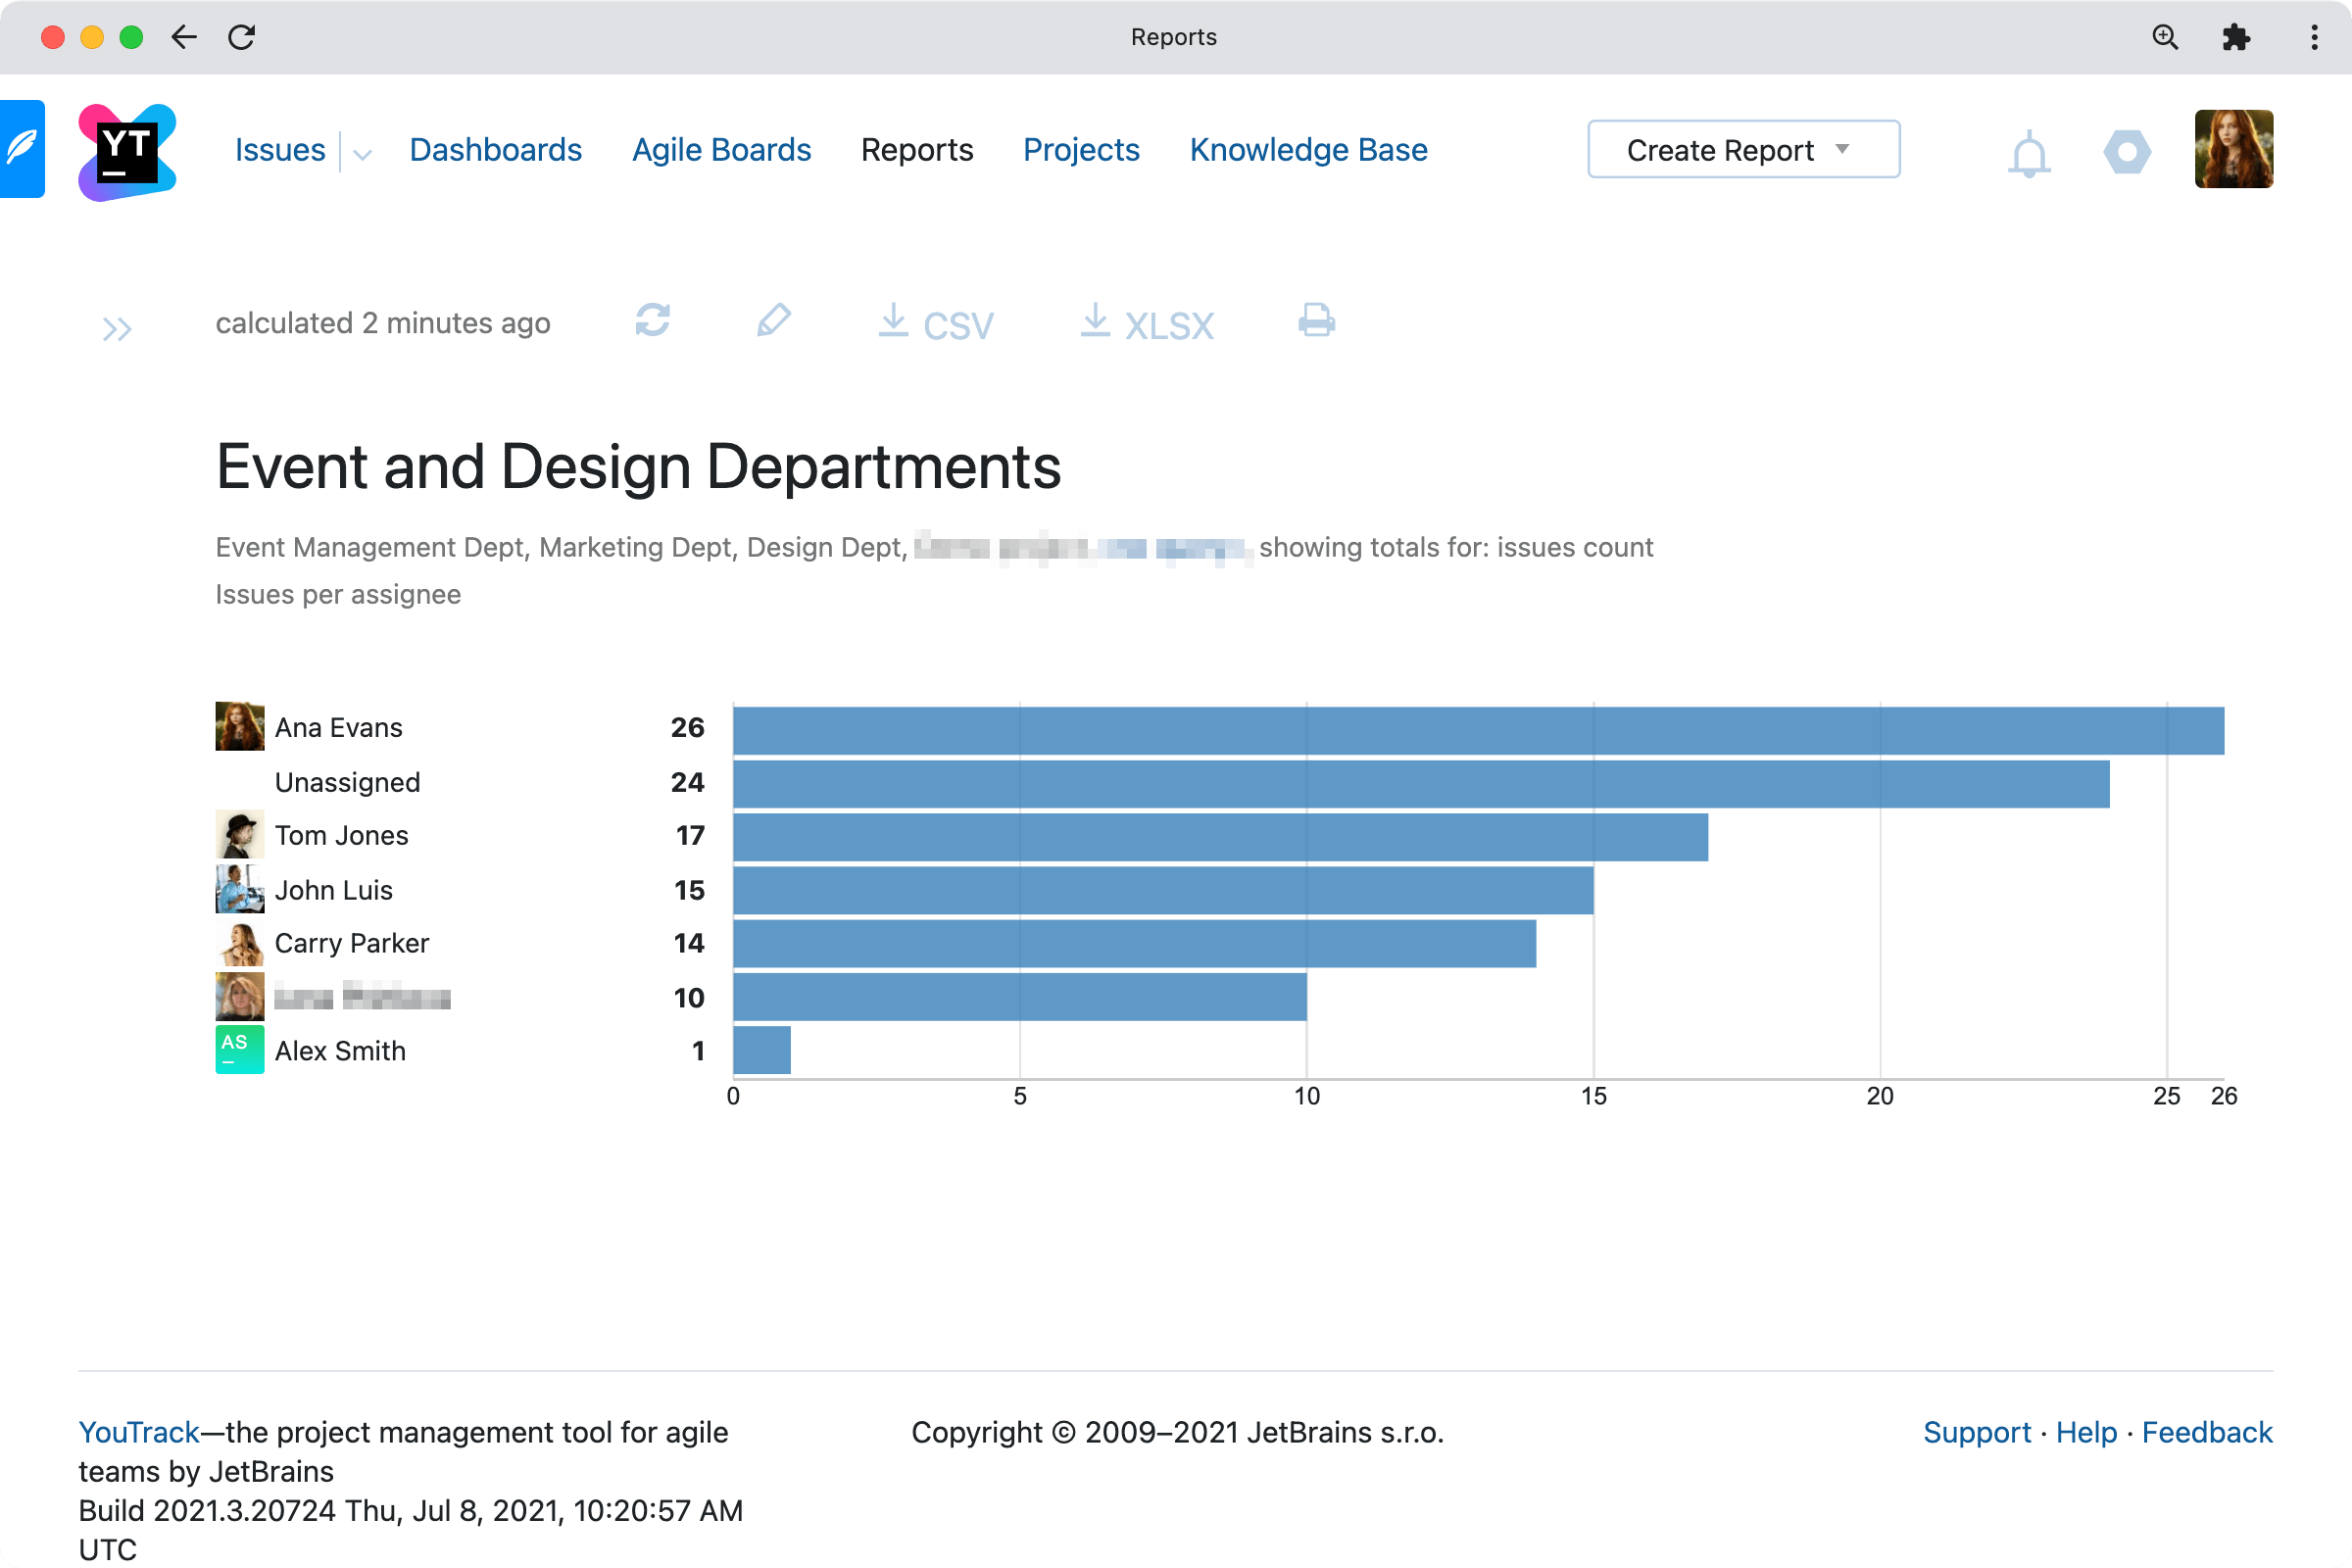
Issue distribution reports
View the distribution of tasks among assignees and across projects, and compare numbers of issues with different states, priorities, types, or any custom field values within one or more projects.
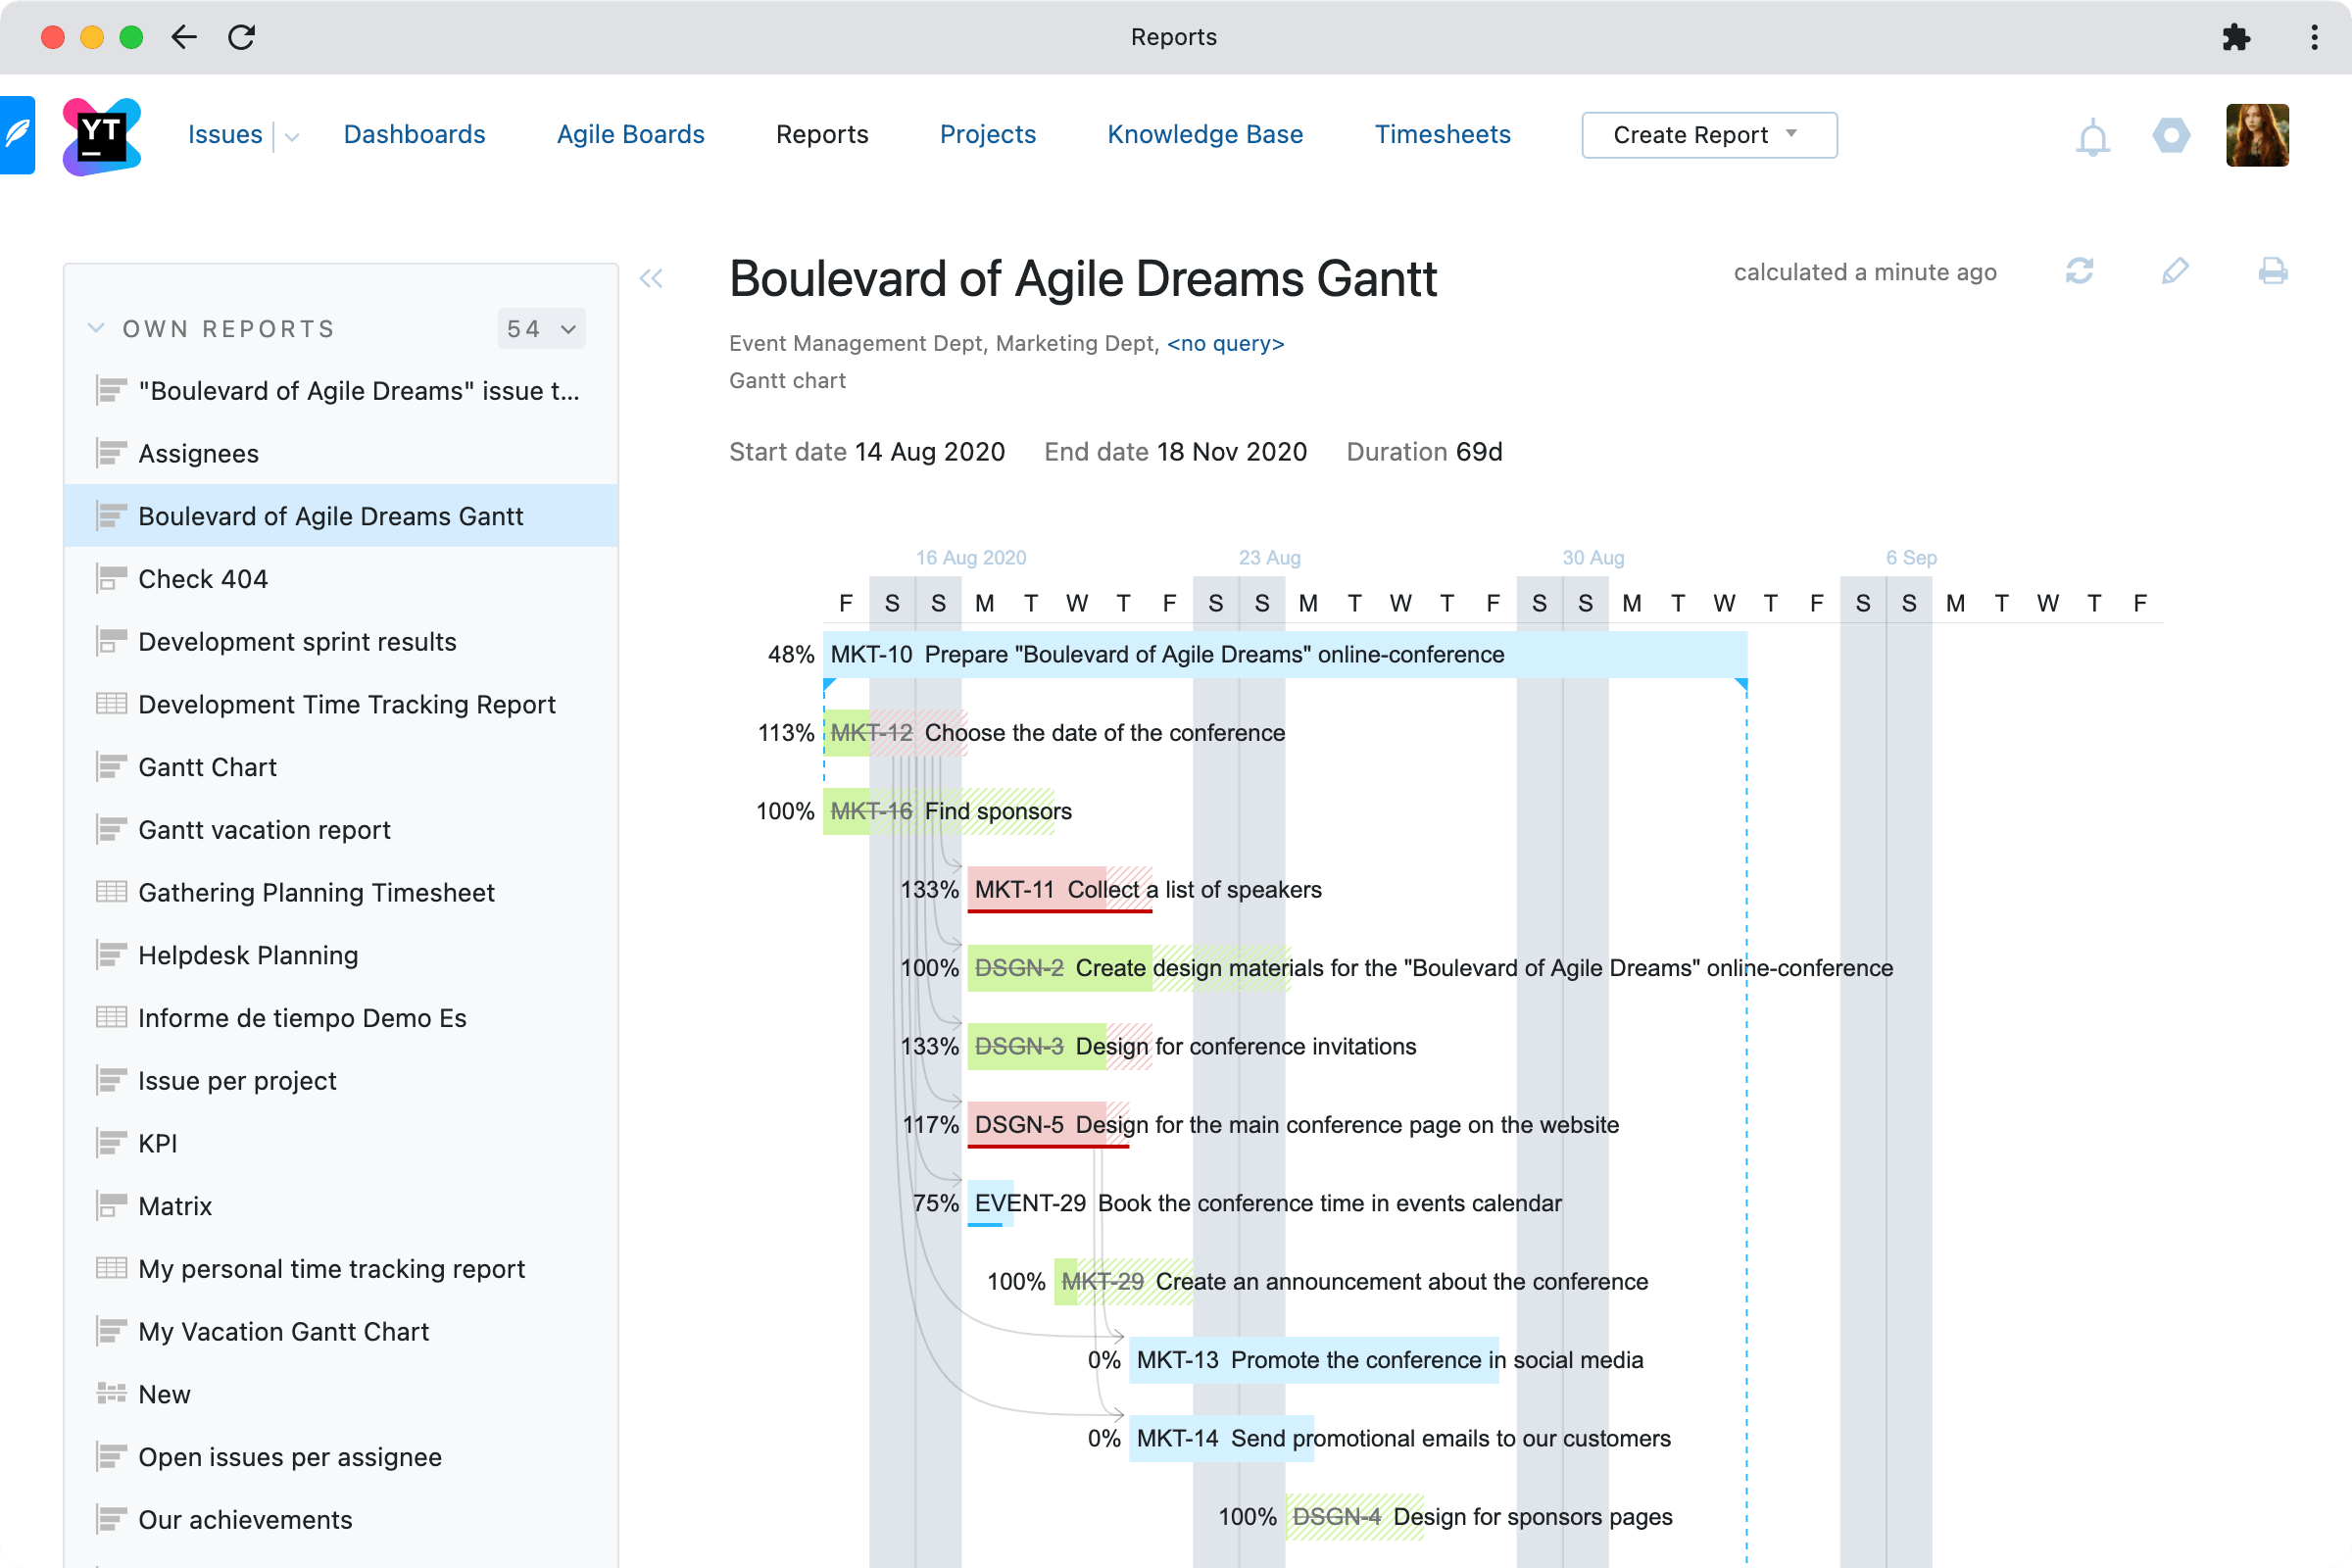
Timeline reports
View the progress and rate of change over a specified time period. This category includes the burndown and cumulative flow charts, as well as resolution time, average issue age, Gantt chart, and others.
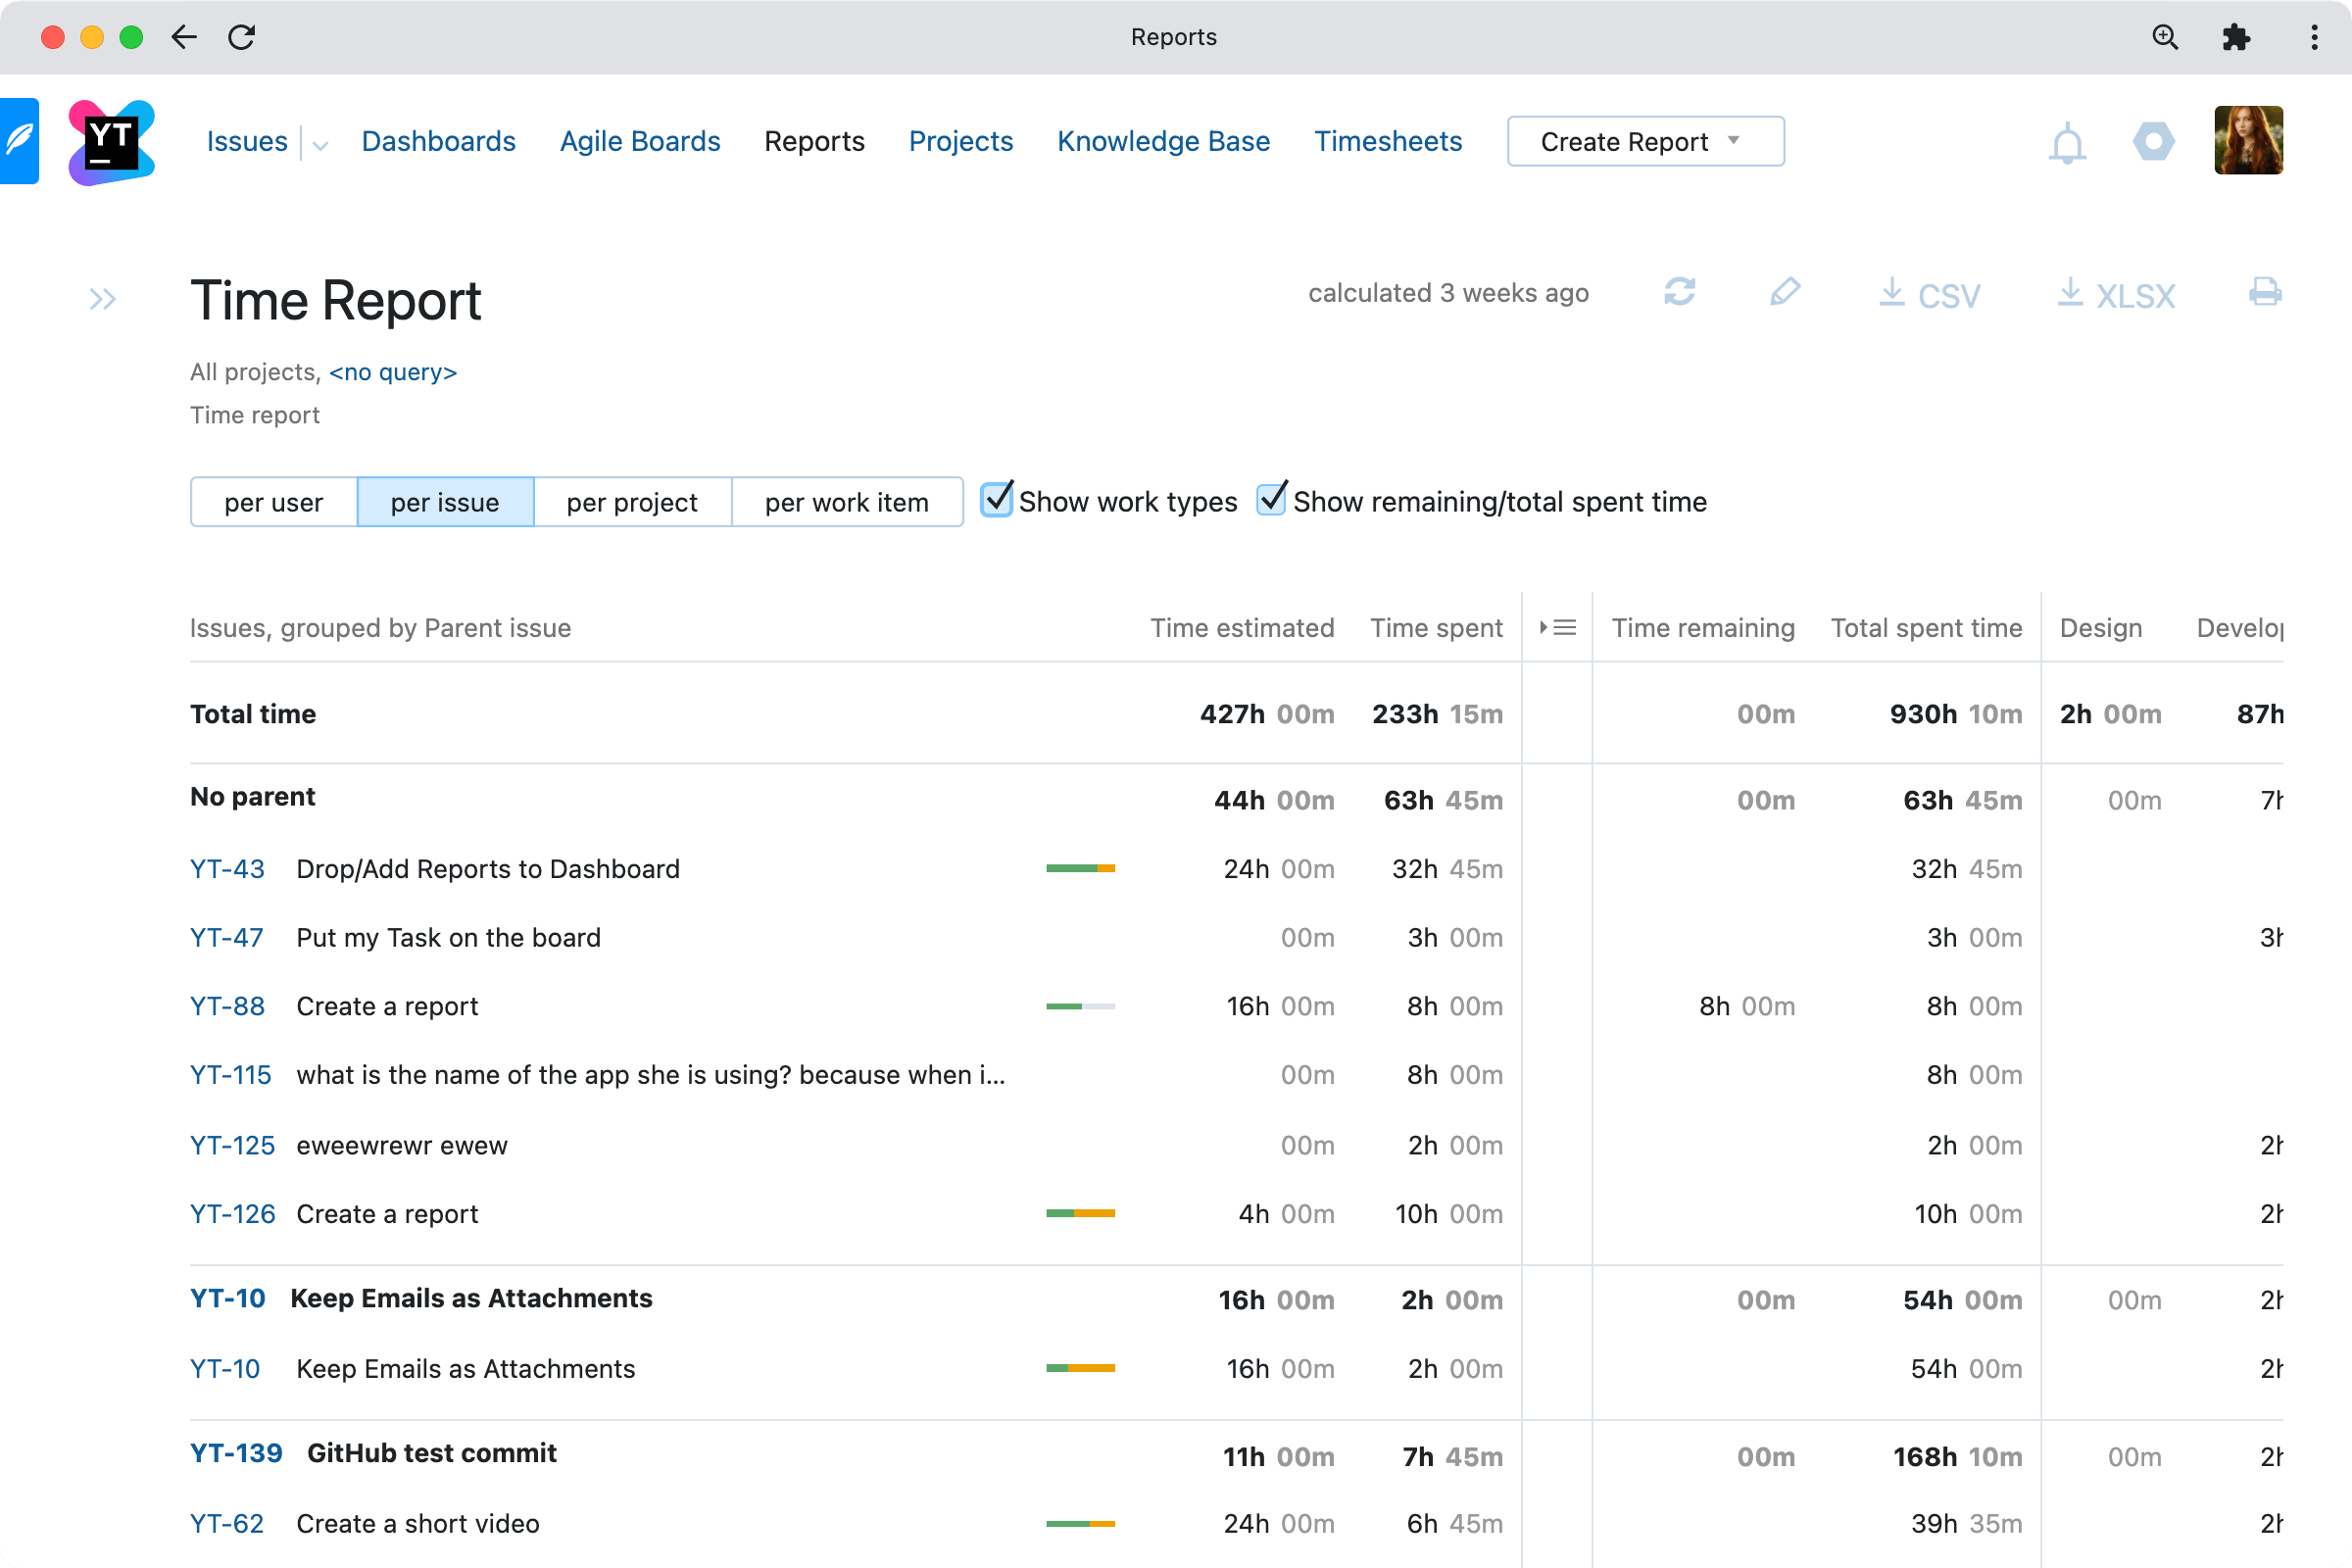
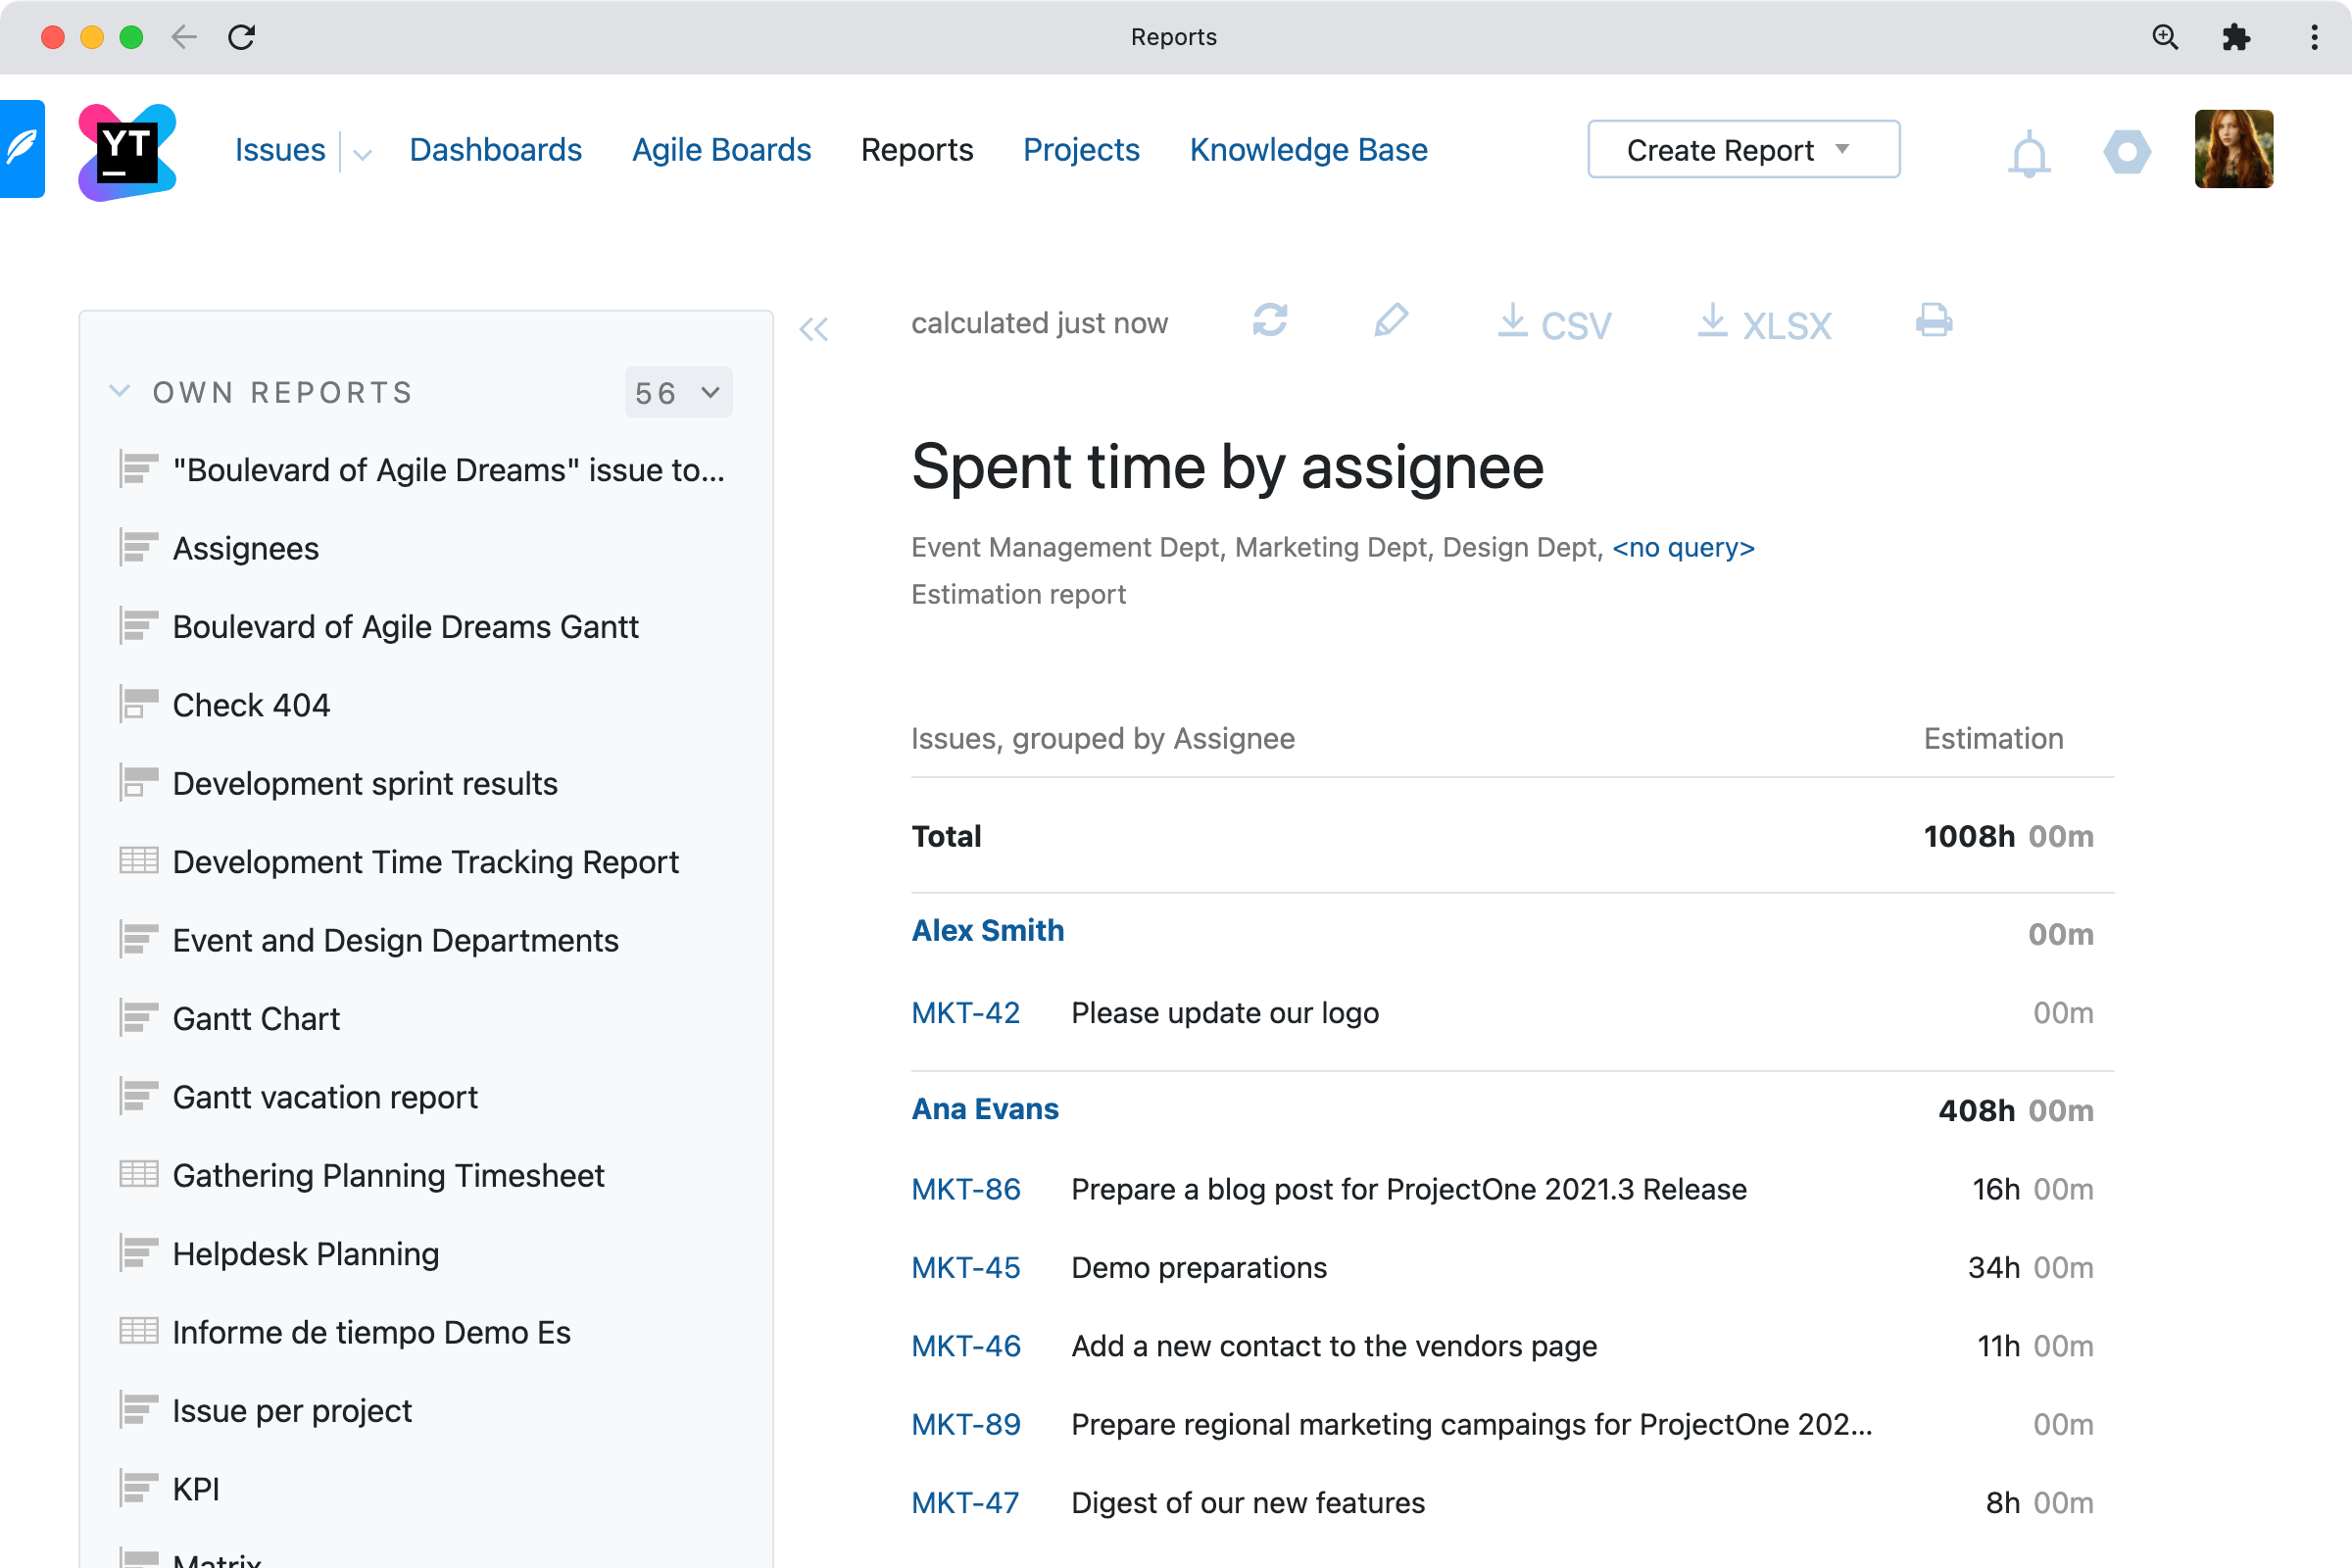
Time management reports
Time management reports provide a comparison of initial estimates against actual time spent. They can help pinpoint bottlenecks and highlight areas where attention is needed, and give a detailed breakdown of how time is spent on different types of tasks by different assignees.
Reports can be grouped by issue, user, or project, as well as by issue type (such as development tasks, tests, bugs, etc.).
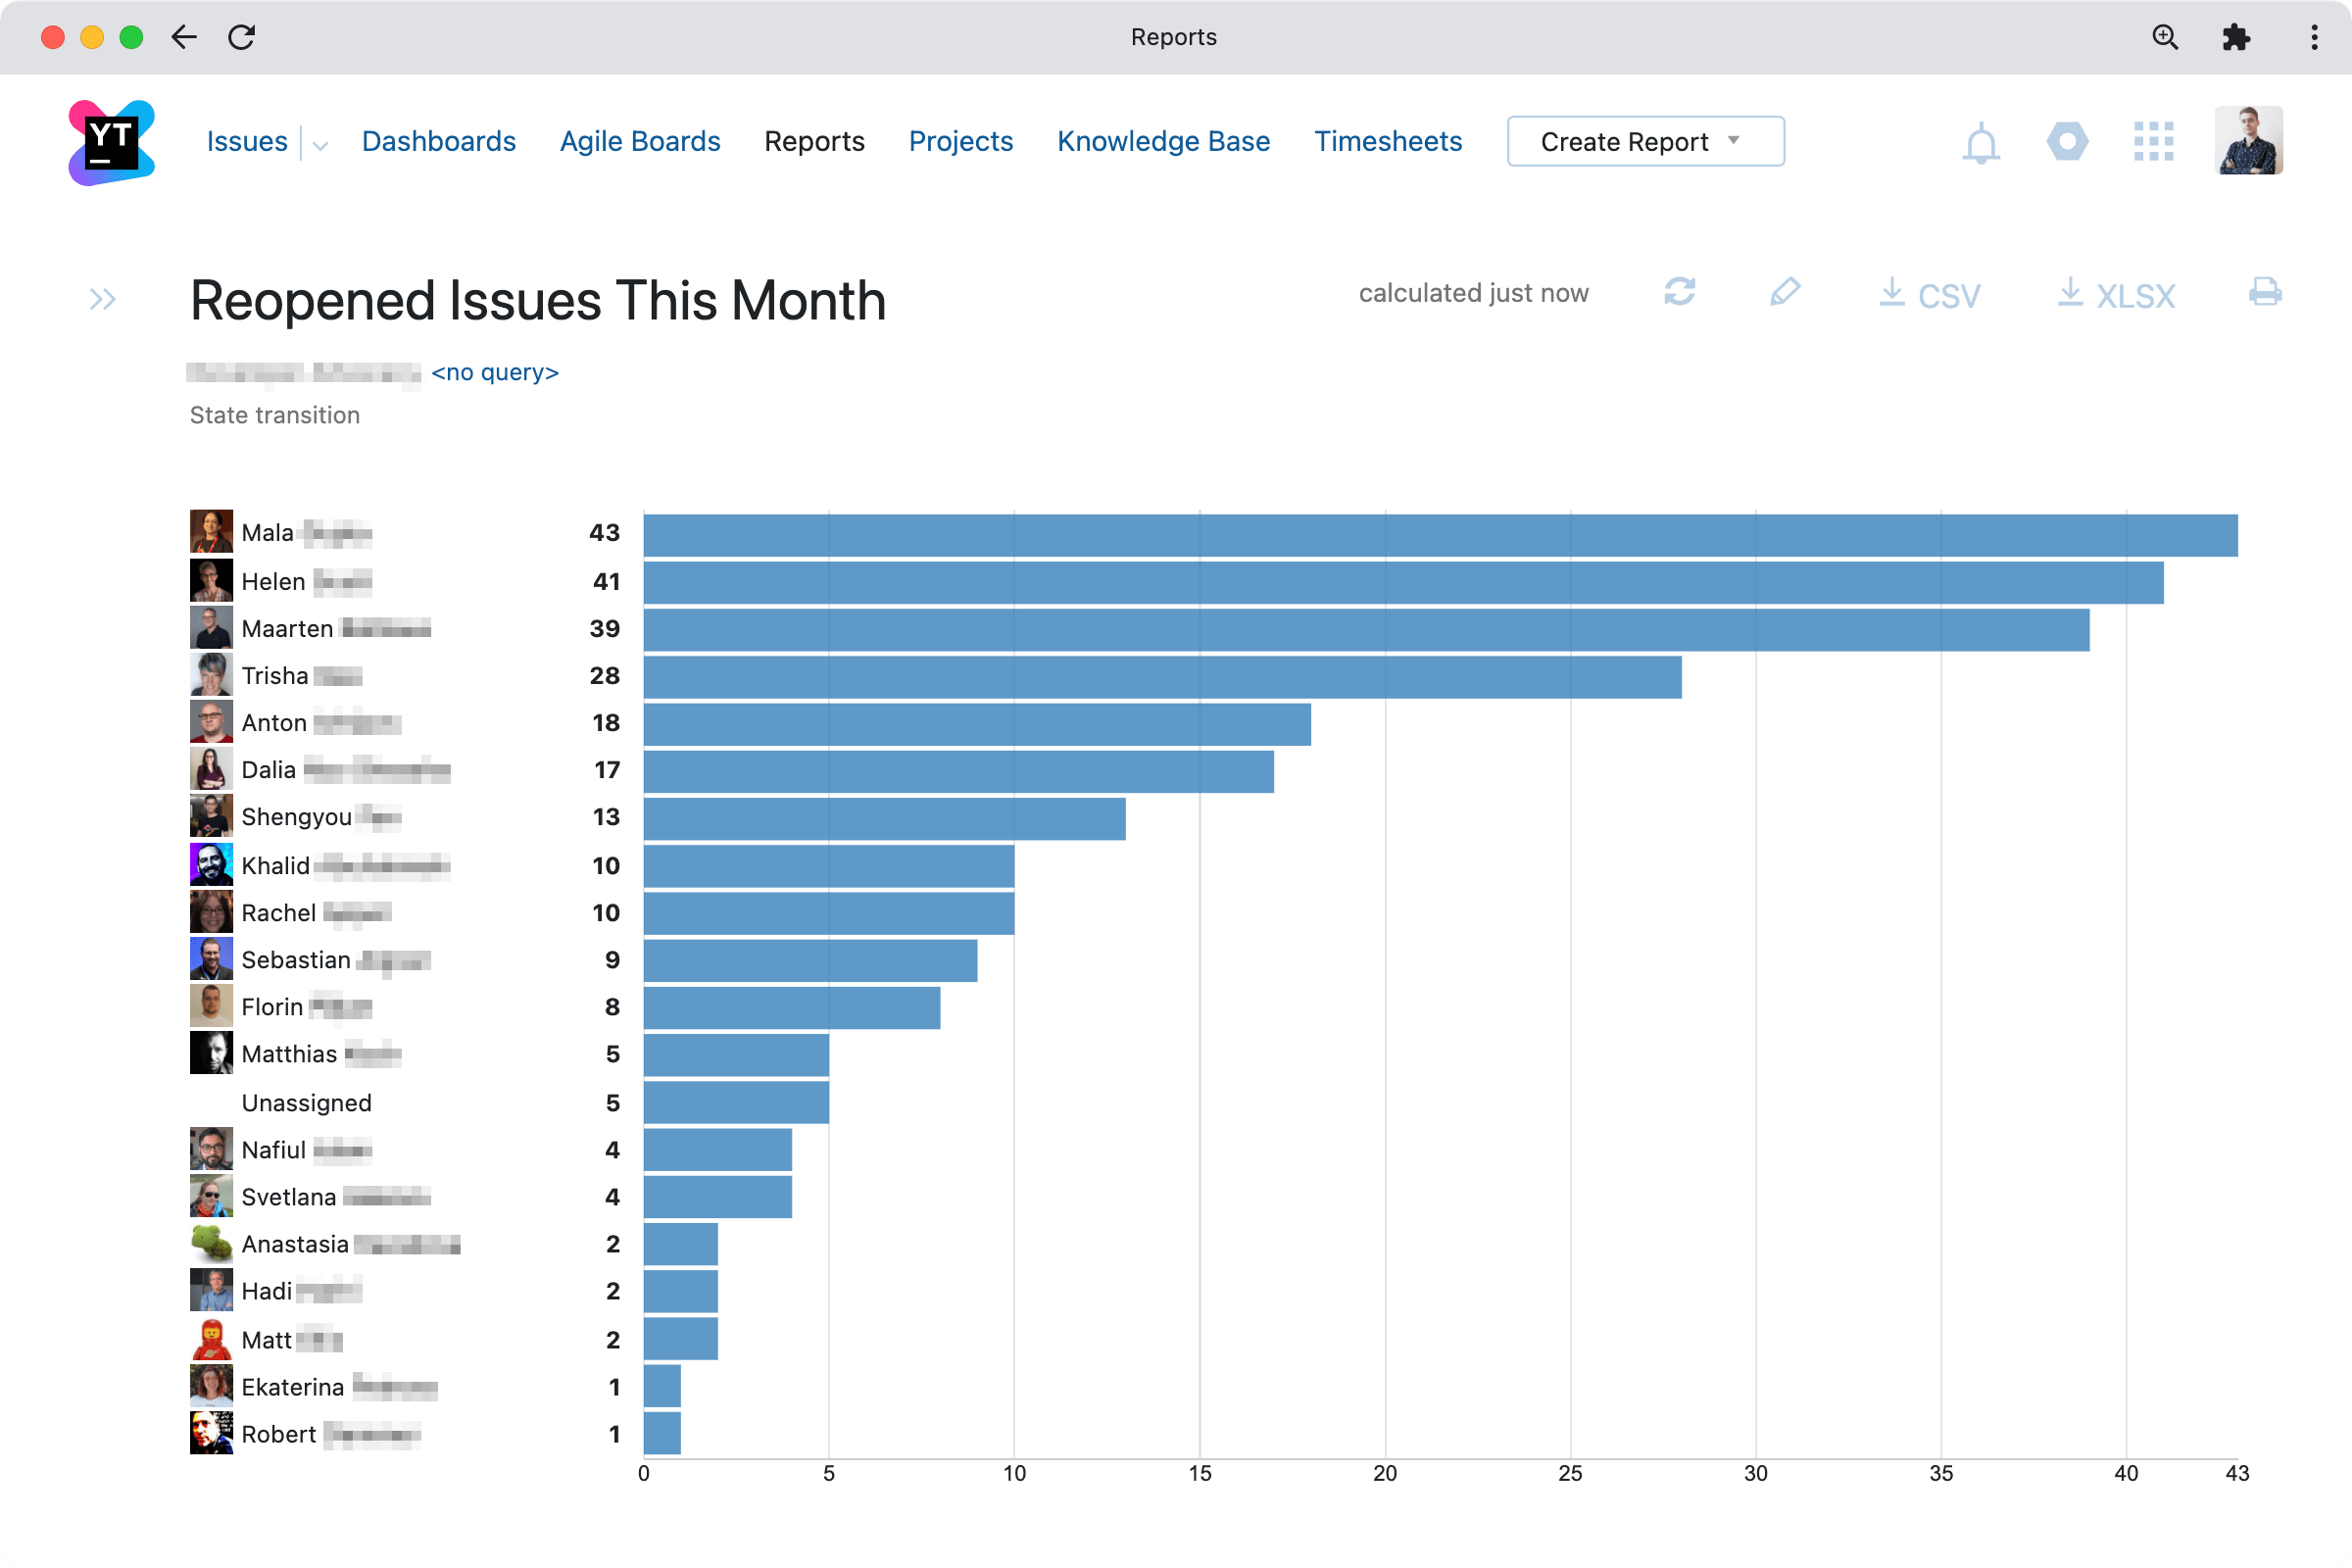
State transition reports
State transition reports show the number of issues that went through a particular workflow transition over a specified time period, grouped by a specified field.
This category includes two predefined transition reports (Verified and Reopened) and an advanced report that allows you to specify changes between any two workflow states, as well as changes between any two subsystems, priorities, or types.
Timesheets
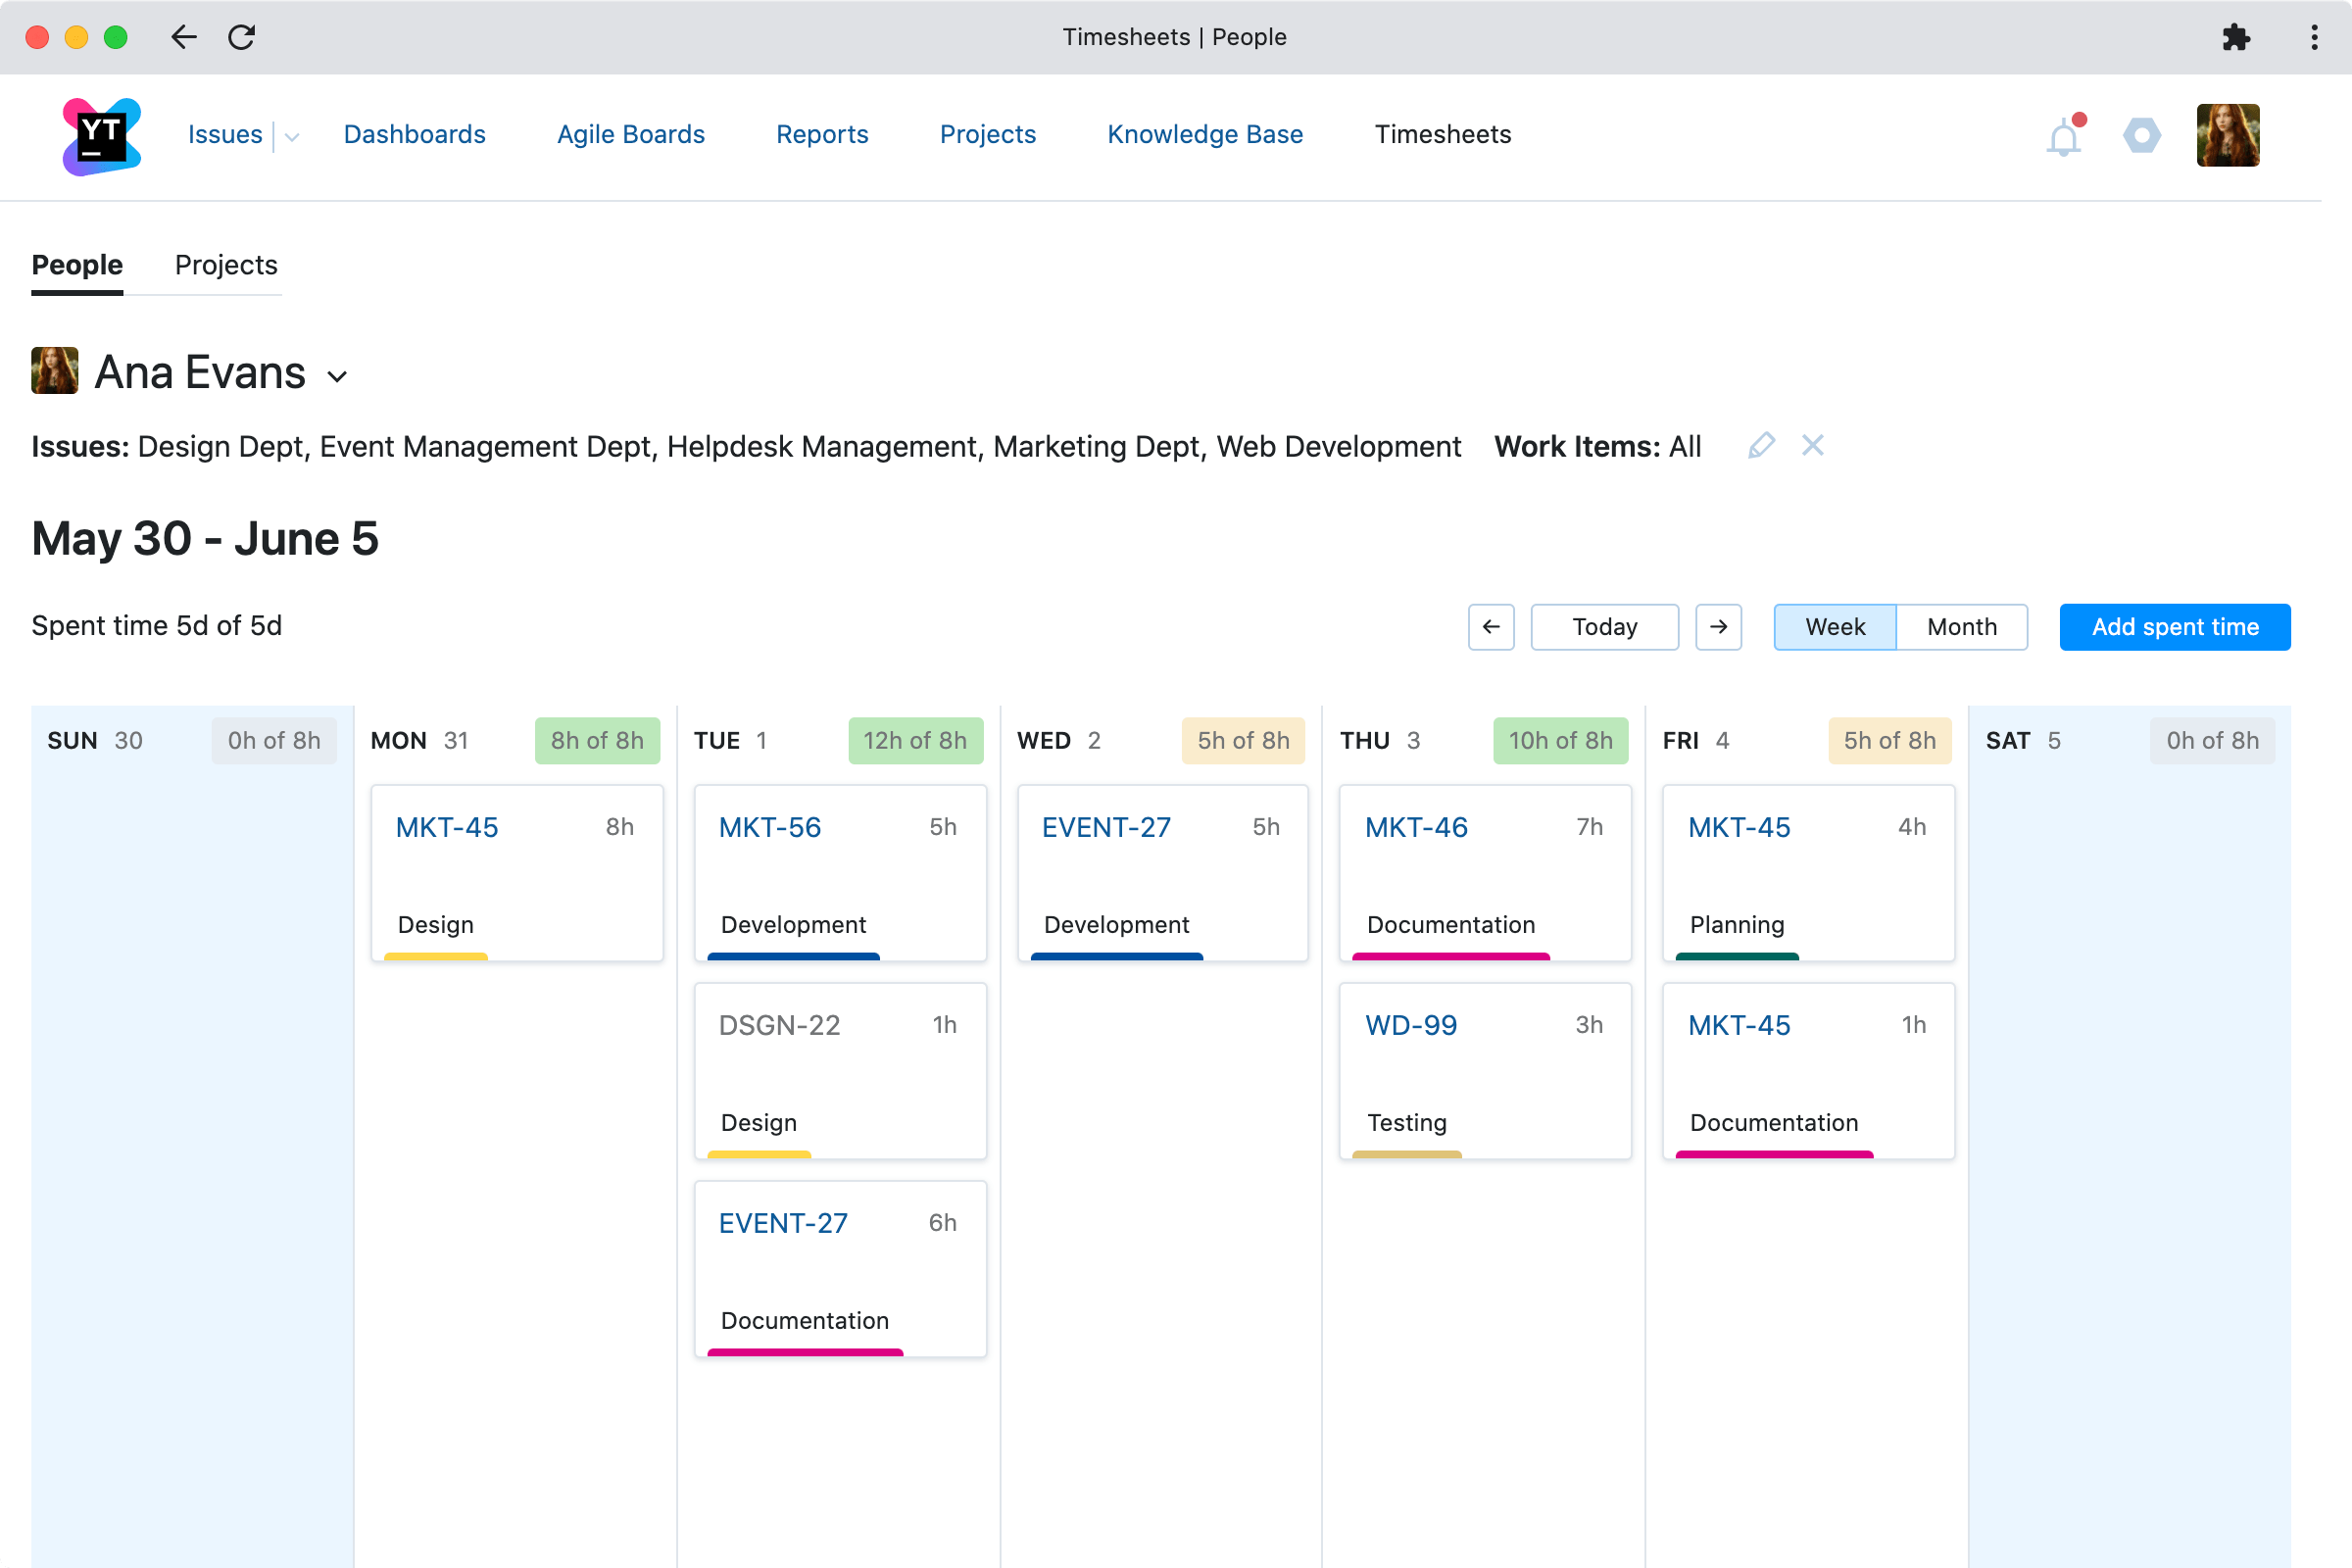
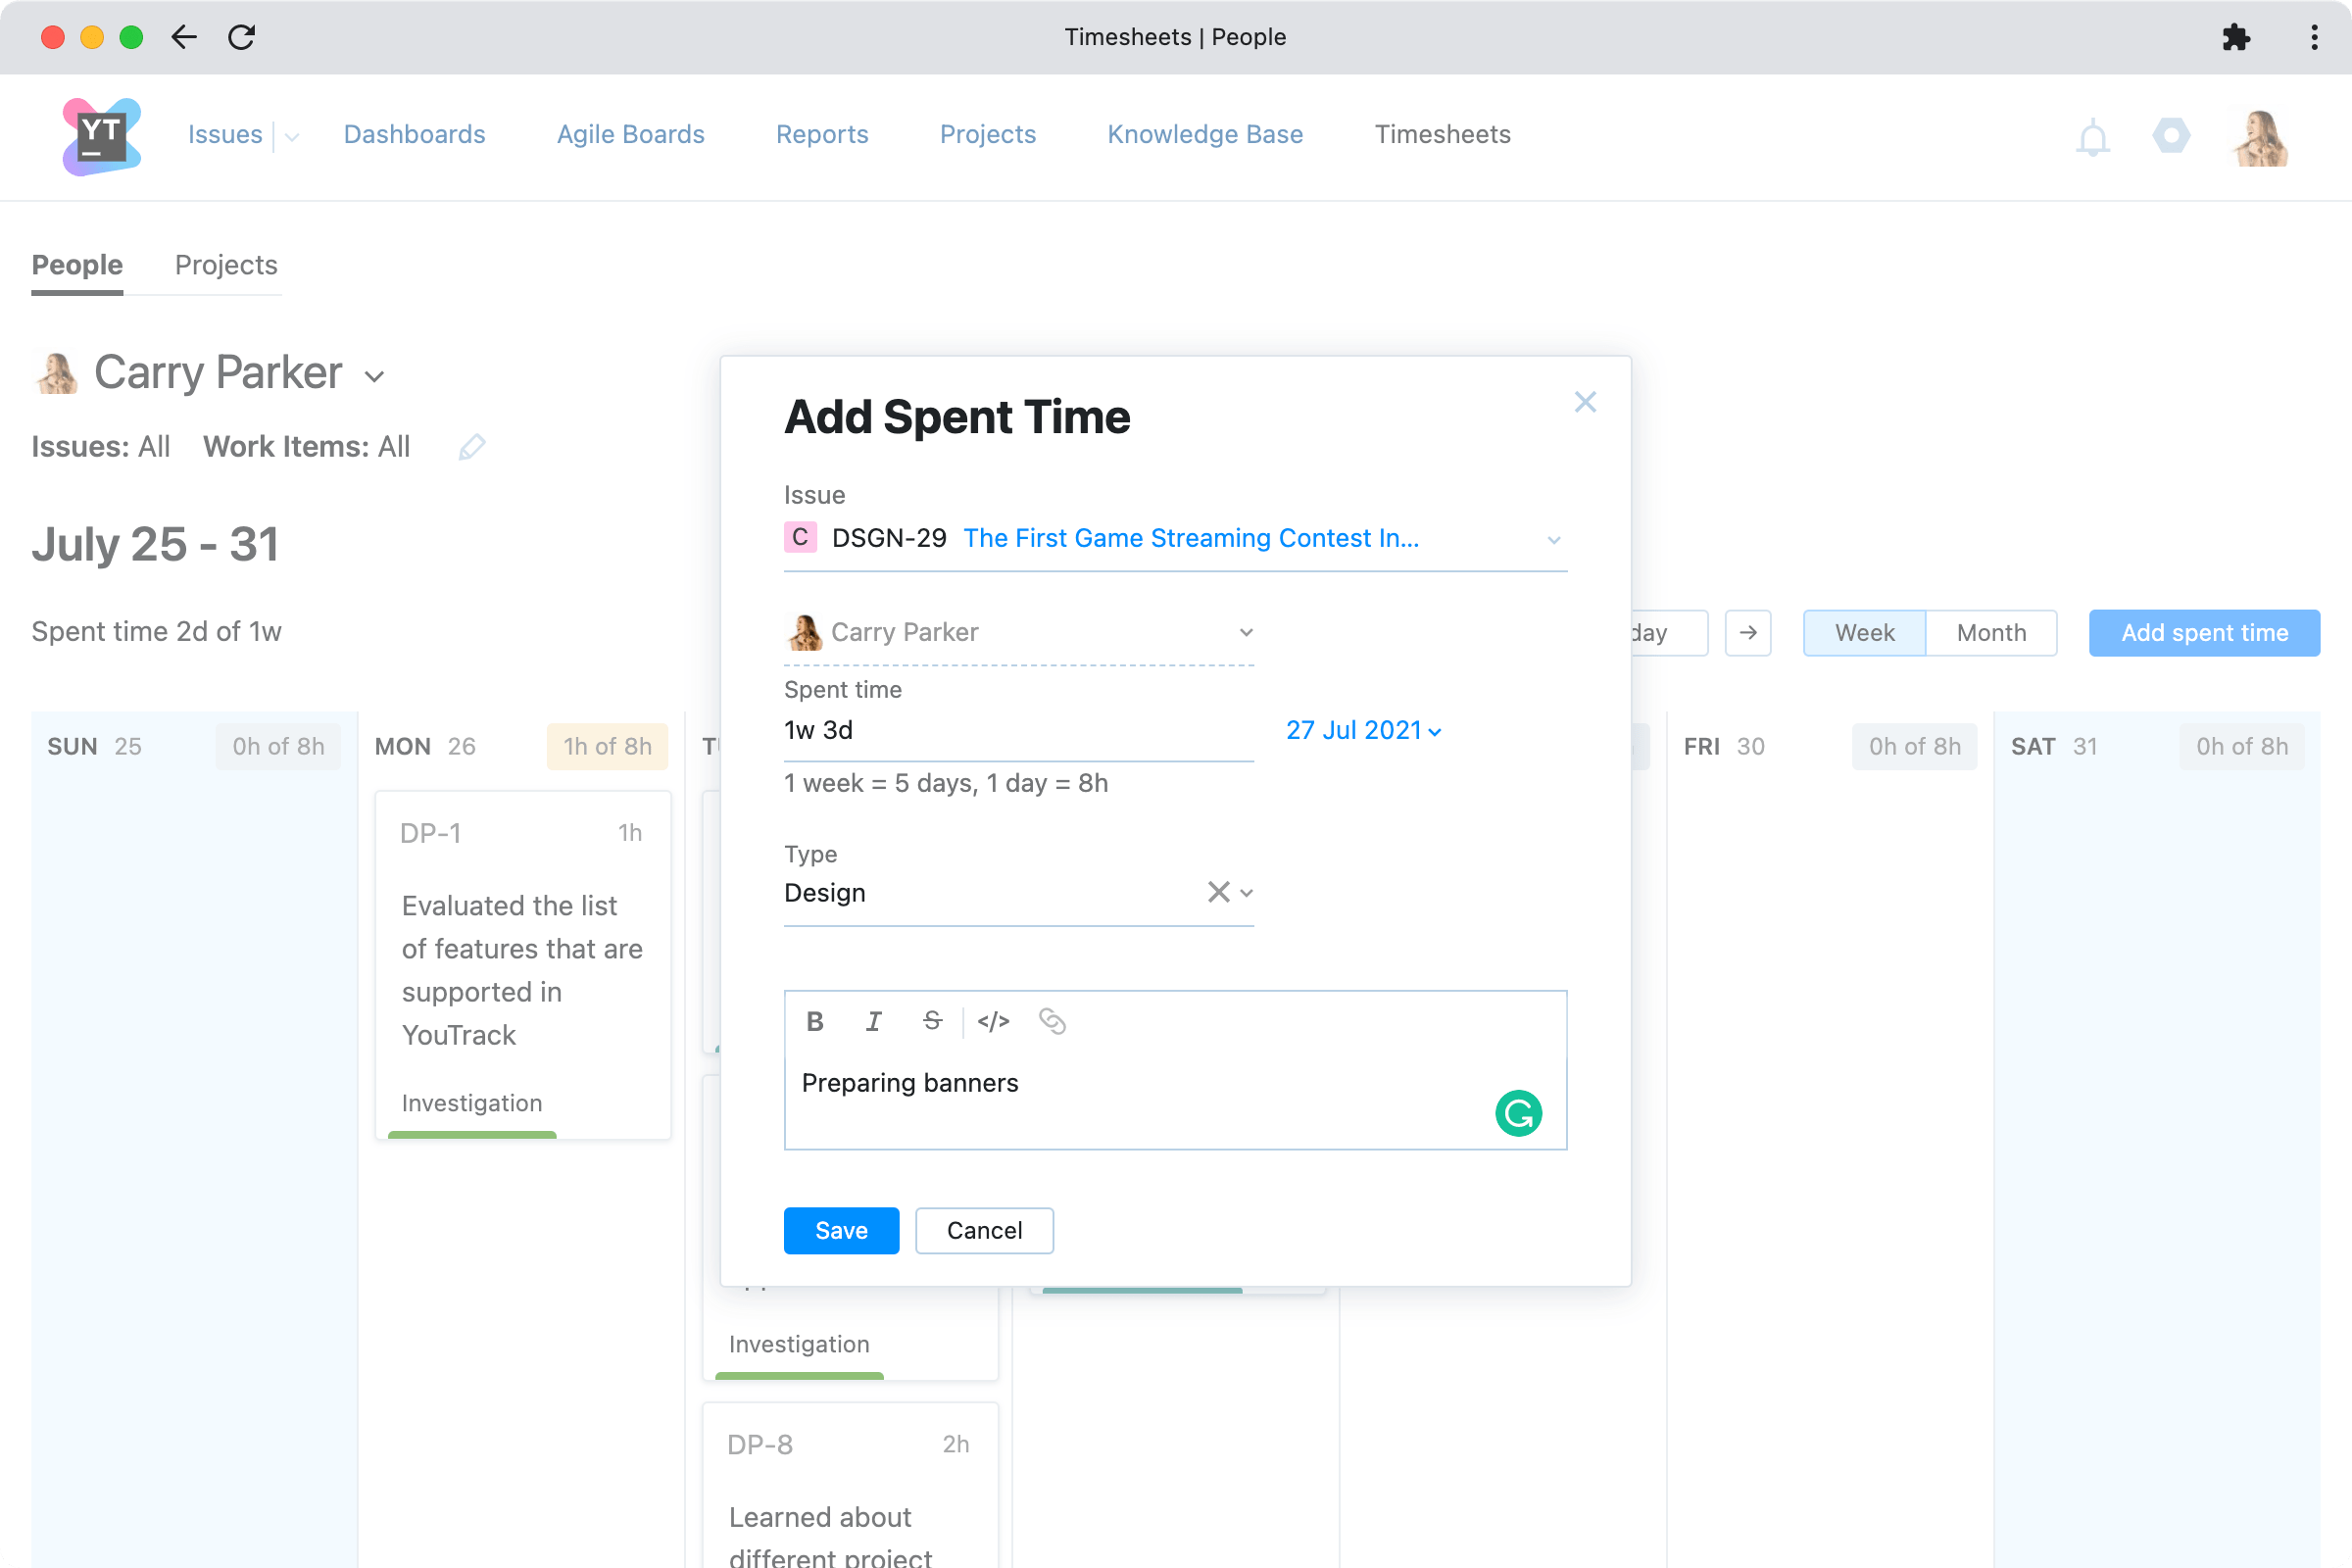
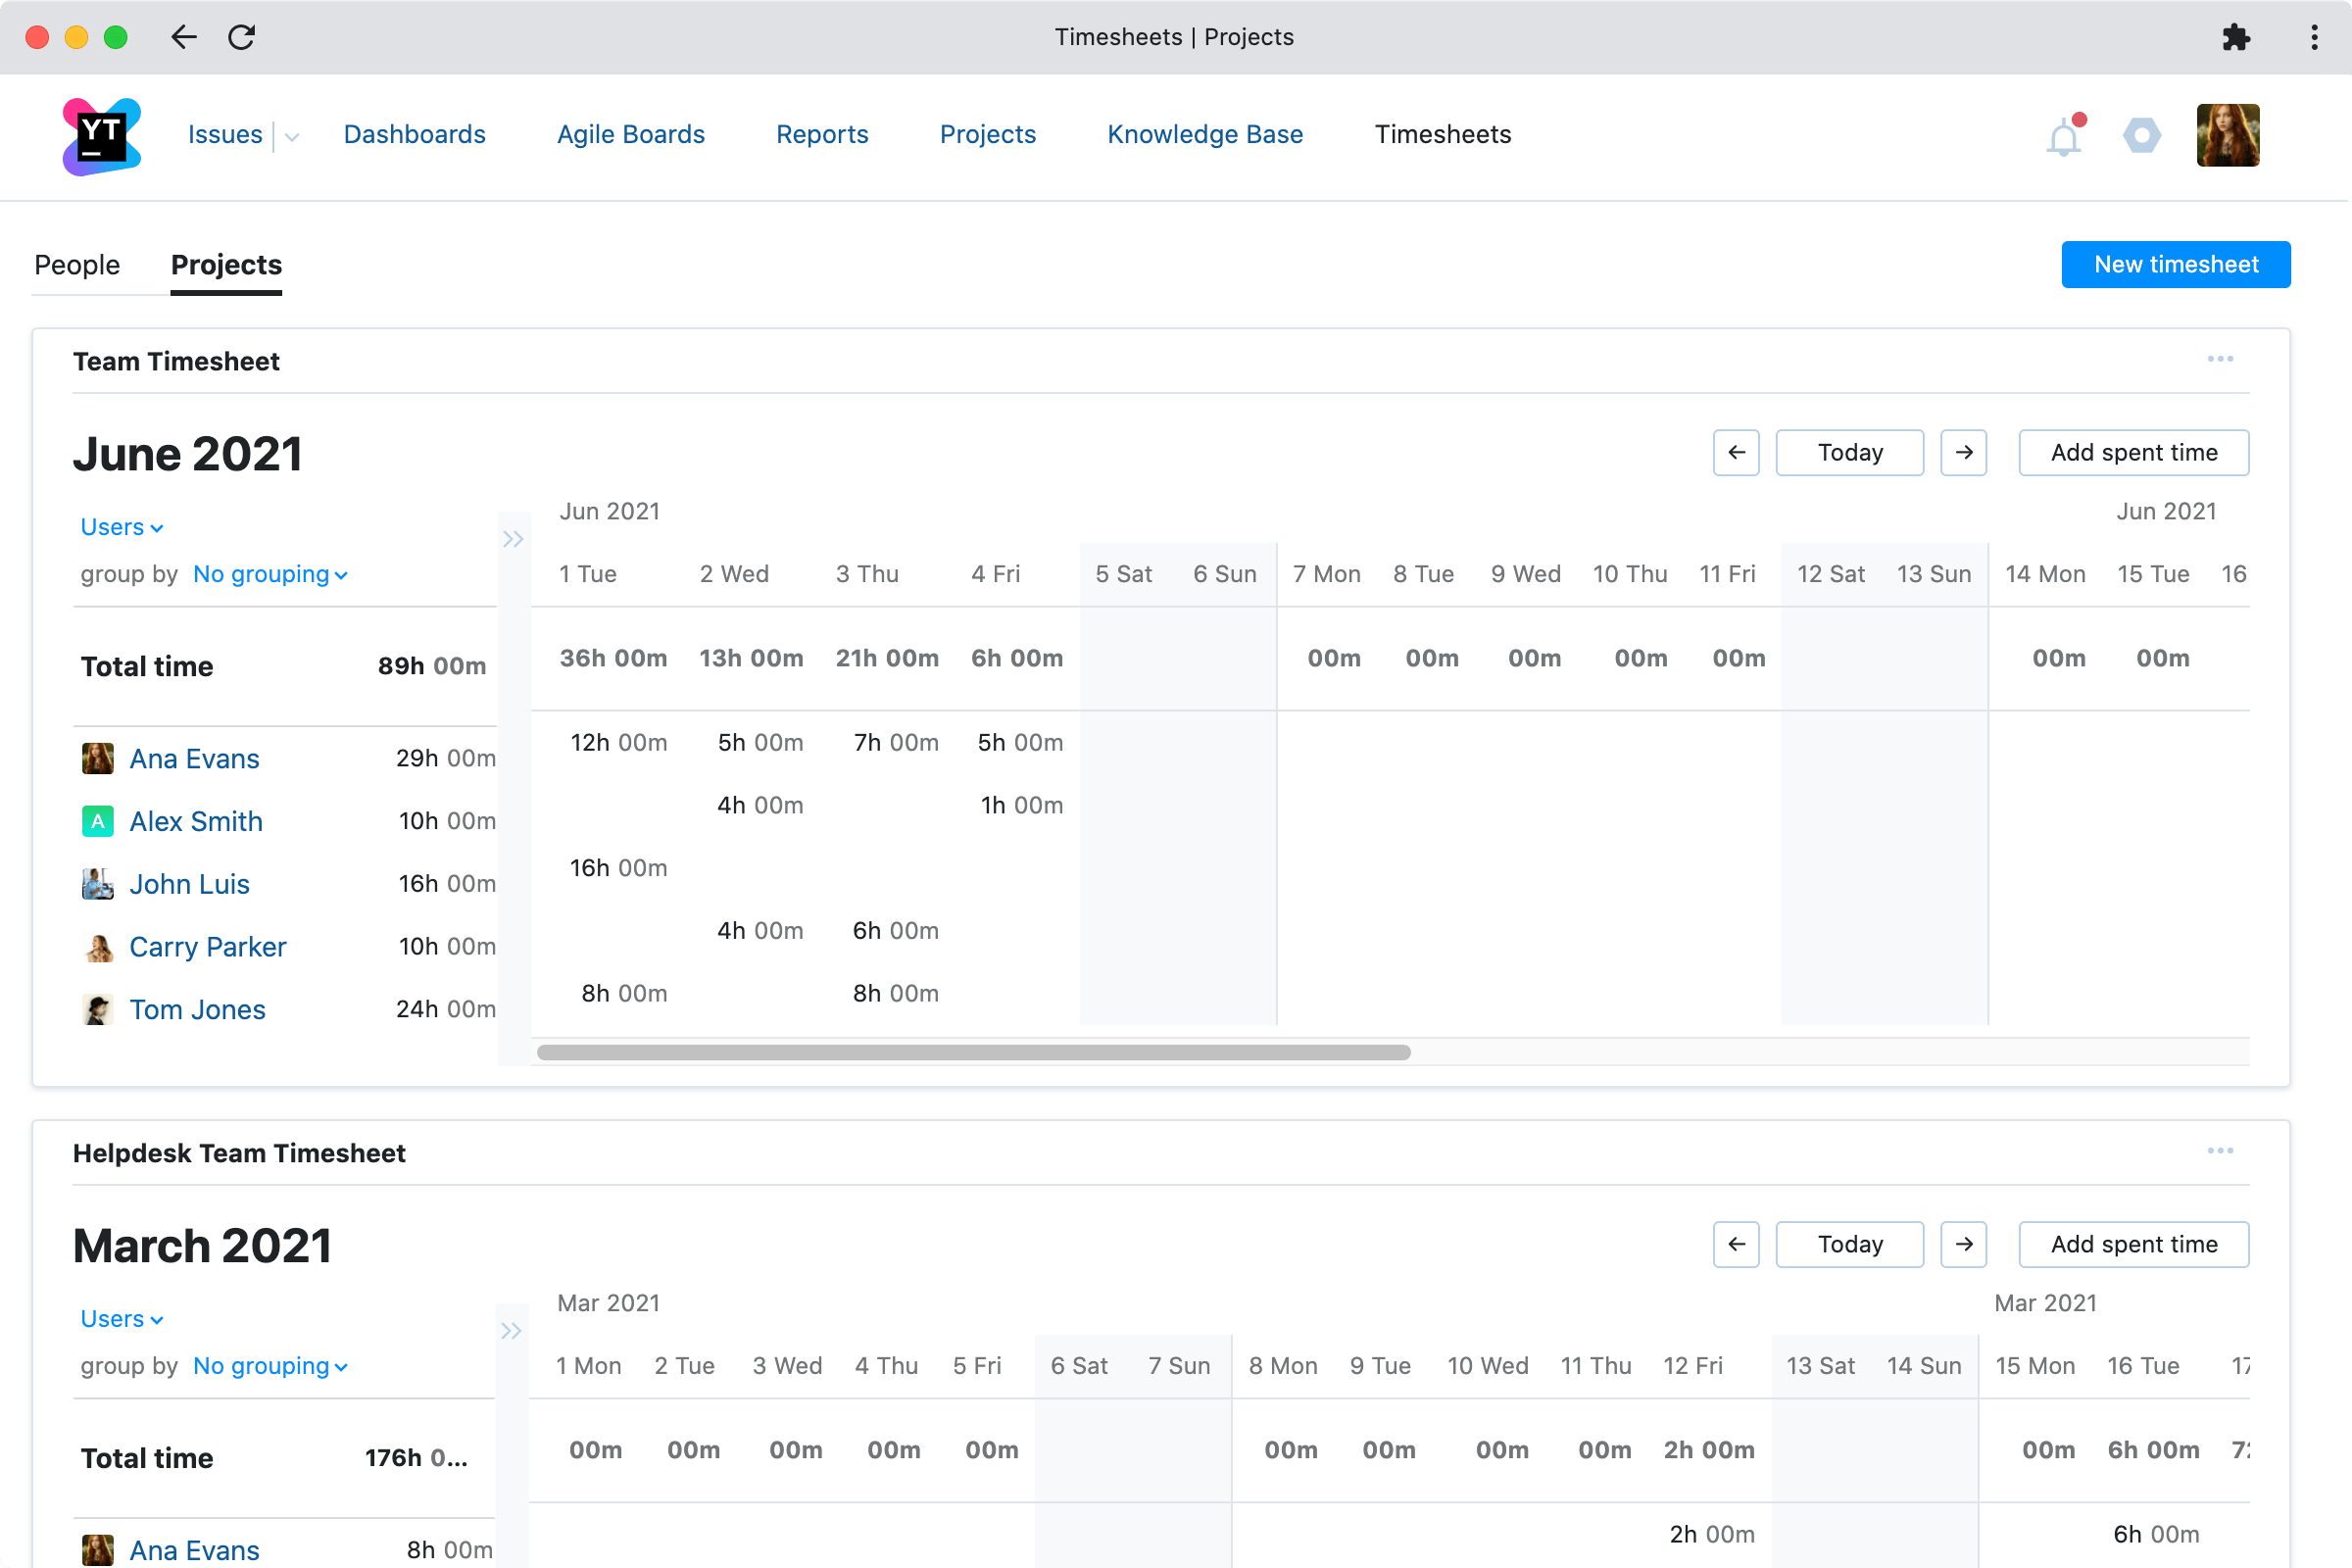
Timesheets are data tables that you can use to track work activity for yourself and other members of your team. Using timesheets can help you record the amount of time spent working on specific projects or for different clients. You can also track and measure different activities by the type of work performed.
Configuration and other features
Automatic report recalculation
Most reports are automatically recalculated and refreshed every 10 minutes. Some Timeline and State transition reports allow you to choose from predefined recalculation intervals. All reports can be manually recalculated at any time.
Sharing reports
When you create a report, its visibility is initially limited to you only. You can choose to share a report with individual users, groups and teams, or all users. You can also allow other users to edit the reports that you create.
Shared reports are listed in the left panel in the Reports page. Users can hide or show shared reports.
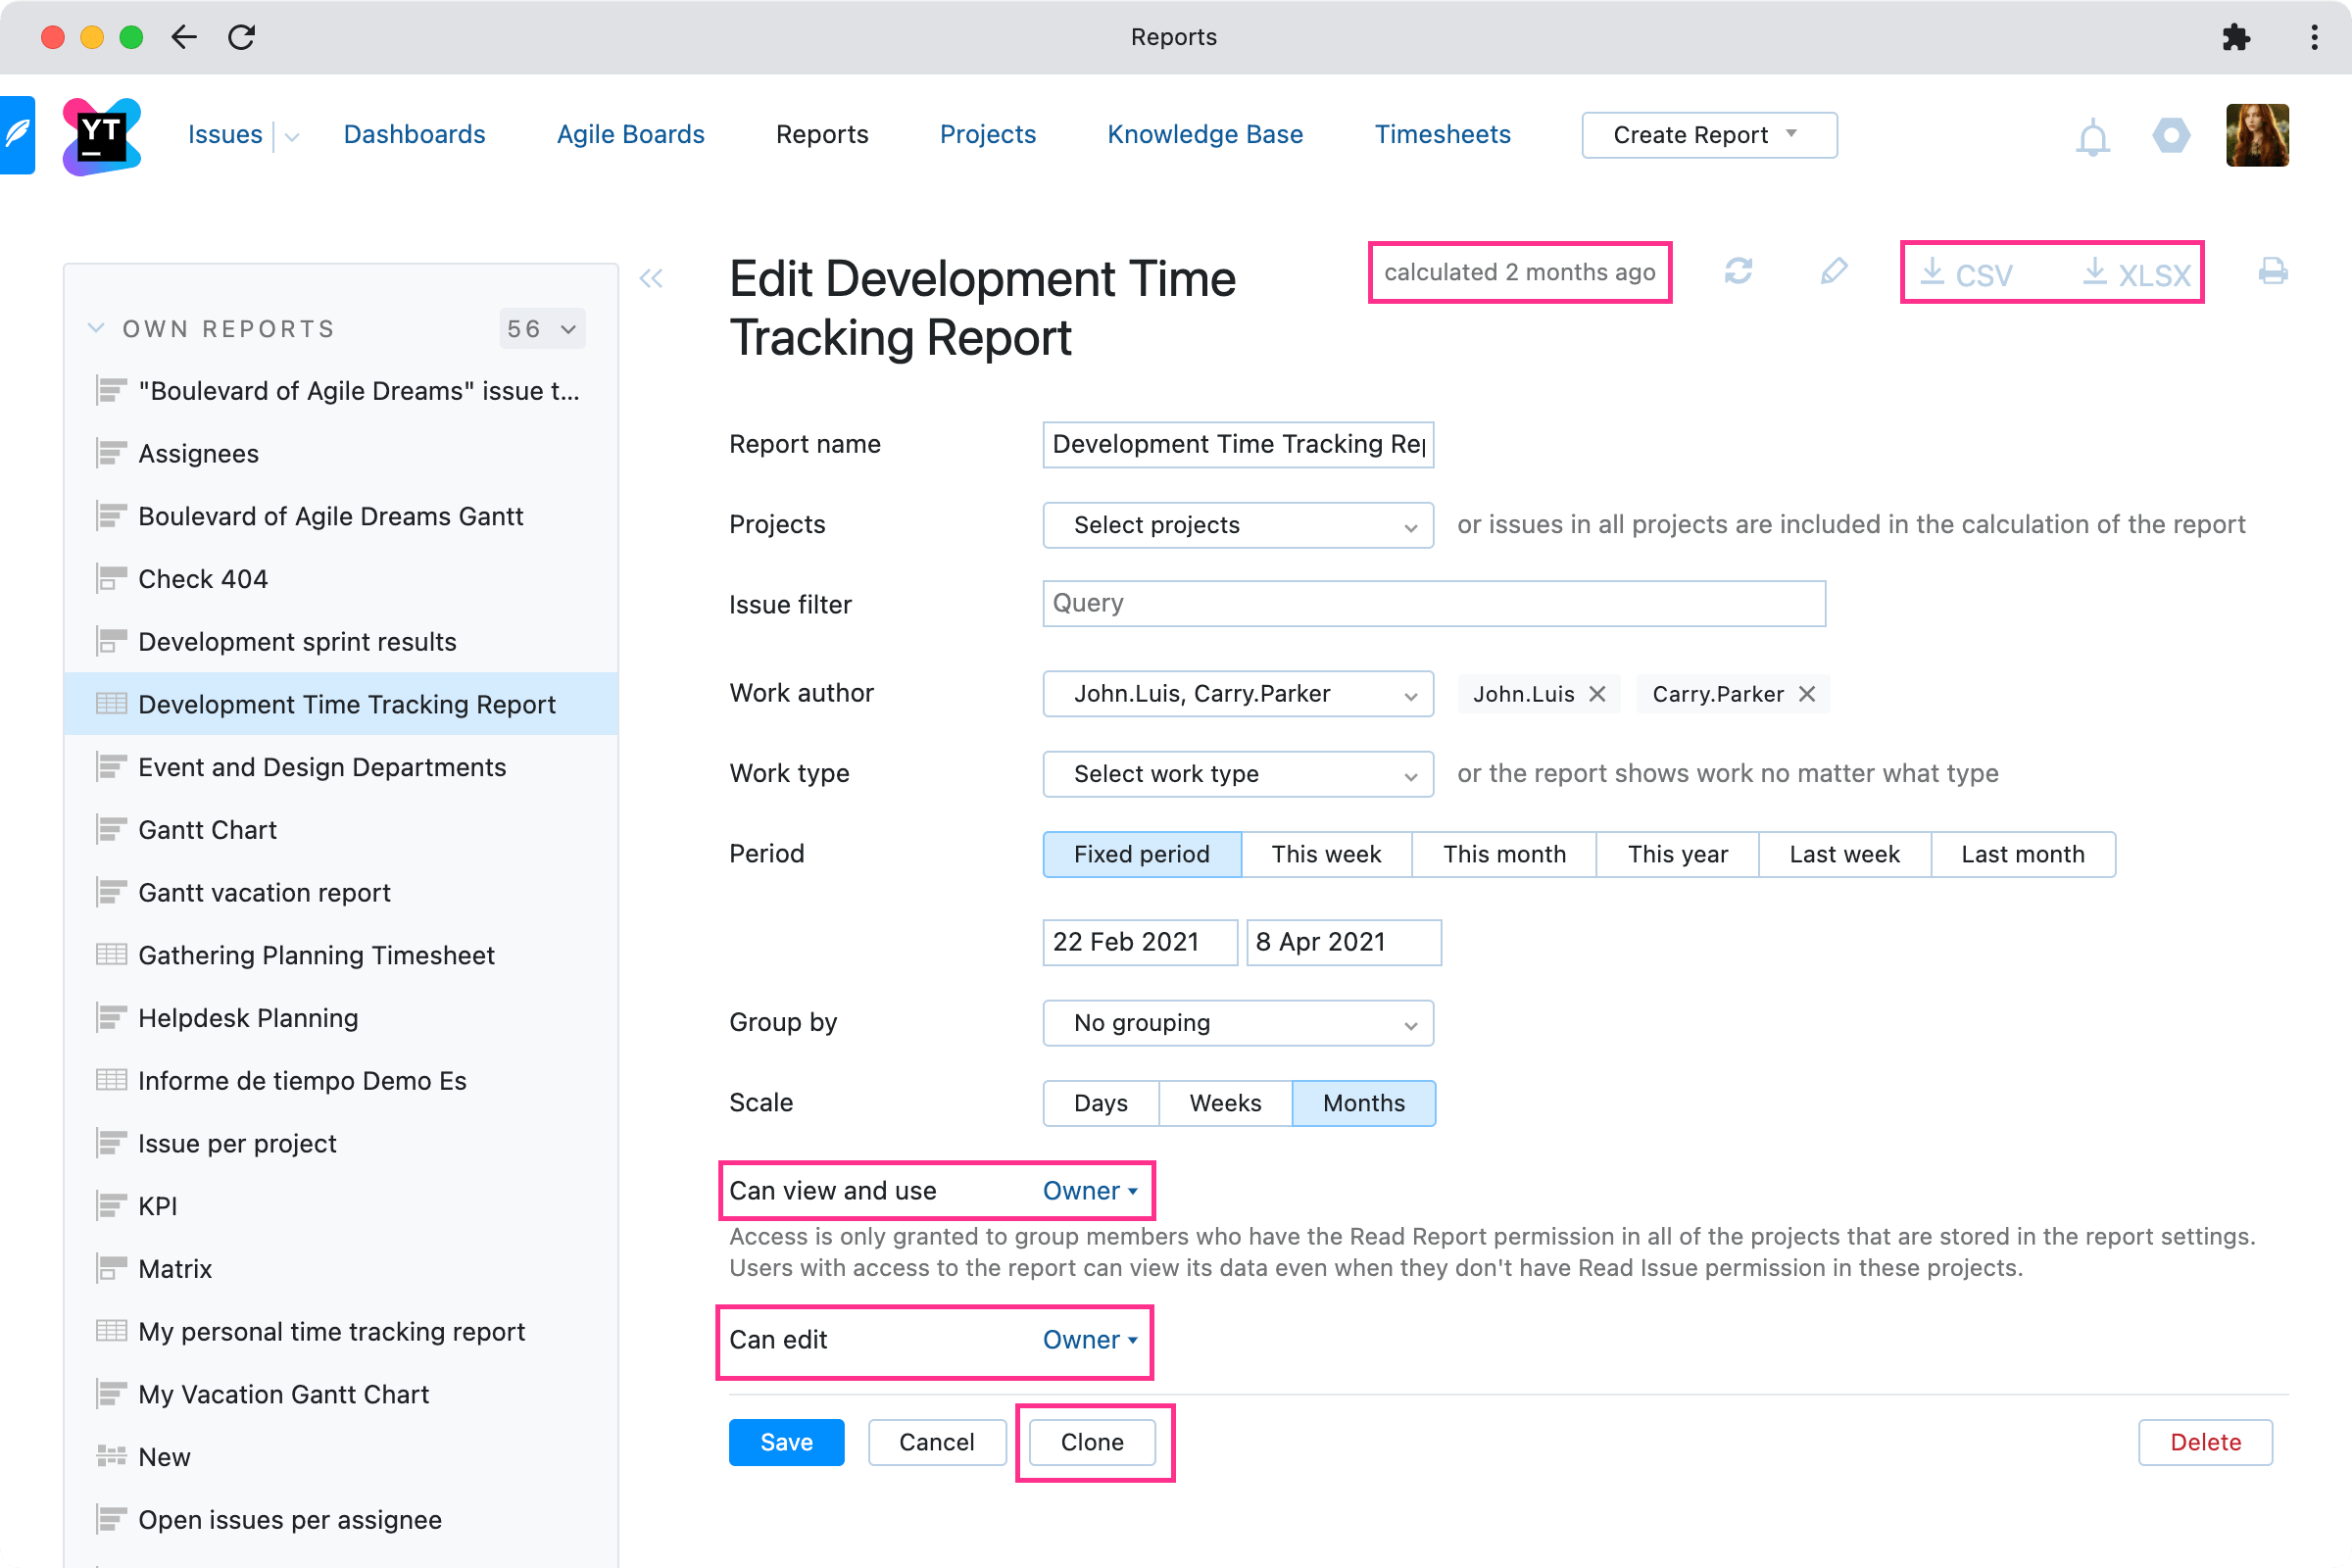
Cloning reports
Any report can be cloned, so you can quickly create a new report based on an existing one.
Exporting and printing
Use the print option to create a paper or PDF copy of a report. All reports can be downloaded in tabular CSV or XLSX format.