Code analysis
On-the-fly analysis
CLion constantly monitors your code for potential errors. If it finds anything, it highlights the suspicious piece of code in the editor. If you look in the right-hand editor gutter, you will see yellow and red error strips that, if clicked, navigate you to the detected issues. Another way to navigate from one highlighted issue to another is by pressing F2/Shift+F2. The status indicator at the top of the gutter summarizes the file status.
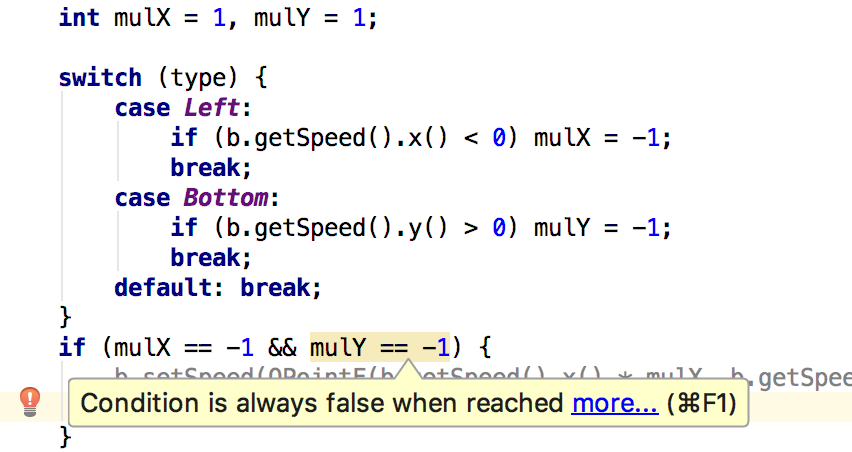
In addition to finding compilation errors, CLion identifies code inefficiencies and even performs data flow analysis over your code to locate unreachable/unused code, as well as other issues and 'code smells'.
Quick-fixes
CLion’s on-the-fly code inspections cover about 40 potential problem cases in C/C++ code and quite a few for other languages as well.
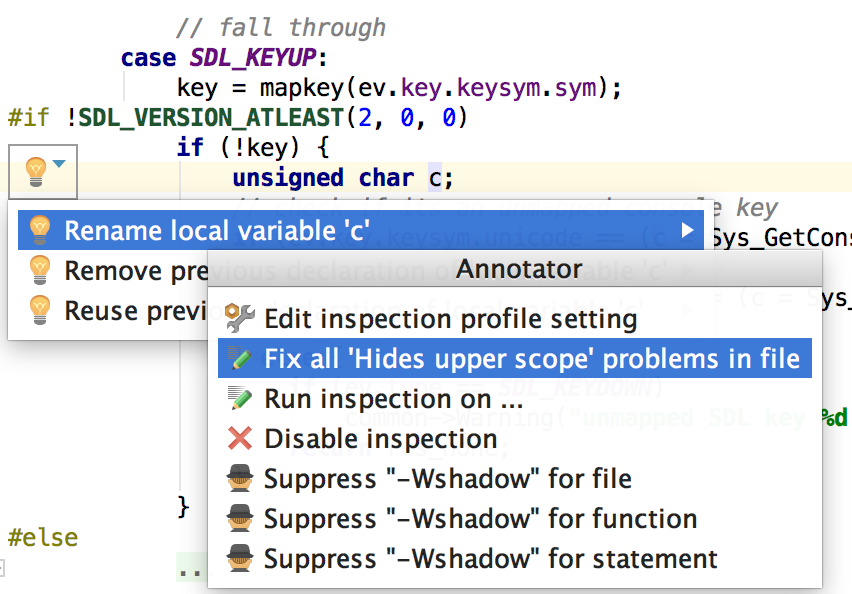
When a problem is highlighted, place the caret on it, press Alt+Enter and choose from the suggested quick-fix solutions. (Alternatively, enter the context menu by clicking the light bulb next to the line.)
You can also choose to fix all similar issues across your project. Or, if you don’t find this inspection useful, you can suppress it for the desired scope.
Inspect code
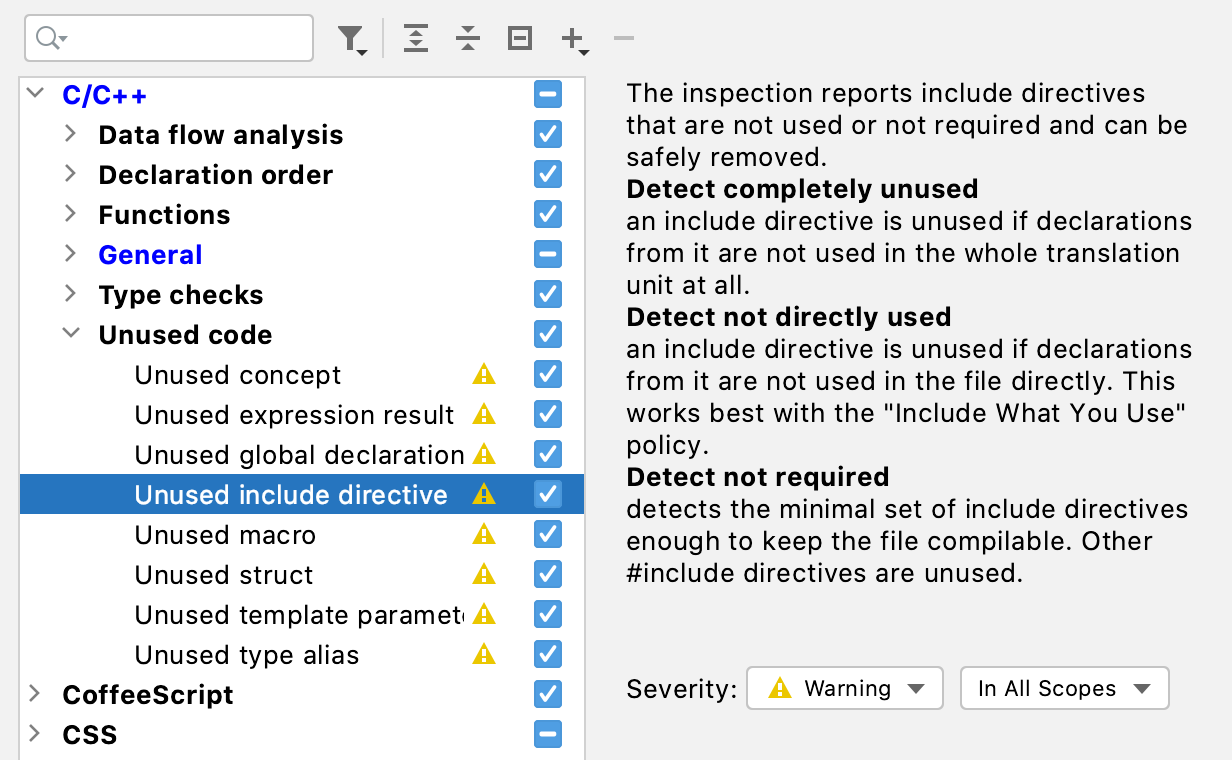
CLion provides detailed descriptions for all of the available inspections. You can also manage their severity (choose from Typo, Warning, Error, etc.) or even in some cases adjust an inspection’s parameters to better reflect your requirements.
You can run multiple inspections (or even all of them) in this batch mode with Code
| Inspect Code.
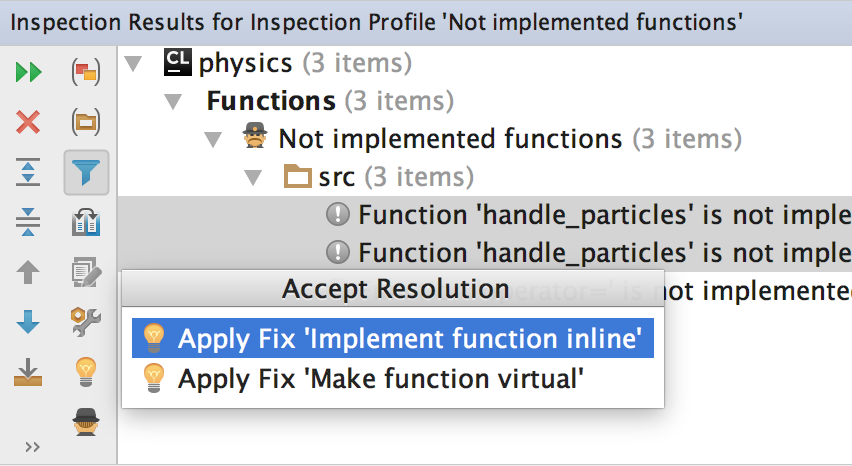
If you’d like to eliminate a particular problem from your entire code base, you can use Run inspection by name (Ctrl+Alt+Shift+I) and select the desired scope. A separate window with inspection results will open in which you can regroup issues and batch-apply quick-fixes to all the issues, where possible.
Clang-Tidy
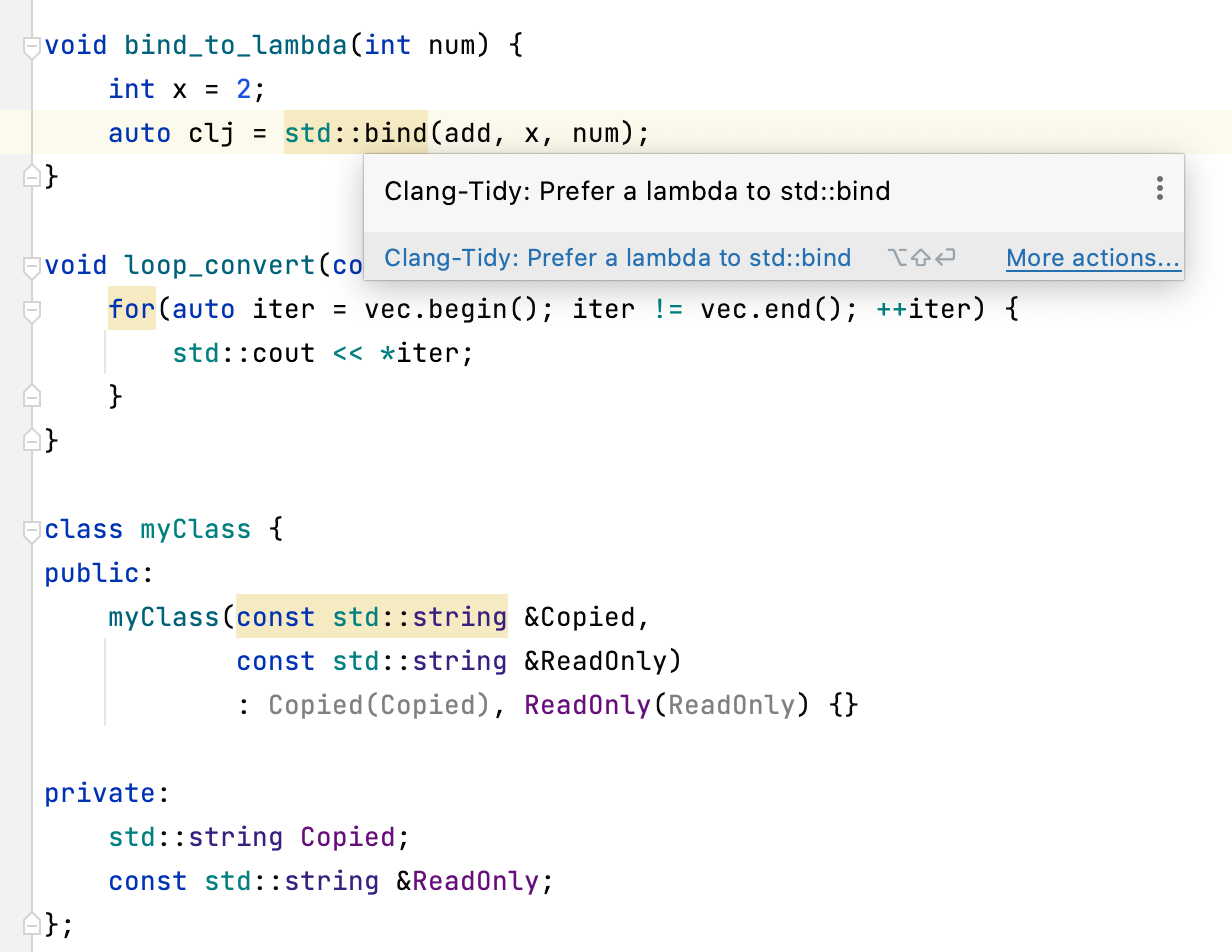
CLion comes with the Clang-Tidy integration. Clang-Tidy checks are shown the same way as CLion’s own built-in code inspections, and quick-fixes are also available via Alt+Enter.
Go to Settings/Preferences | Editor | Inspections | C/C++ | General | Clang-Tidy to tune the list of checks enabled/disabled in CLion. Clang-Tidy command line format is used in the text field. The default configuration can be found here. Or use .clang-tidy config files instead of the IDE-provided settings.
Enable C++ Core Guidelines or Clang Static Analyzer checks, try Modernize checks or even implement your own checks and get them immediately in CLion (for custom checks, change the Clang-Tidy binary to your own one under Settings/Preferences | Languages & Frameworks | C/C++).
Checks on top of Clangd
There are several inspections implemented on top of the custom Clangd-based engine in CLion:
- Member function can be static
- Argument selection defects
- Empty declaration or statement
- Virtual call from constructor or destructor
- Unused includes
The ‘unused includes’ check suggests 3 detection strategies: a conservative one, an aggressive one, and the default one (Detect not directly used) which is the closest to the “Include What You Use” principle.
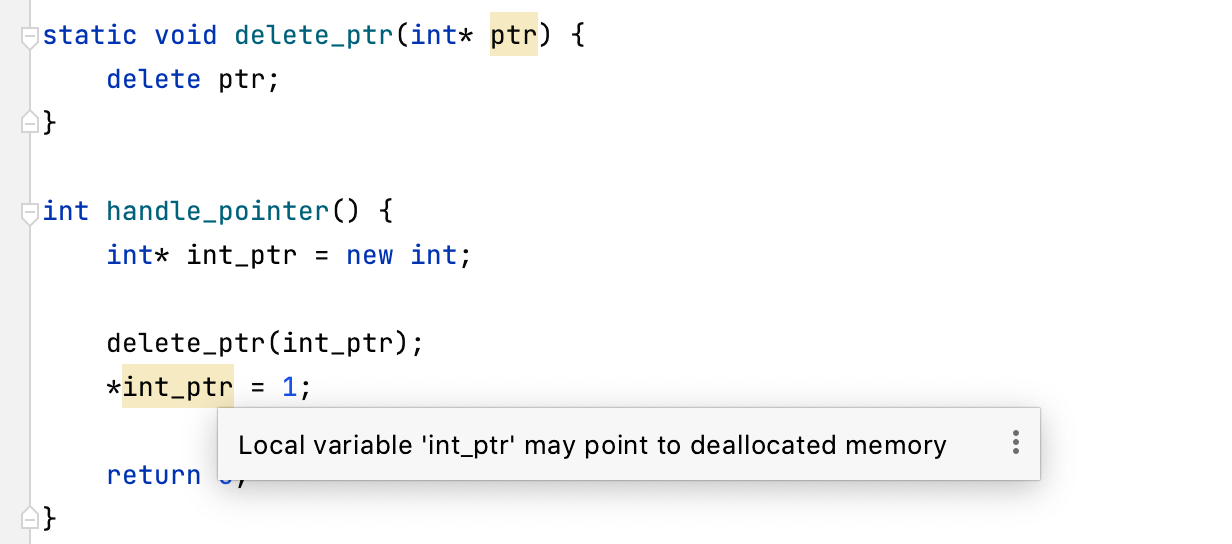
Data Flow Analysis
Data flow analysis (DFA) tracks the flow of data in your code and detects potential issues based on that analysis. In addition to the local DFA (which works within a single function), CLion includes global DFA (which takes a whole translation unit of a program as a single unit for analysis). Global DFA not only enriches the already existing checks but also adds several unique inspections.
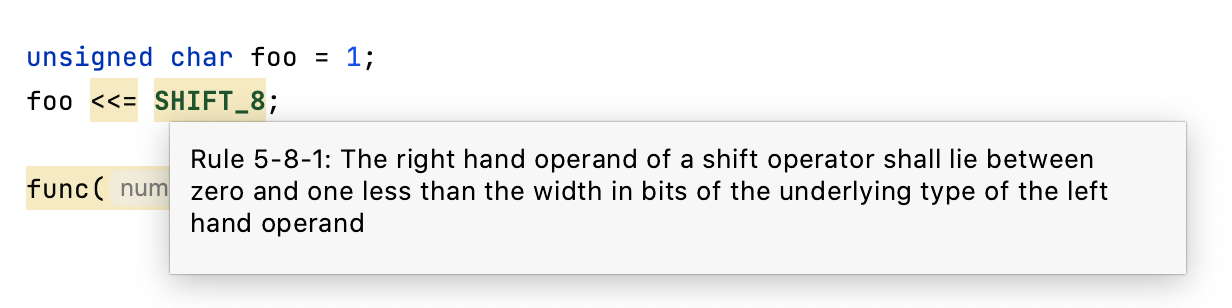
MISRA
CLion comes with checks from MISRA C 2012 and MISRA C++ 2008. The full list of supported checks is maintained on our confluence page and allows you to easily track the progress.