Run and debug
Configurations
For each target in your project (for CMake, Makefile, and Gradle projects), CLion generates a configuration that can be built and run, and allows you to configure external tools to run before/after the build phase in a separate UI dialog.
Configuration templates
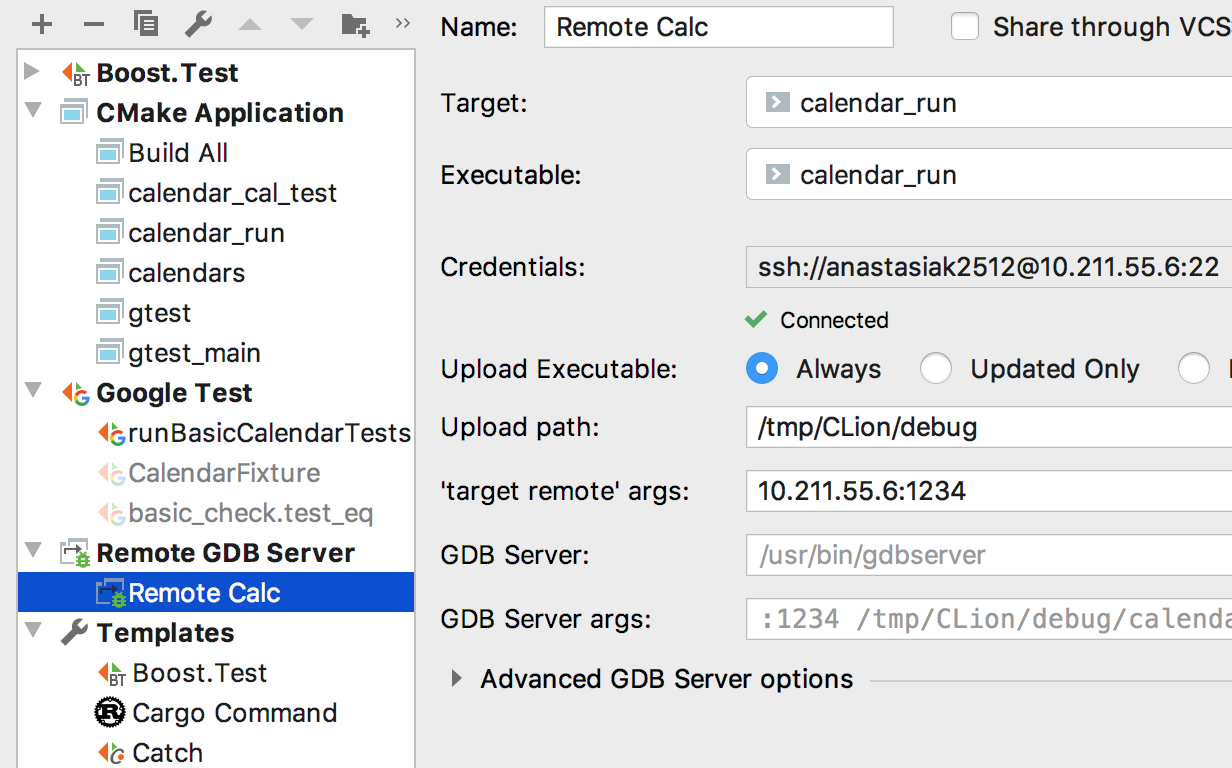
Use configuration templates to create configurations for unit testing, remote debug or regular application run.
Run configuration
You can change the executable for any configuration of your choice, or even make a configuration not runnable by changing this value to Not selected.
Build your project by pressing Ctrl+F9 and run the currently selected configuration with Shift+F10.
Debug configuration
For debug press Shift+F9.
To help you inspect the state of your code during debugging, CLion equips you with many useful shortcuts like Step over/into (F8/F7), Step out (Shift+F8), or Run to cursor (Alt+F9).
Custom Build and Run
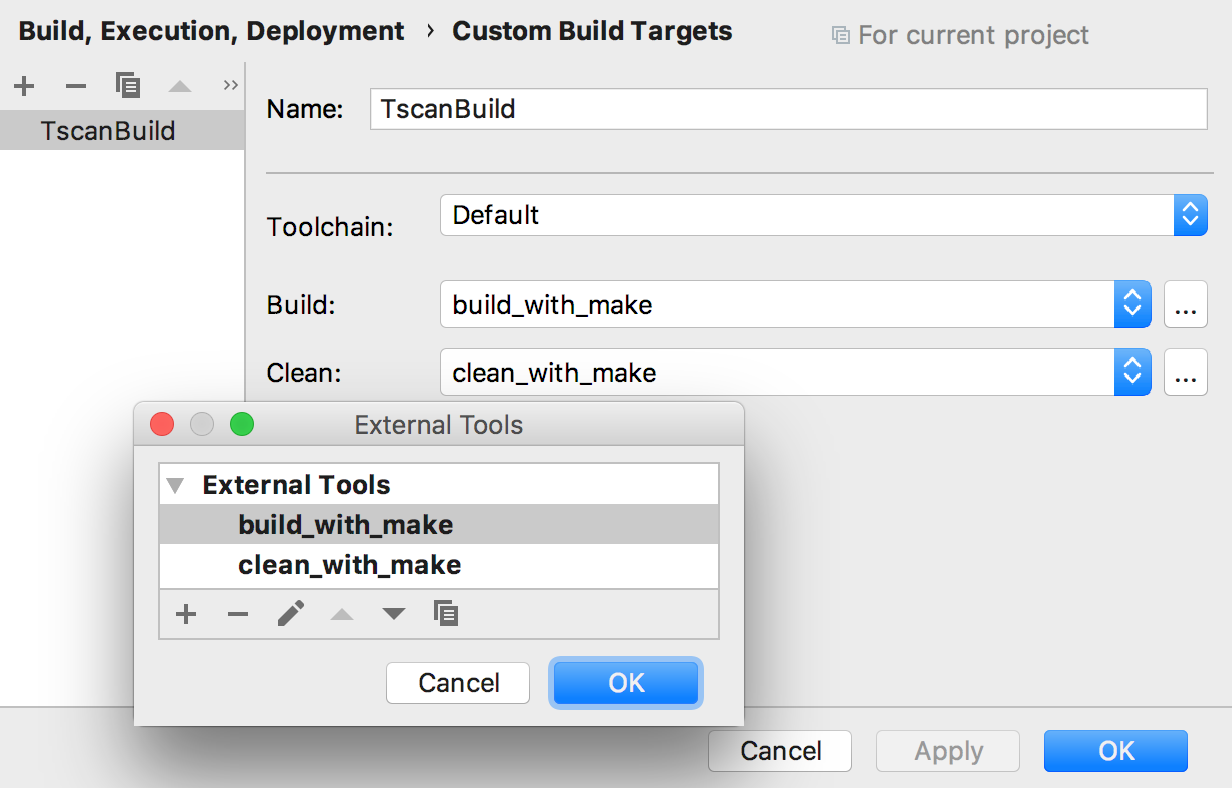
Build-system independent Build Targets allow you to add custom targets and configure any tools to be used for Building/Cleaning the target.
To run and debug Custom Targets from CLion, create a corresponding Run/Debug configuration by using the Custom Build Application template.
Recompile a single file
To speed up your development cycles in CLion when working with CMake or compilation database projects, use Recompile (Shift+Ctrl+F9). It reruns the compilation for a selected file, without triggering the recompilation of the whole project.
Debug/Release build types
When CMake is used, switch between CMake profiles (and built types) in the run configuration switcher on the toolbar or in the Run (Shift+Alt+F10)/Debug (Shift+Alt+F9) configuration switcher popup.
Input/Output
CLion uses PTY as an I/O unit, which means that you can expect a behavior similar to running your project in a terminal, even on Windows.
Debug
CLion integrates with the GDB backend on all platforms and LLDB on macOS and Linux.
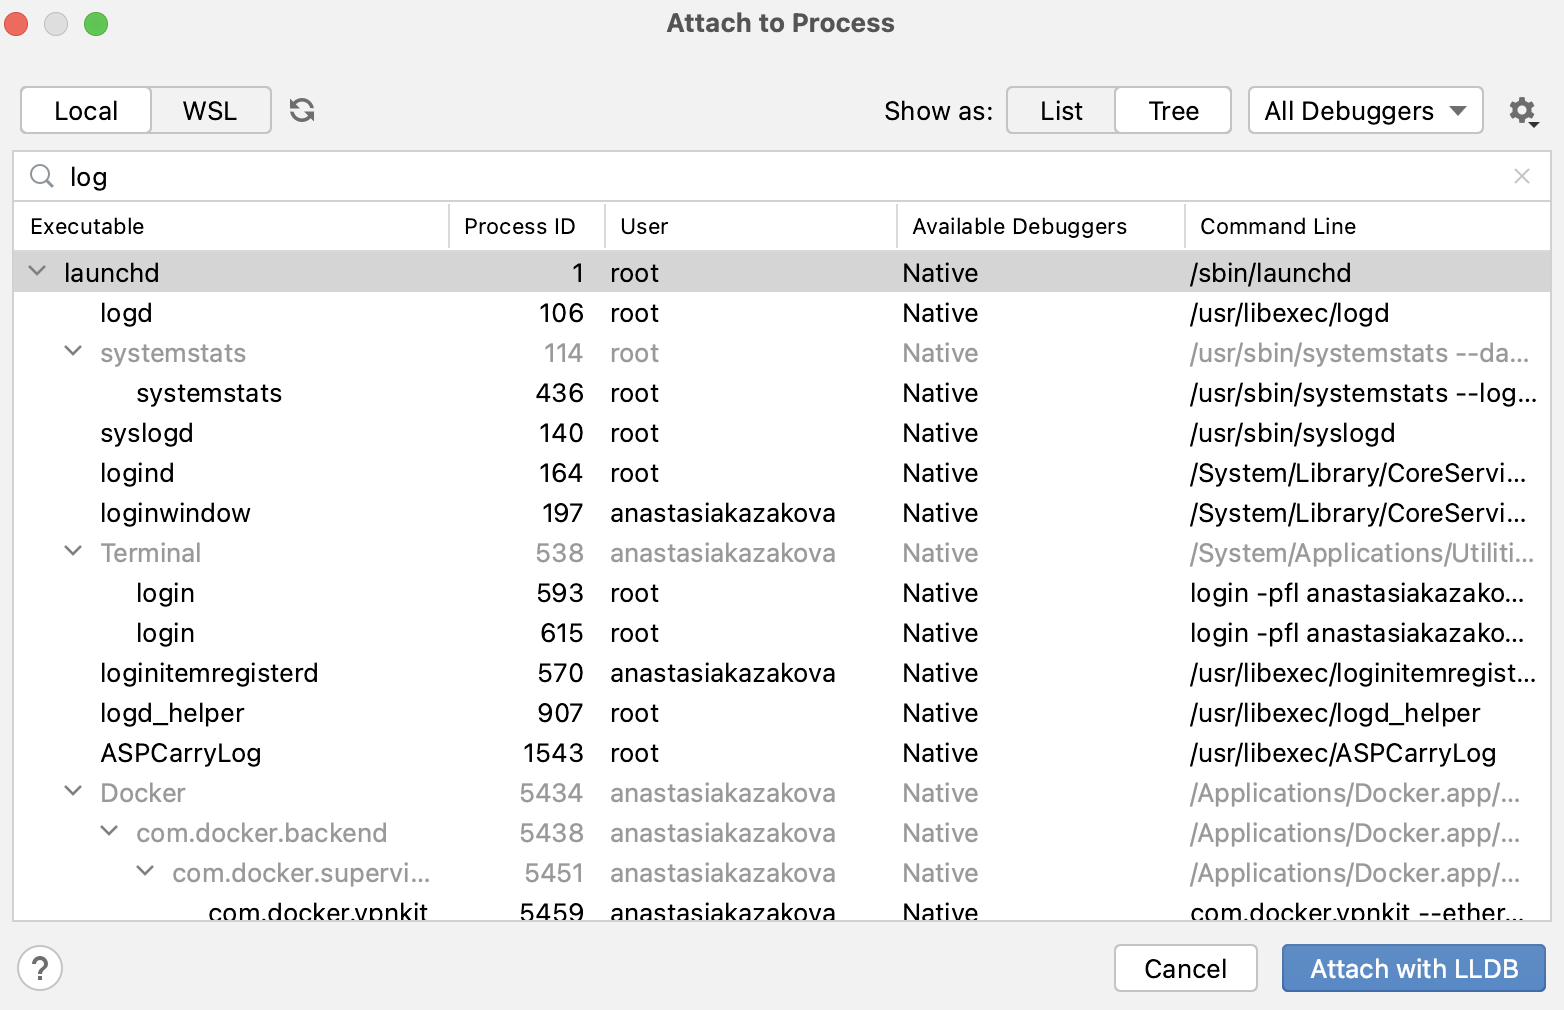
Attach to process
CLion allows you to debug processes, run on the same or remote machine but not started from the IDE, by attaching to them using their pid or process name. Benefit from CLion’s built-in debugger UI.
Breakpoints
CLion includes an integrated debugger to help you inspect your code’s execution. You can select among several types of breakpoints in CLion (all the breakpoints can be reviewed in a separate dialog (available via Ctrl+Shift+F8)):
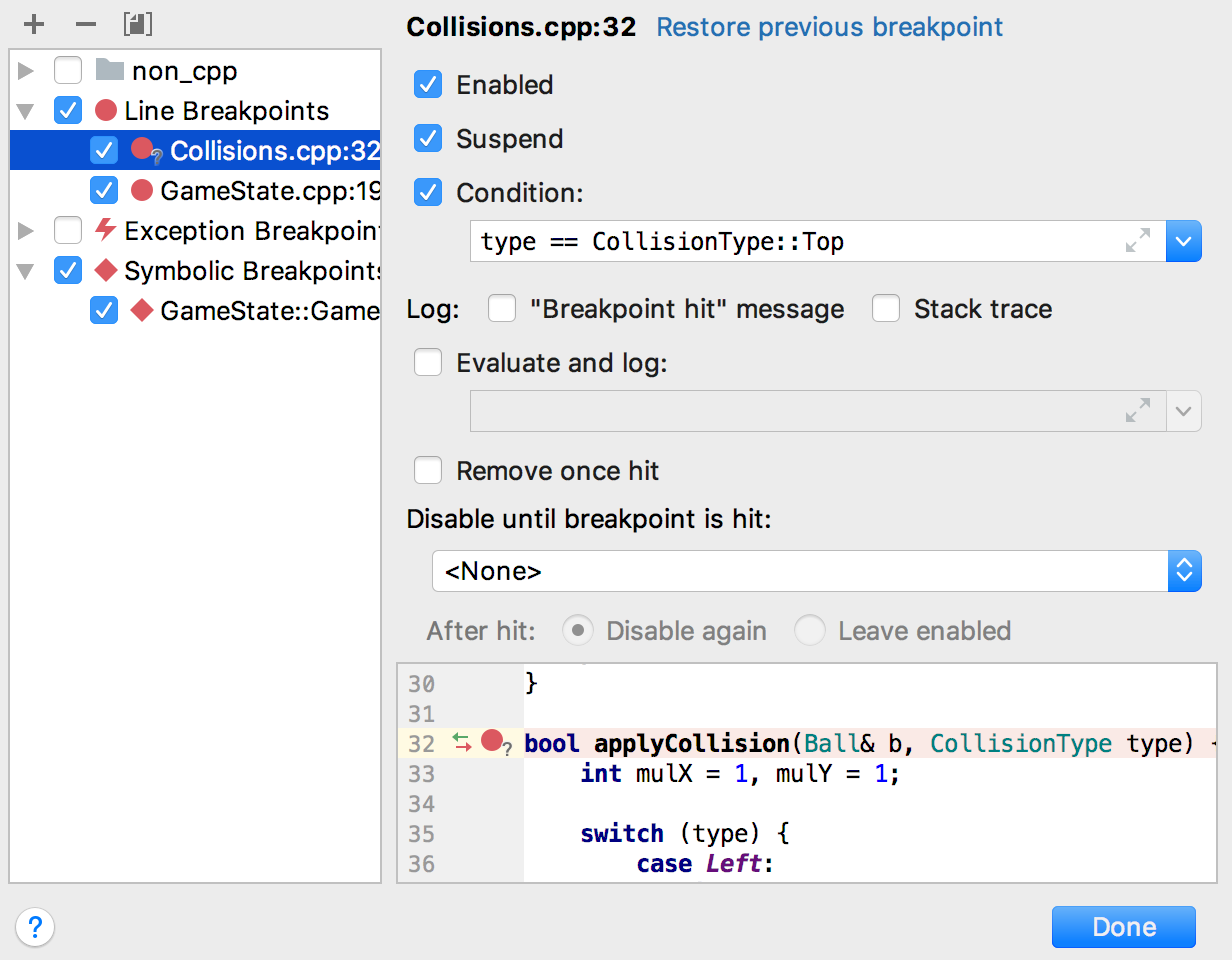
- Line breakpoints are the easiest way to debug your code. Simply set a breakpoint with the mouse by clicking in the left-hand gutter of a line.
- Symbolic breakpoints help you stop program execution when a specific function starts executing. Find a symbol by its name, taking advantage of code completion, to go to the appropriate function.
- Exception breakpoints help catch any thrown exception without any extra hassle.
Set Execution Point
With a Set Execution Point to Cursor action, you can move back and forth
though your program’s execution while debugging, break loops or restart them,
select another branch in an if-else clause or switch-case
statement, and even skip loops completely. It is as simple as dragging-and-dropping
an arrow in the gutter to the line you are interested in.
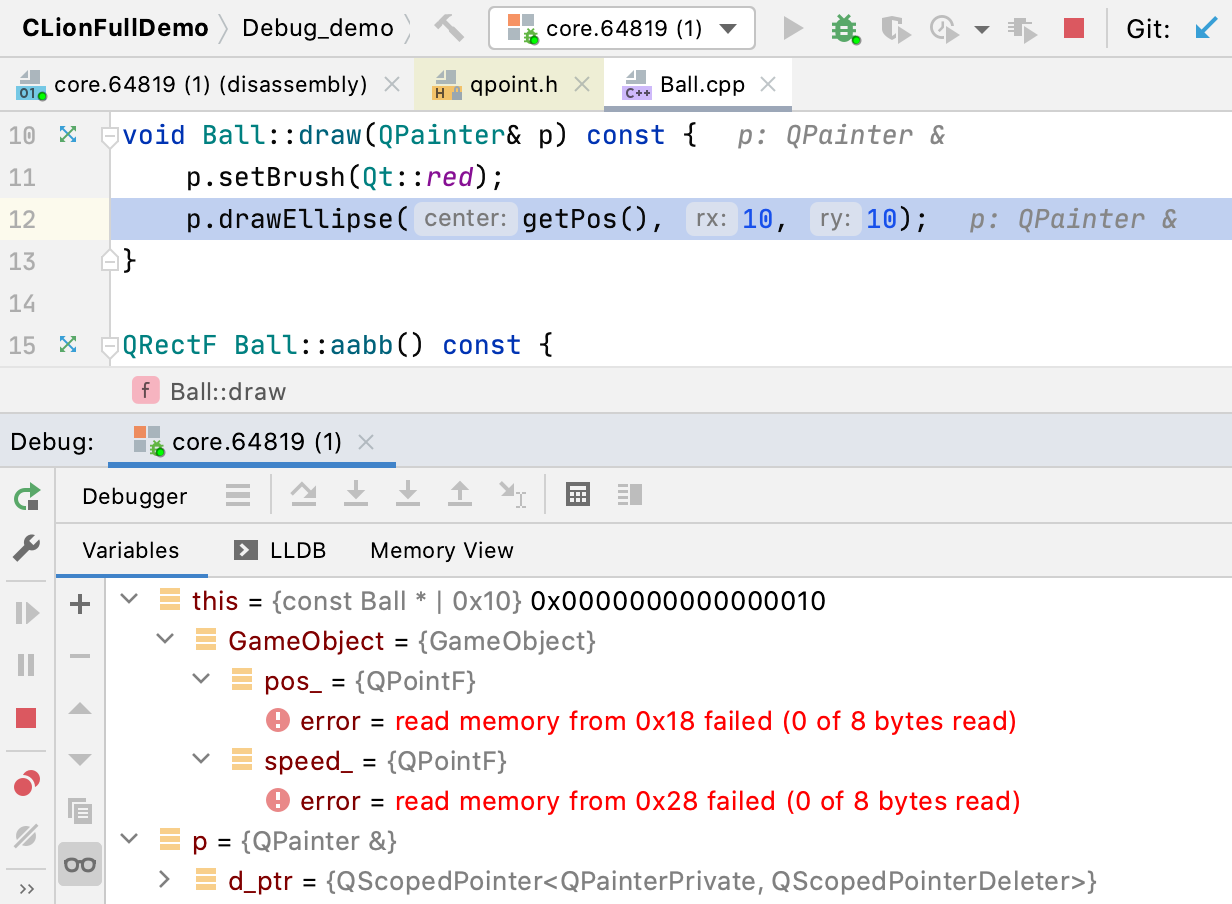
Watches and evaluations
The description of all available variables, including STL containers content will be placed in Variables tab in Debug tool window. There you can observe and even change any value without interrupting current debug session:

GDB/LLDB tab provides access to GDB/LLDB console, while Frame and Watches views help investigate any problem in more detail. As a bonus, when selecting a symbol to watch you can benefit from autocompletion.
In addition, you can evaluate any expression during a debugging session, simply by pressing Alt+F8.
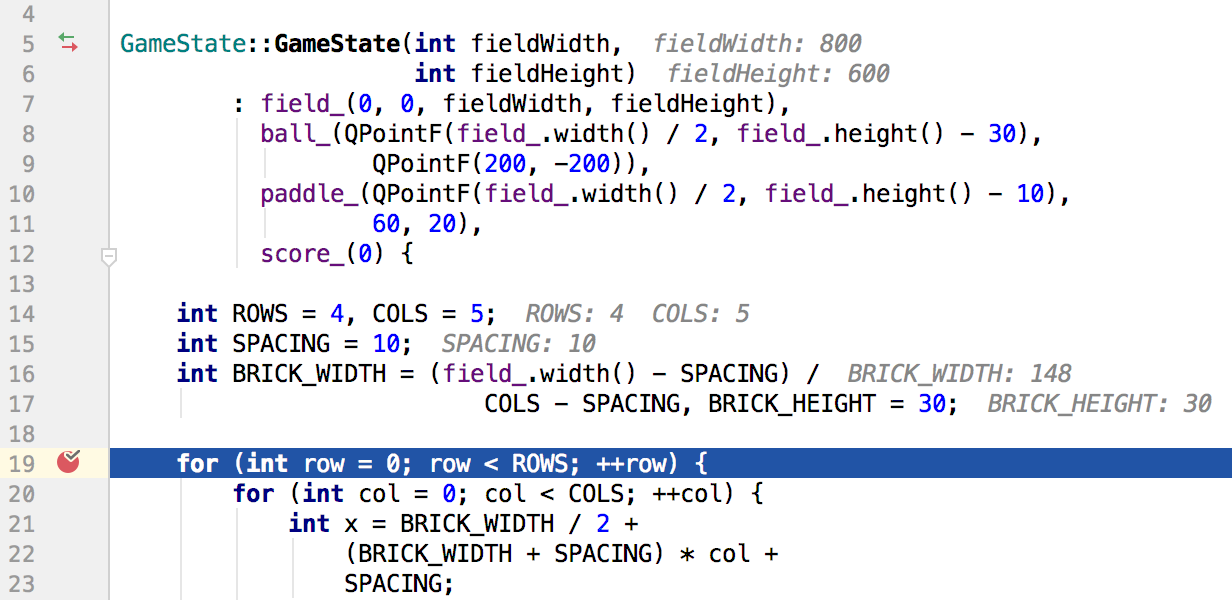
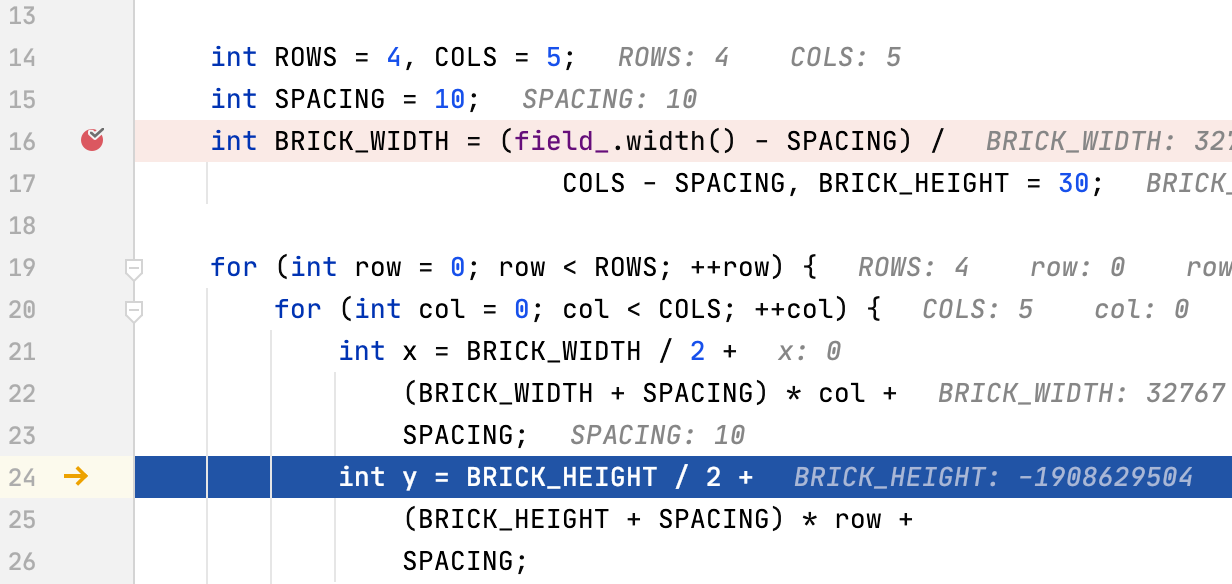
Inline variable view
With this feature you can view current variable values right in the editor (next to the variable declaration). No need to switch to the Variables tab in the Debug tool window!
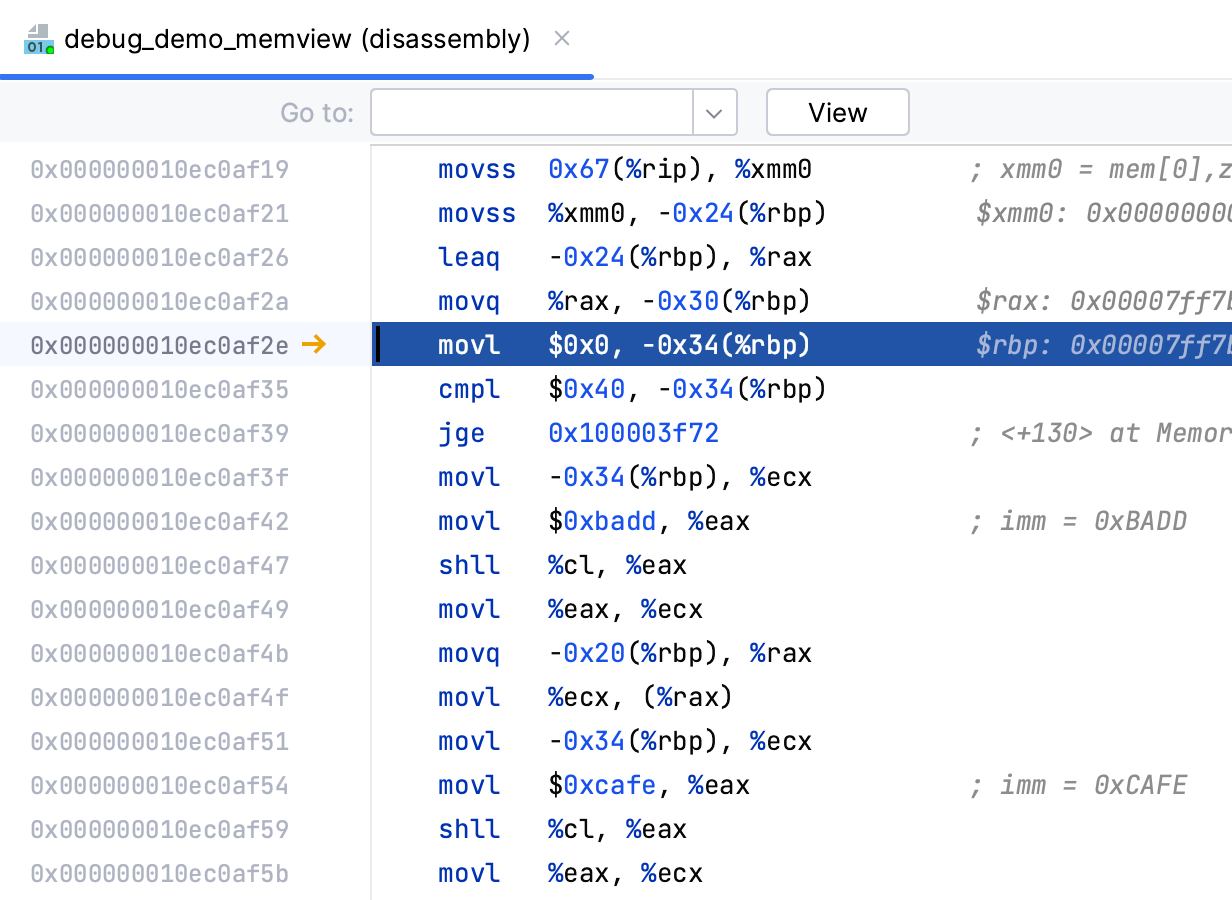
Disassembly view
Read the assembly code, which is properly highlighted in the editor, and step through it to investigate the problem.
While stepping through assembly code, add/remove breakpoints on instruction lines. For non-default configuration of these address breakpoints, use the right-click context menu menu.
Supported for GDB and LLDB.
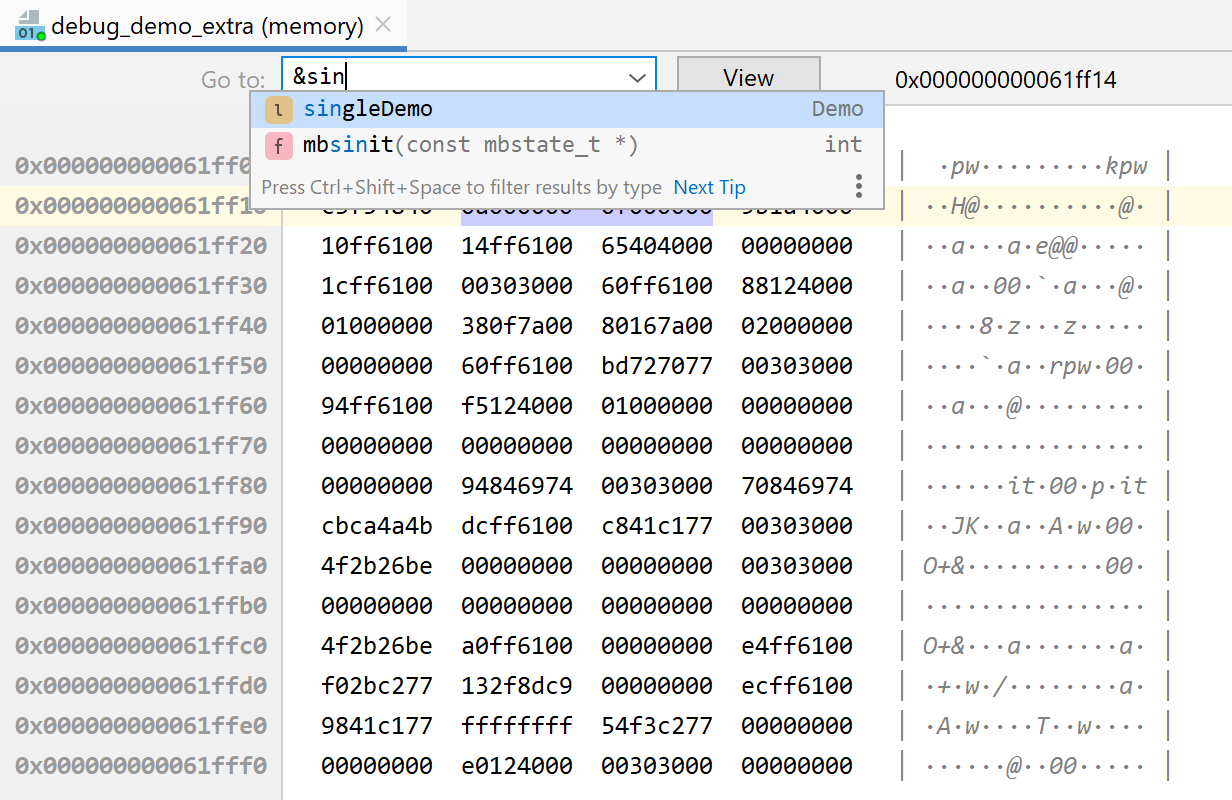
Memory View
Memory View dumps the memory behind the pointer in the Debug mode. To invoke it, select a pointer variable in the debugger’s variables view and press Ctrl+Enter.
During stepping, if you have Memory View opened, CLion will highlight the memory changes that take place in the selected memory piece.
Navigate to a particular address in memory from the Memory View. Use the hex value
representing an address, a pointer variable, or call the address (&) of any
variable you are interested in.
Code completion will assist you with the known symbols.

Debug as Root
CLion can run and debug your application with root privileges – you just need to select this option in the corresponding Run/Debug configuration. This works for CMake, Makefile, Gradle Native, Custom Build, and CTest applications.
Debugging with Core Dumps
A Run | Open Core Dump… action allows you to open an existing core dump of a crashed process in CLion and debug it there. Users can inspect the frames and variables view, check the memory and disassembly view, evaluate expressions, and run debugger commands from the debugger console.
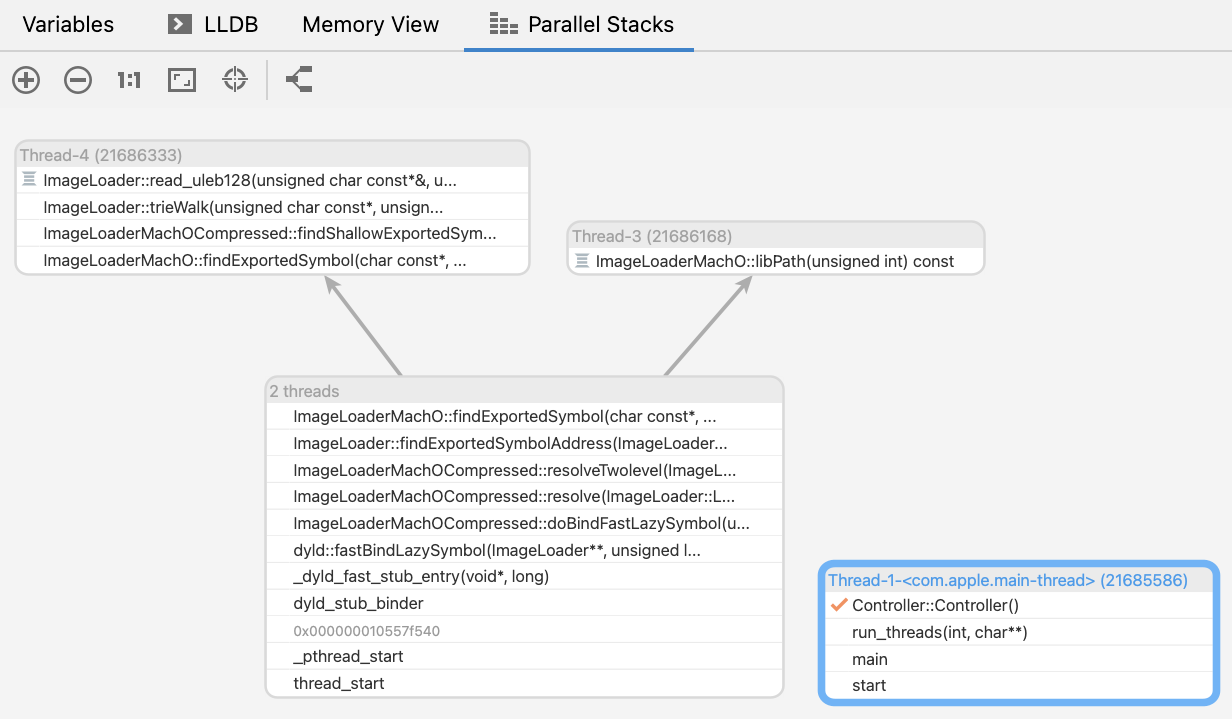
Parallel Stacks view
When debugging multithreaded applications, you have to track multiple threads at the same time. The Parallel Stacks view is implemented as a separate tab in the Debug tool window and shows thread call stack information for all the threads. It allows checking the call paths and execution points of all running threads.
Symbol servers on Windows
When debugging, sometimes the library symbols are not available on your local machine. In this case, you can use a symbol server, a file server that stores your debug symbols centrally on a server rather than on each developer’s machine. In CLion on Windows, you can now configure symbol servers for the debugger in Settings | Build, Execution, Deployment | Debugger | Symbol Servers.