Debugger Options
CLion supports debugging C/C++ executables with GDB (either bundled or custom) on all platforms and with the bundled LLDB on macOS and Linux. Also, there is an experimental LLDB-based debugger for the MSVC toolchain on Windows.
Current versions of the bundled debuggers:
GDB v 8.0.1 for macOS
GDB v 8.3 for Windows
GDB v 8.3 for Linux
LLDB v 9.0 for macOS and Linux
LLDB v 9.0 for MSVC toolchain on Windows
For a custom GDB, CLion supports versions 7.8.x-8.3.x.
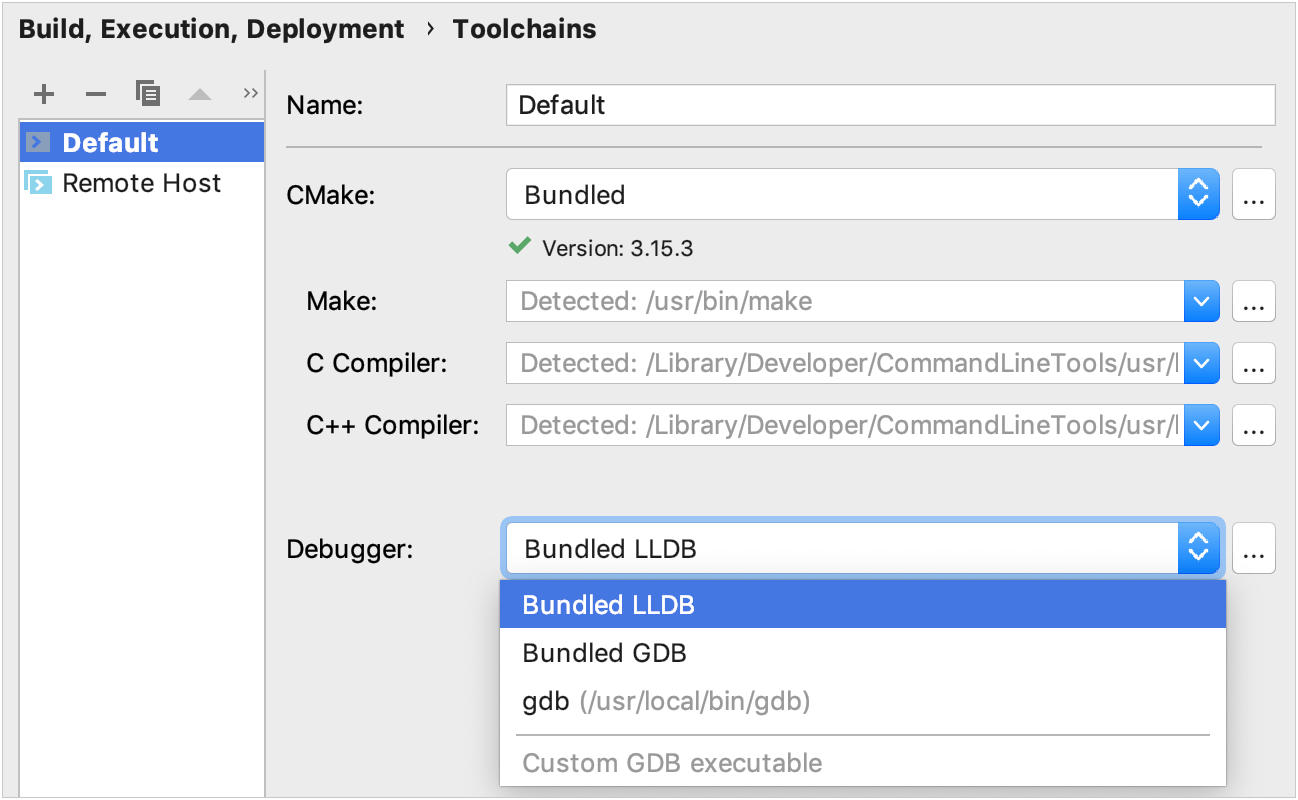
Switch between debuggers
Go to .
In the Debugger field on the right pane, select the debugger for the current toolchain:

Configuring data views
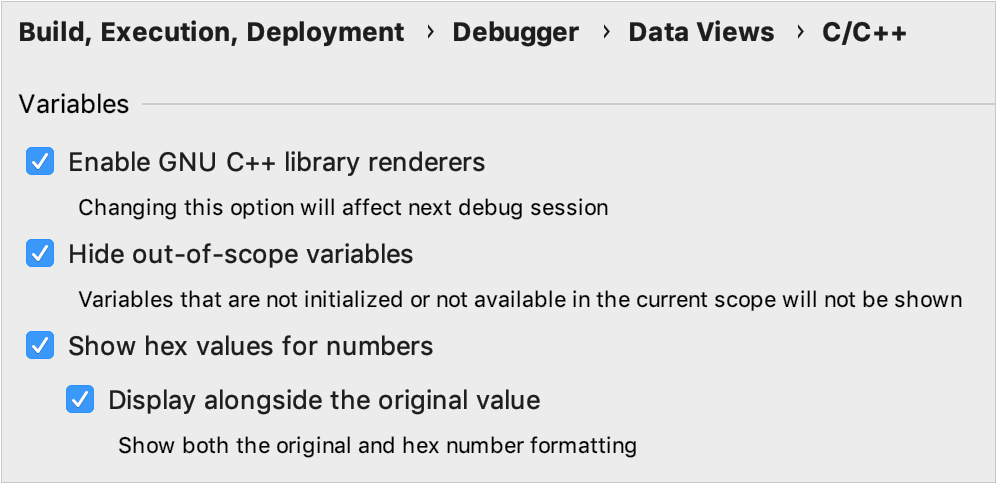
In the dialog, you can customize the C/C++ type renderers.

Option | Description |
|---|---|
Enable GNU library renderers | This option affects rendering STL containers by GDB when using the gcc compiler. In the case of clang used in pair with GDB, this option works for Currently this option is not applicable to LLDB. Check how LLDB (starting from version 9.0) handles |
Hide out-of-scope variables | Select this checkbox to hide non-initialized variables and the variables unavailable in the current scope from the Variables pane and inline view. |
Show hex values for numbers | This checkbox appears after you enable hexadecimal view in the Experimental Features dialog. |
LLDB STL formatters
Lists given below are accurate for LLDB version 9.0.
Type | libcxx | libstdc++ |
|---|---|---|
string | ||
array | ||
vector | ||
deque | ||
list | ||
forward list | ||
set | ||
map | ||
multiset | ||
multimap | ||
unordered_set | ||
unordered_map | ||
unordered_multiset | ||
unordered_multimap | ||
stack | ||
queue | ||
priority_queue |
Type | libcxx | libstdc++ |
|---|---|---|
string |
| |
array | ||
vector | ||
deque | ||
list | ||
forward list | ||
set | ||
map | ||
multiset | ||
multimap | ||
unordered_set | ||
unordered_map | ||
unordered_multiset | ||
unordered_multimap | ||
stack | ||
queue | ||
priority_queue |
STL renderers for GDB on macOS
Combination of GDB as the debugging backend and Clang (the CMake default compiler) implies limitations on viewing the content of STL containers on macOS. As a workaround, try the following instructions.
Use the
libstdc++library instead oflibc++. To includelibstdc++in your project, add the following command in CMakeLists.txt:set(CMAKE_CXX_FLAGS "${CMAKE_CXX_FLAGS} -stdlib=libstdc++")Alternatively, go to and specify the library in the CMake options field:
-DCMAKE_CXX_FLAGS="-stdlib=libstdc++"We also recommend you use the dwarf3 debug info format. For this, add the following commands to your CMakeLists.txt:
set(CMAKE_CXX_FLAGS_DEBUG "${CMAKE_CXX_FLAGS_DEBUG} -gdwarf-3") set(CMAKE_C_FLAGS_DEBUG "${CMAKE_C_FLAGS_DEBUG} -gdwarf-3")
Using .gdbinit/.lldbinit configuration files
Sometimes you may need to customize the debugger settings by passing commands and options into the .gdbinit/.lldbinit file.
By default, CLion uses .gdbinit or .lldbinit from the user's home directory (~/.gdbinit or ~/.lldbinit, respectively). You can change this behavior and enable reading the debugger configuration file from the project root.
Enable reading .gdbinit/.lldbinit from the project root
Set the permissions in the home ~/.gdbinit file:
Globally
set auto-load local-gdbinit on add-auto-load-safe-path /For a particular project
set auto-load local-gdbinit on add-auto-load-safe-path [full path to the project root]/.gdbinit
Set the permissions in the home ~/.lldbinit file:
Adjusting GDB timeout values
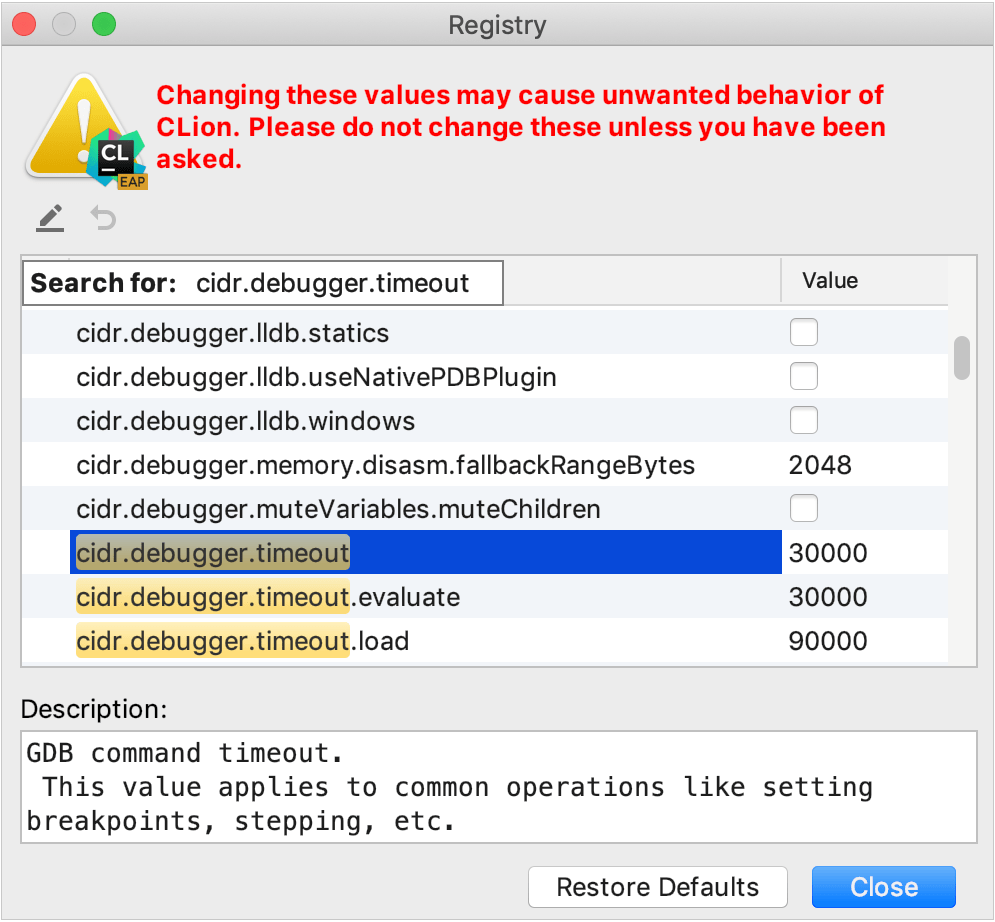
You can control the GDB timeout values by setting the corresponding properties in CLion registry.
Go to the (or press Ctrl+Shift+A) and type Registry.
In the dialog that opens, start typing cidr.debugger.timeout. Click the Value field of the highlighted string and enter the timeout value in milliseconds.

Configuring external GDB console on Windows
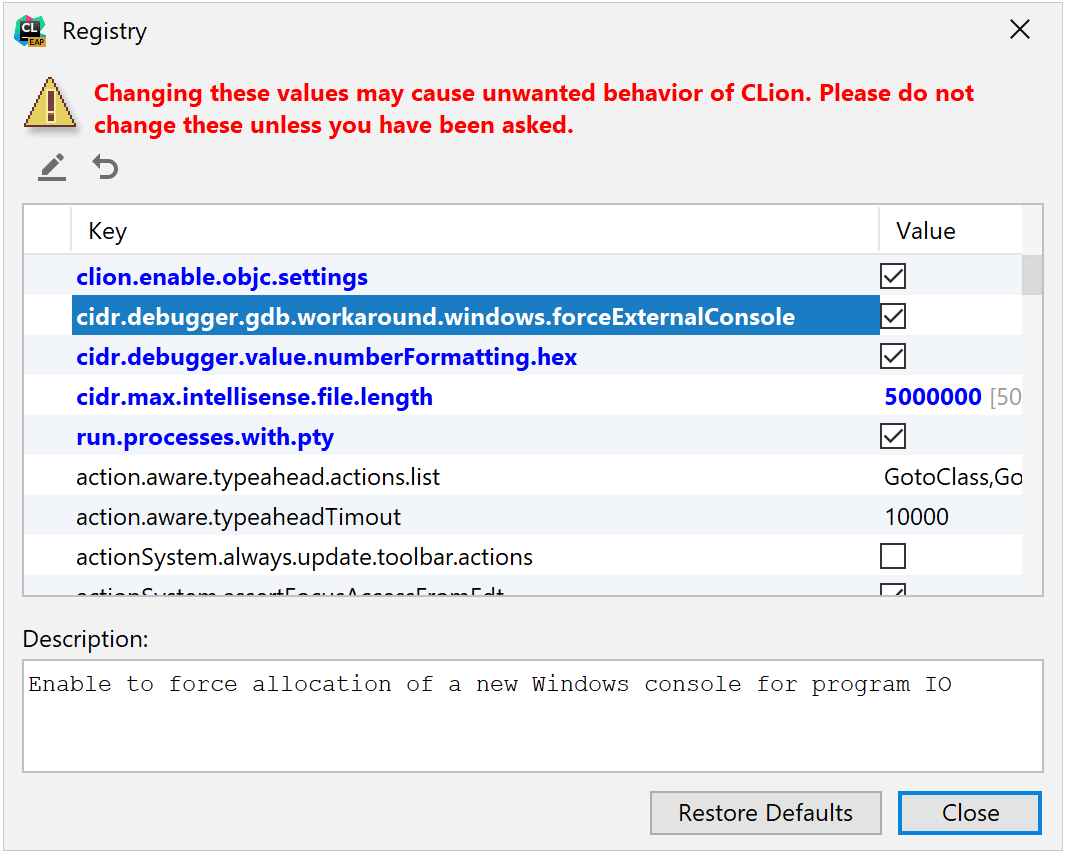
On Windows with GDB versions prior to 8.0, a separate console is used for application input/output. For the newer GDB versions, the output is redirected to CLion console by default. However, you can switch back to opening an external output window.
Go to the (or press Ctrl+Shift+A) and type Registry.
In the dialog that opens, start typing cidr.debugger.gdb.workaround.windows.forceExternalConsole. Click the Value field of the highlighted string and enter the timeout value in milliseconds.


