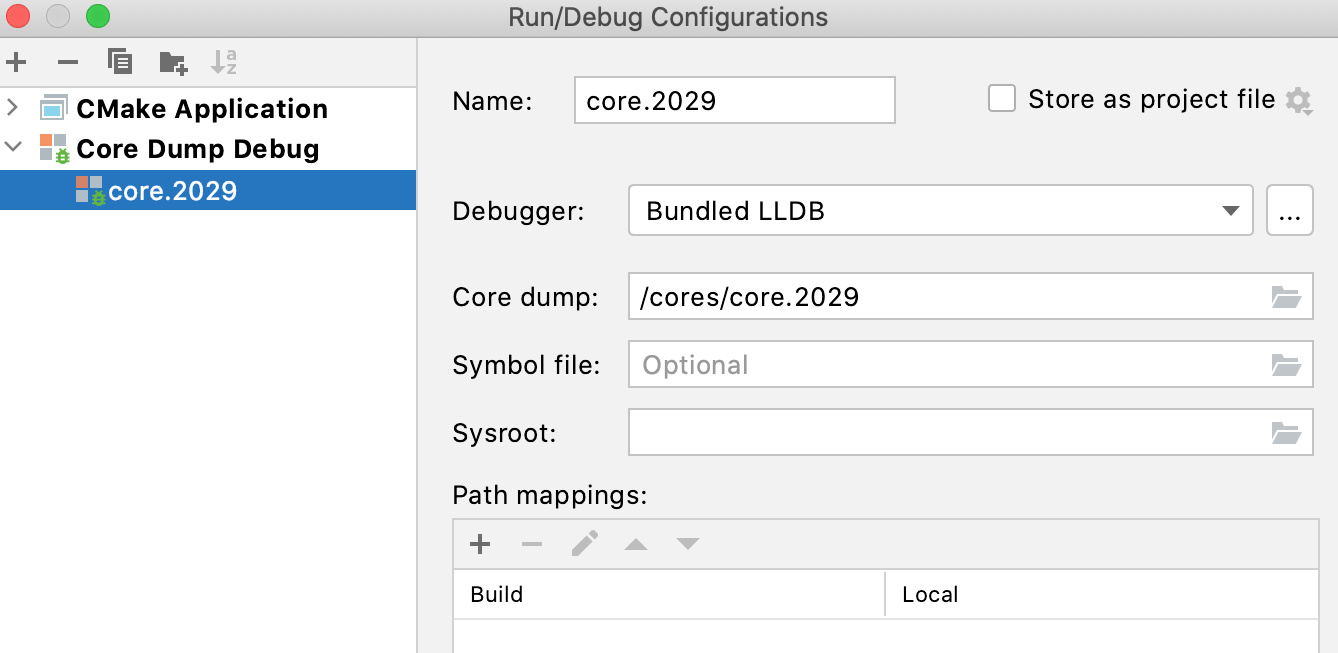
Run/Debug Configuration: Core Dump Debug
Use this page to configure the options for Core dump debugging.

Common settings
When you edit a run configuration (but not a run configuration template), you can specify the following options:
Item | Description |
|---|---|
Name | Specify a name for the run configuration to quickly identify it among others when editing or running. |
Store as project file | Save the file with the run configuration settings to share it with other team members. The default location is .idea/runConfigurations. However, if you do not want to share the .idea directory, you can save the configuration to any other directory within the project. By default, it is disabled, and CLion stores run configuration settings in .idea/workspace.xml. |
Configuration tab
Item | Description |
|---|---|
Debugger | Select the debugger to be used: bundled LLDB, bundled GDB, toolchain's GDB, or a custom external GDB. Default debuggers are the bundled LLDB if the default toolchain is configured with LLDB, and the bundled GDB in all other cases. |
Core dump | Provide the path to the core dump file or select it using the file chooser. Make sure the file has read access permission. |
Symbol file (optional for LLDB, required for GDB) | Symbol file is required for CLion to identify the program symbols correctly and navigate you to the proper source code locations. This can be a program's binary build with debug information or a separate symbol file. Note that symbols from the linked libraries built without debug info will be available only if related debug symbols are located in default search directories. LLDB can detect the binary that corresponds to the selected core dump. However, if the crash you investigate happened in a binary without debug symbols, you need to provide them to LLDB explicitly. For this, specify the path to a non-stripped version of the binary or a separate symbol file. For GDB, it's required that you specify a non-stripped binary or a separate symbol file manually. |
Sysroot | Specify the |
Path mappings | Use this pane to set path mappings if the binary was built on another machine with different file/directory names or paths. |