Debugger options
CLion allows you to debug C and C++ executables using the following debuggers:
LLDB on macOS and Linux.
GDB on Windows and Linux.
LLDB-based debugger for the MSVC toolchain on Windows.
Custom GDB on all platforms.
Custom LLDB on macOS and Linux (it does not yet work with WSL, Docker, or Remote Host toolchains).
Debuggers that support the Debug Adapter Protocol (DAP) on all platforms.
The current versions of the bundled debuggers are as follows:
Bundled debugger | Version | Supported platforms |
|---|---|---|
LLDB | 21.1.7 | macOS, Linux |
GDB | 16.3 | Windows, Linux |
LLDB for the MSVC toolchain | 9.0.0* | Windows |
Switching between the debuggers
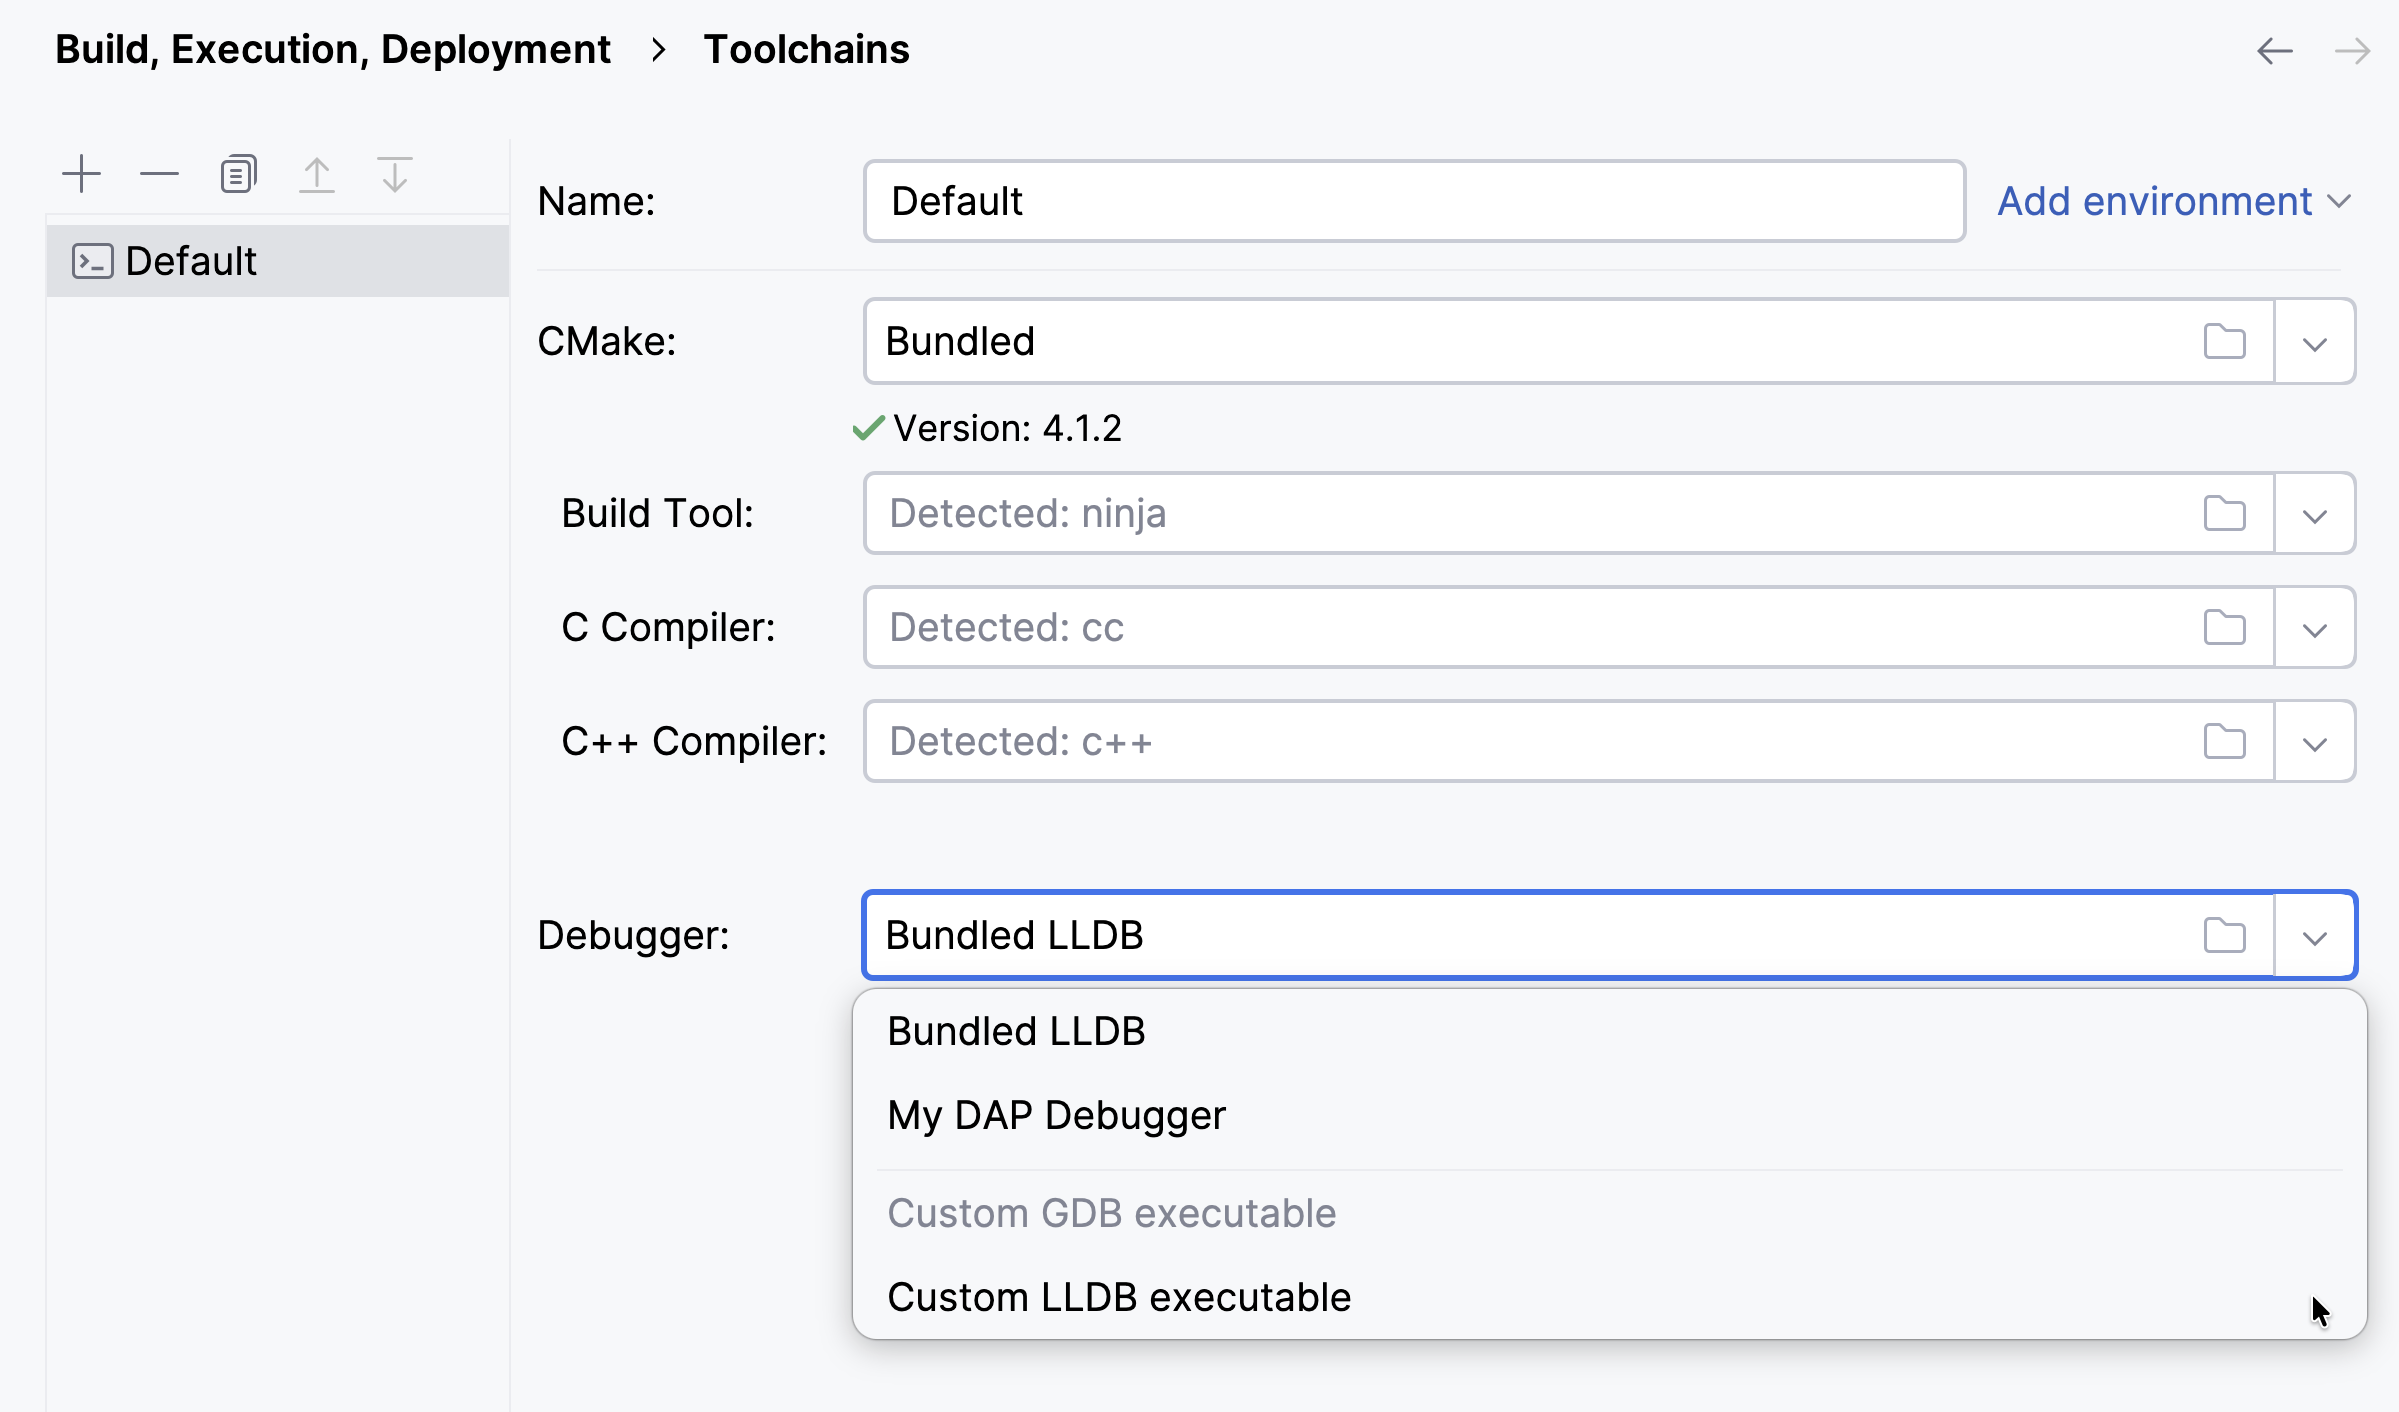
Go to .
In the Debugger field on the right pane, select the debugger for the current toolchain:
Debugger data views
In the dialog, you can customize the C/C++ data representation.
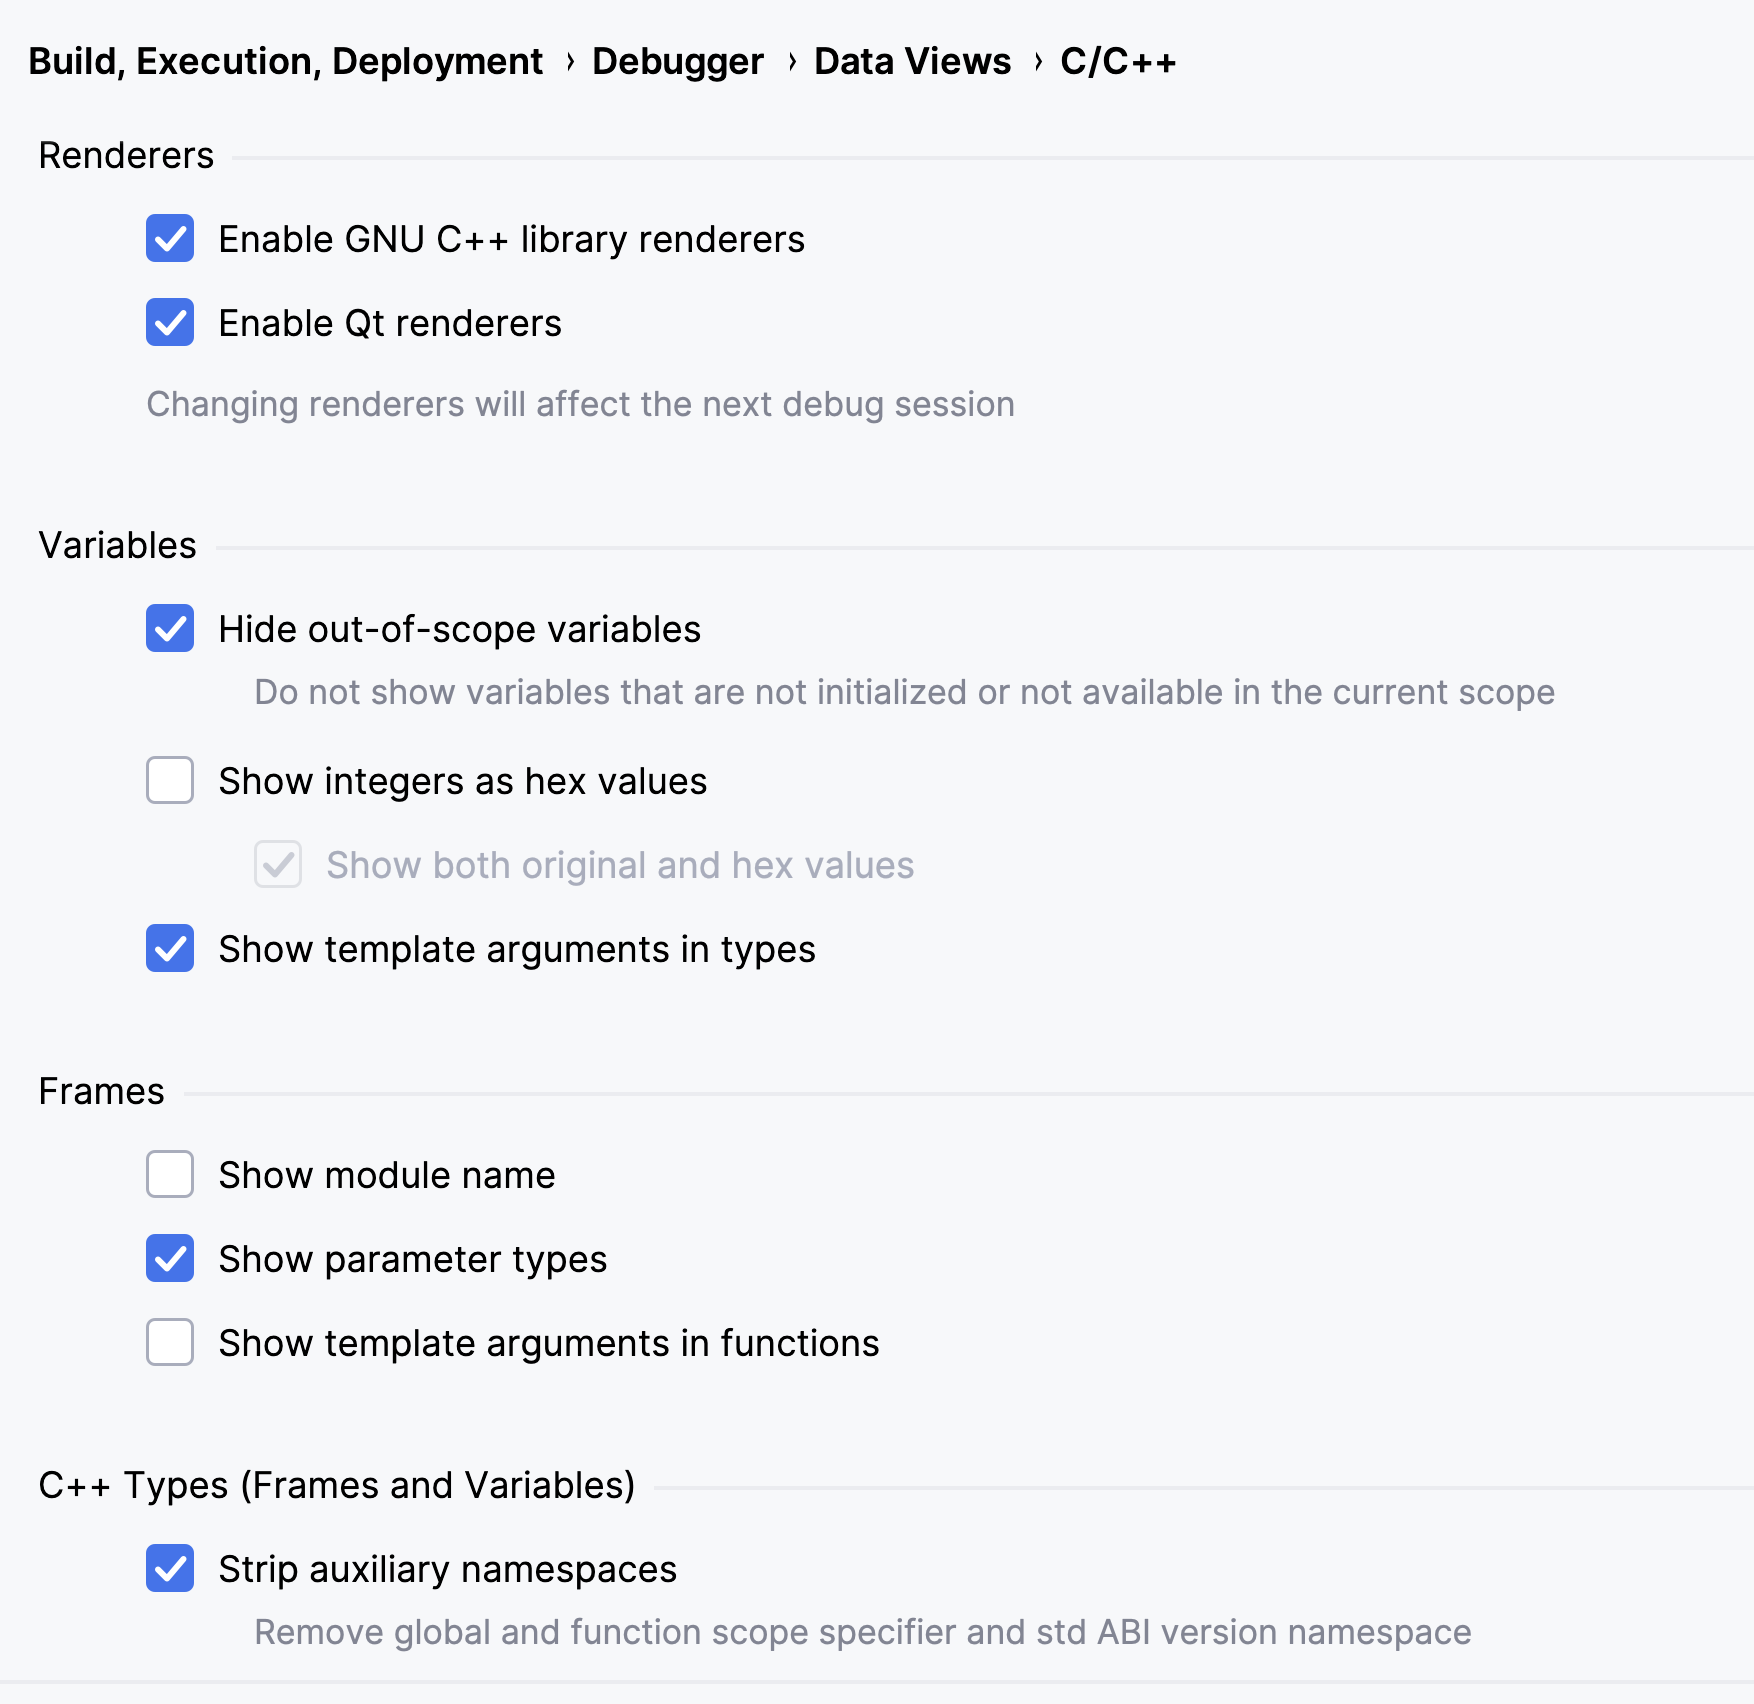
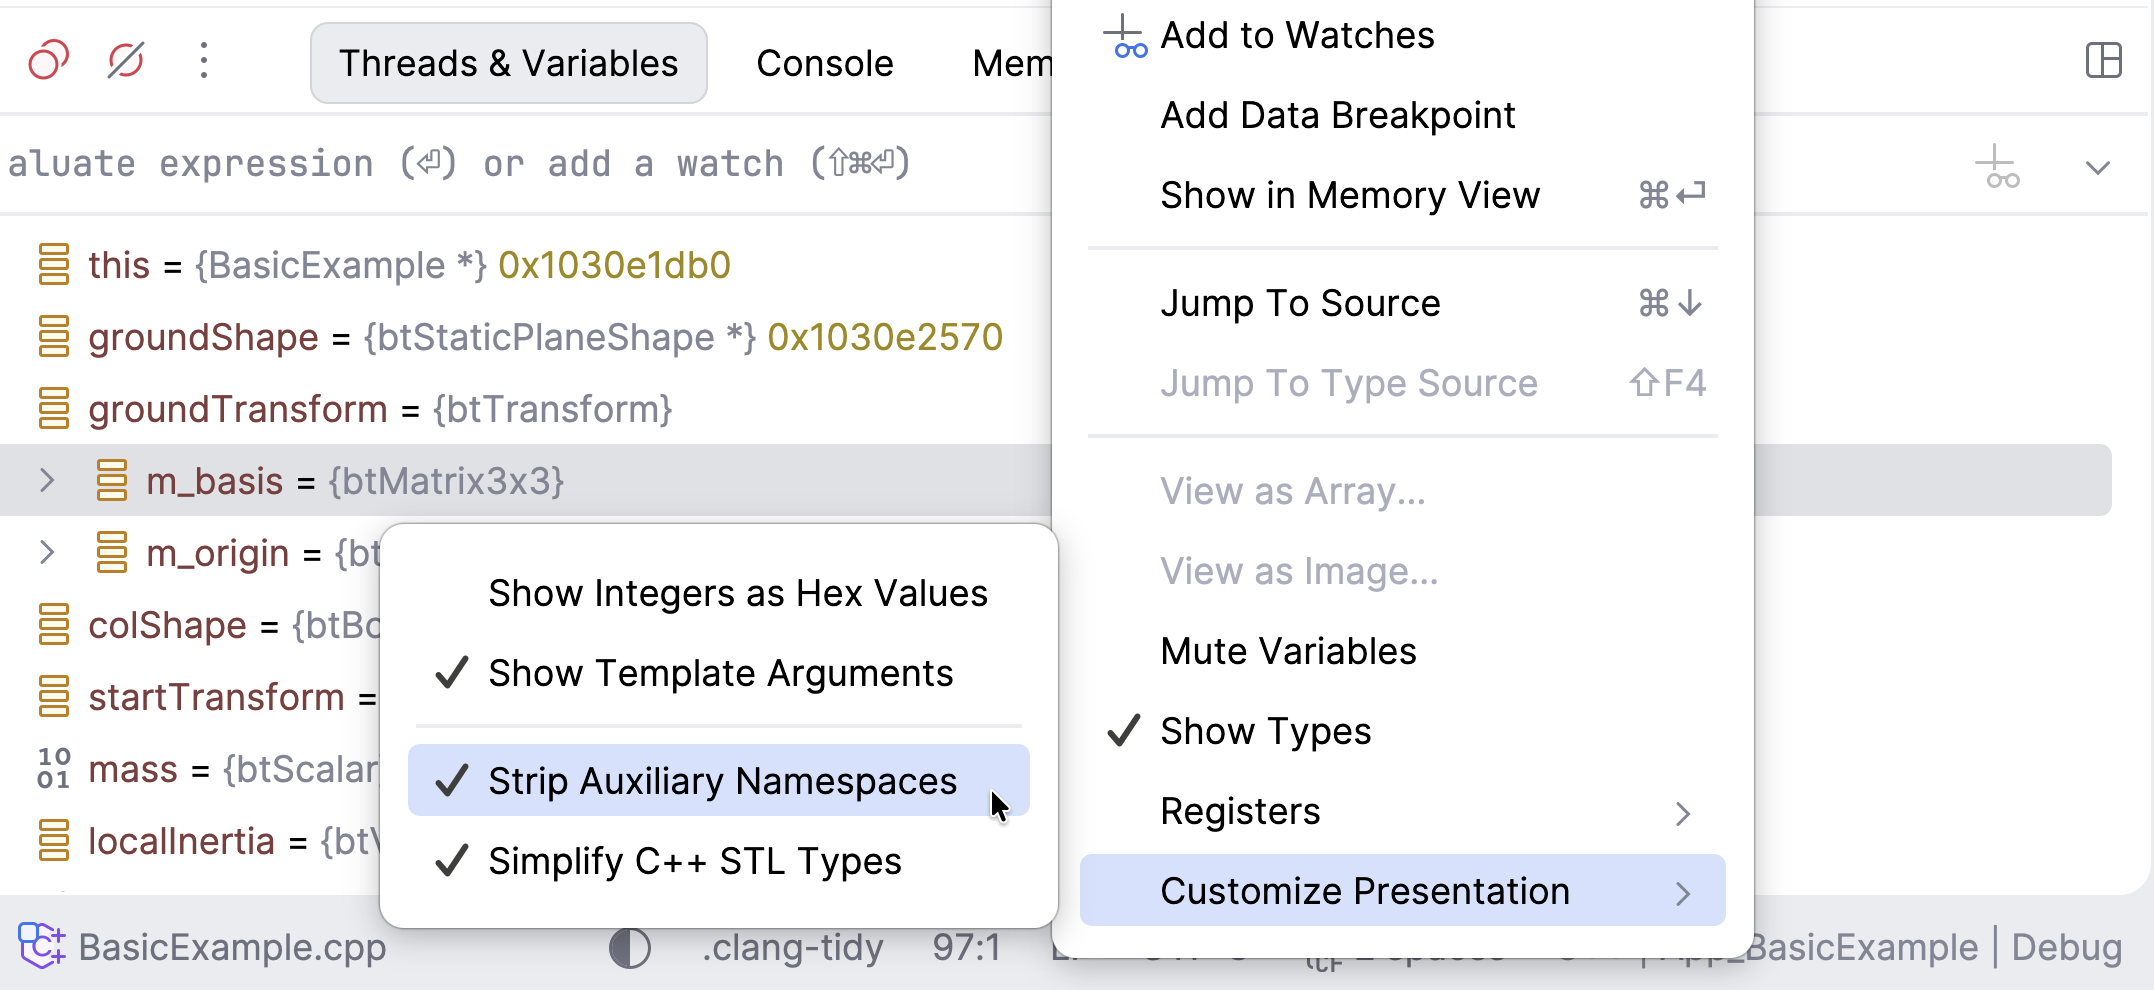
Here you can control the standard library types rendering, module names, function parameter types and function template arguments, and other options. Alternatively, use the context menu in the Debug tool window, in the Frames view and in the Variables view:
STL containers rendering
When you set the Enable GNU library renderers checkbox, this affects rendering STL containers by GDB when using the gcc compiler. In the case of clang used in pair with GDB, this option works for libstdc++ only (for more information, refer to next chapter).
Currently this option is not applicable to LLDB. Check how LLDB (starting from version 9.0) handles libc++ and libstdcxx in LLDB STL formatters below.
LLDB STL formatters
Lists given below are accurate for LLDB version 9.0.
Type | libcxx | libstdc++ |
|---|---|---|
string |
|
|
array |
|
|
vector |
|
|
deque |
|
|
list |
|
|
forward list |
|
|
set |
|
|
map |
|
|
multiset |
|
|
multimap |
|
|
unordered_set |
|
|
unordered_map |
|
|
unordered_multiset |
|
|
unordered_multimap |
|
|
stack |
|
|
queue |
|
|
priority_queue |
|
|
STL renderers for GDB on macOS
Combination of GDB as the debugging backend and Clang (the CMake default compiler) implies limitations on viewing the content of STL containers on macOS. As a workaround, try the following instructions.
Use the
libstdc++library instead oflibc++. To includelibstdc++in your project, add the following command in CMakeLists.txt:set(CMAKE_CXX_FLAGS "${CMAKE_CXX_FLAGS} -stdlib=libstdc++")Alternatively, go to and specify the library in the CMake options field:
-DCMAKE_CXX_FLAGS="-stdlib=libstdc++"We also recommend you use the dwarf3 debug info format. For this, add the following commands to your CMakeLists.txt:
set(CMAKE_CXX_FLAGS_DEBUG "${CMAKE_CXX_FLAGS_DEBUG} -gdwarf-3") set(CMAKE_C_FLAGS_DEBUG "${CMAKE_C_FLAGS_DEBUG} -gdwarf-3")
Custom .gdbinit/.lldbinit files
If your project requires more configuration options for debugging, you can create a custom initialization file, .gdbinit for GDB or .lldbinit for LLDB, and place it under the project root. This file can be shared through VCS along with other project files.
Generally, GDB/LLDB loads several initialization files in certain order during startup. First, the debugger looks for an initialization file in the user's home directory, then for a file in the current working directory (your project root).
By default, commands from project-specific init files are not executed for security reasons. To allow that, modify the init file in your home directory as described below.
Enable reading project-specific .gdbinit/.lldbinit
Set permissions in the ~/.gdbinit file.
With GDB 11.1 and newer, you can use $HOME/.config/gdb/gdbinit or $HOME/Library/Preferences/gdb/gdbinit instead.
When working with WSL, edit the .gdbinit file located in WSL's home directory, /home/[user]/.gdbinit.
For all projects
set auto-load local-gdbinit on add-auto-load-safe-path /For a particular project
set auto-load local-gdbinit on add-auto-load-safe-path [full path to the project root]/.gdbinit
Set permissions in the home ~/.lldbinit file:
Adjusting GDB timeout values
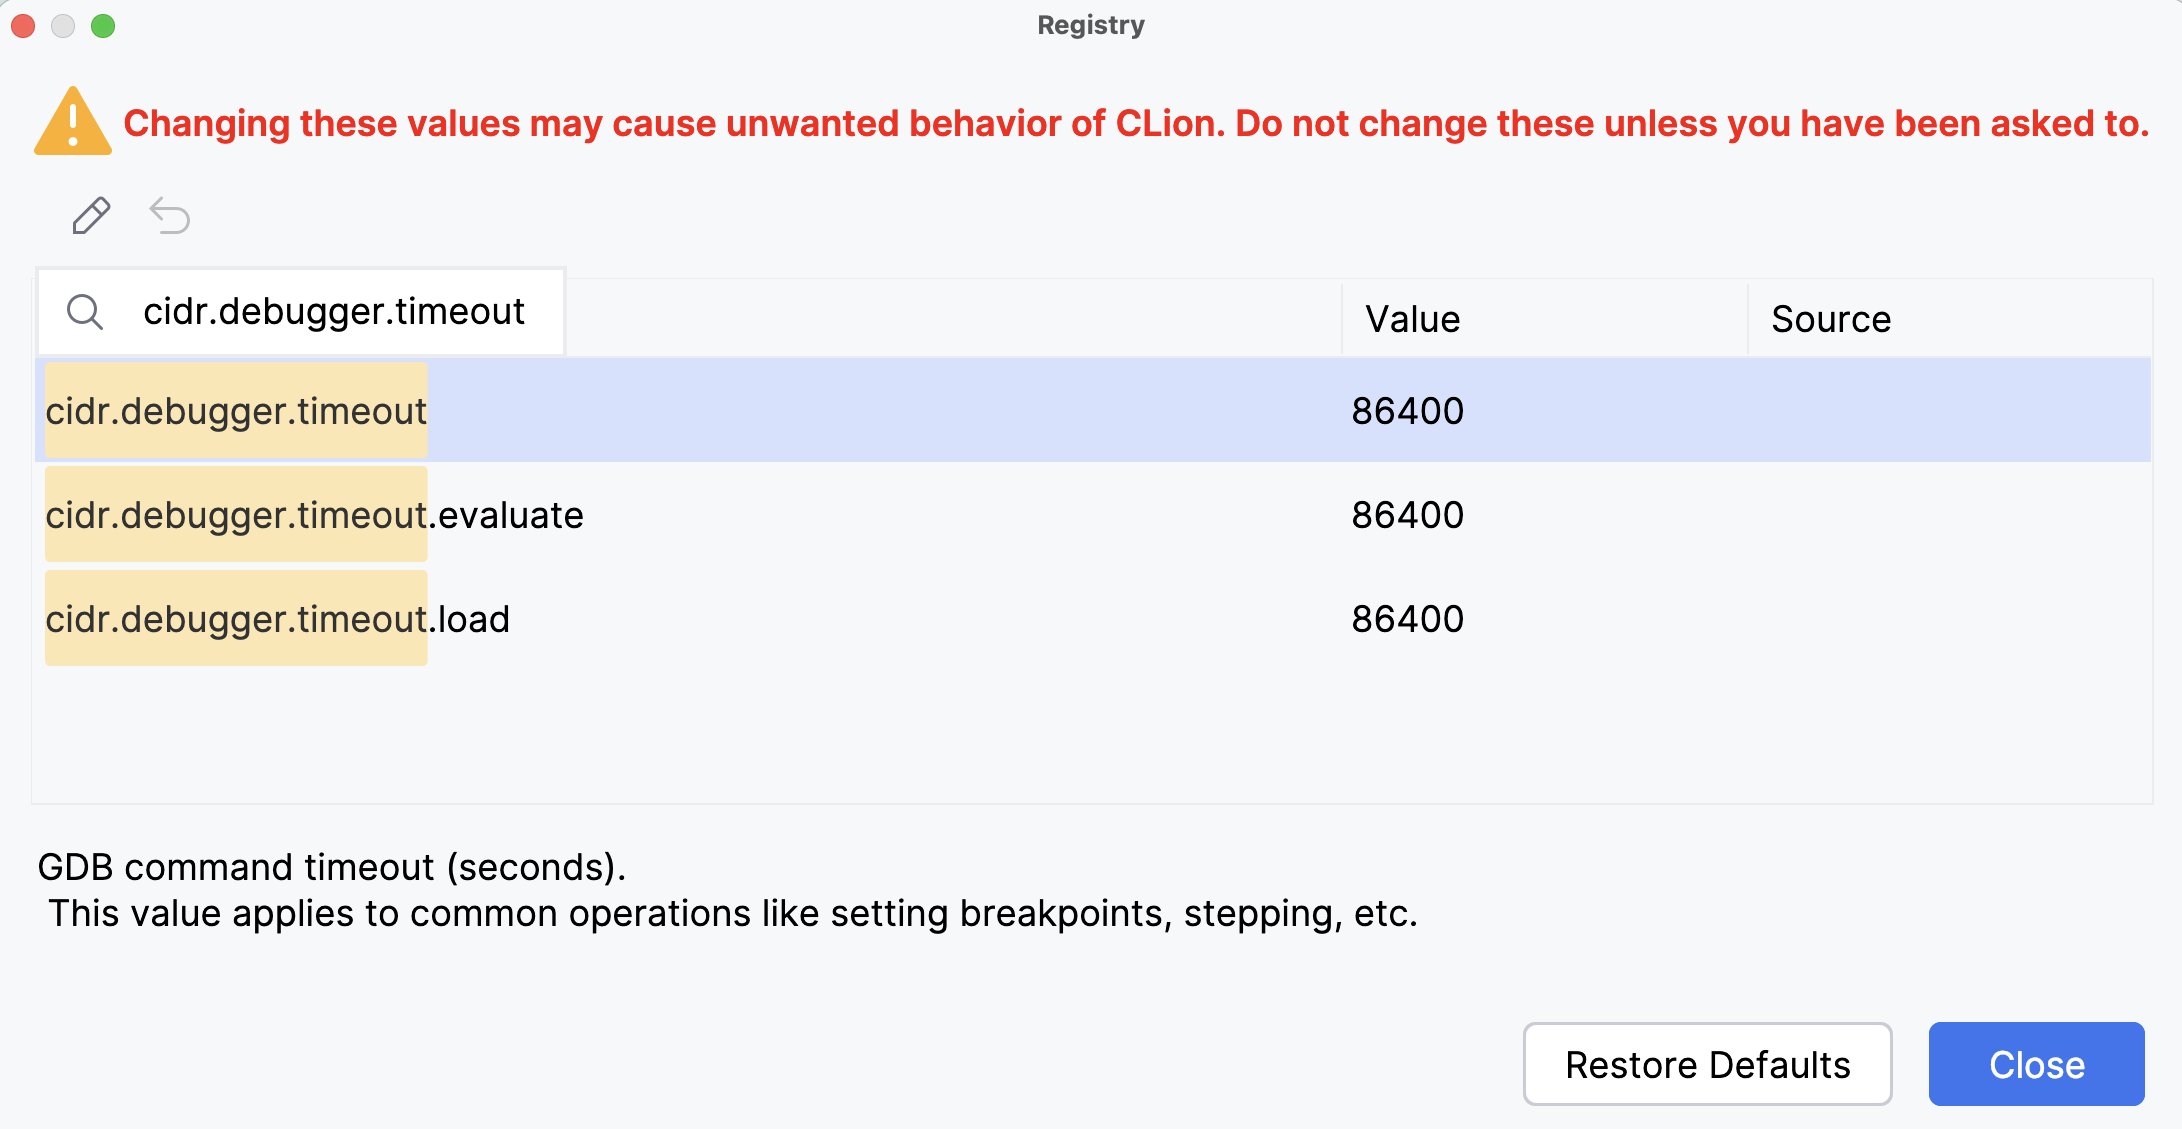
You can control the GDB timeout values by setting the corresponding properties in CLion registry.
Press Ctrl+Shift+A or choose from the main menu. In the popup that opens, start typing
Registry, select the corresponding item and press Enter.
In the dialog that opens, start typing cidr.debugger.timeout. Click the Value field of the highlighted string and enter the timeout value in milliseconds.
Configuring external GDB console on Windows
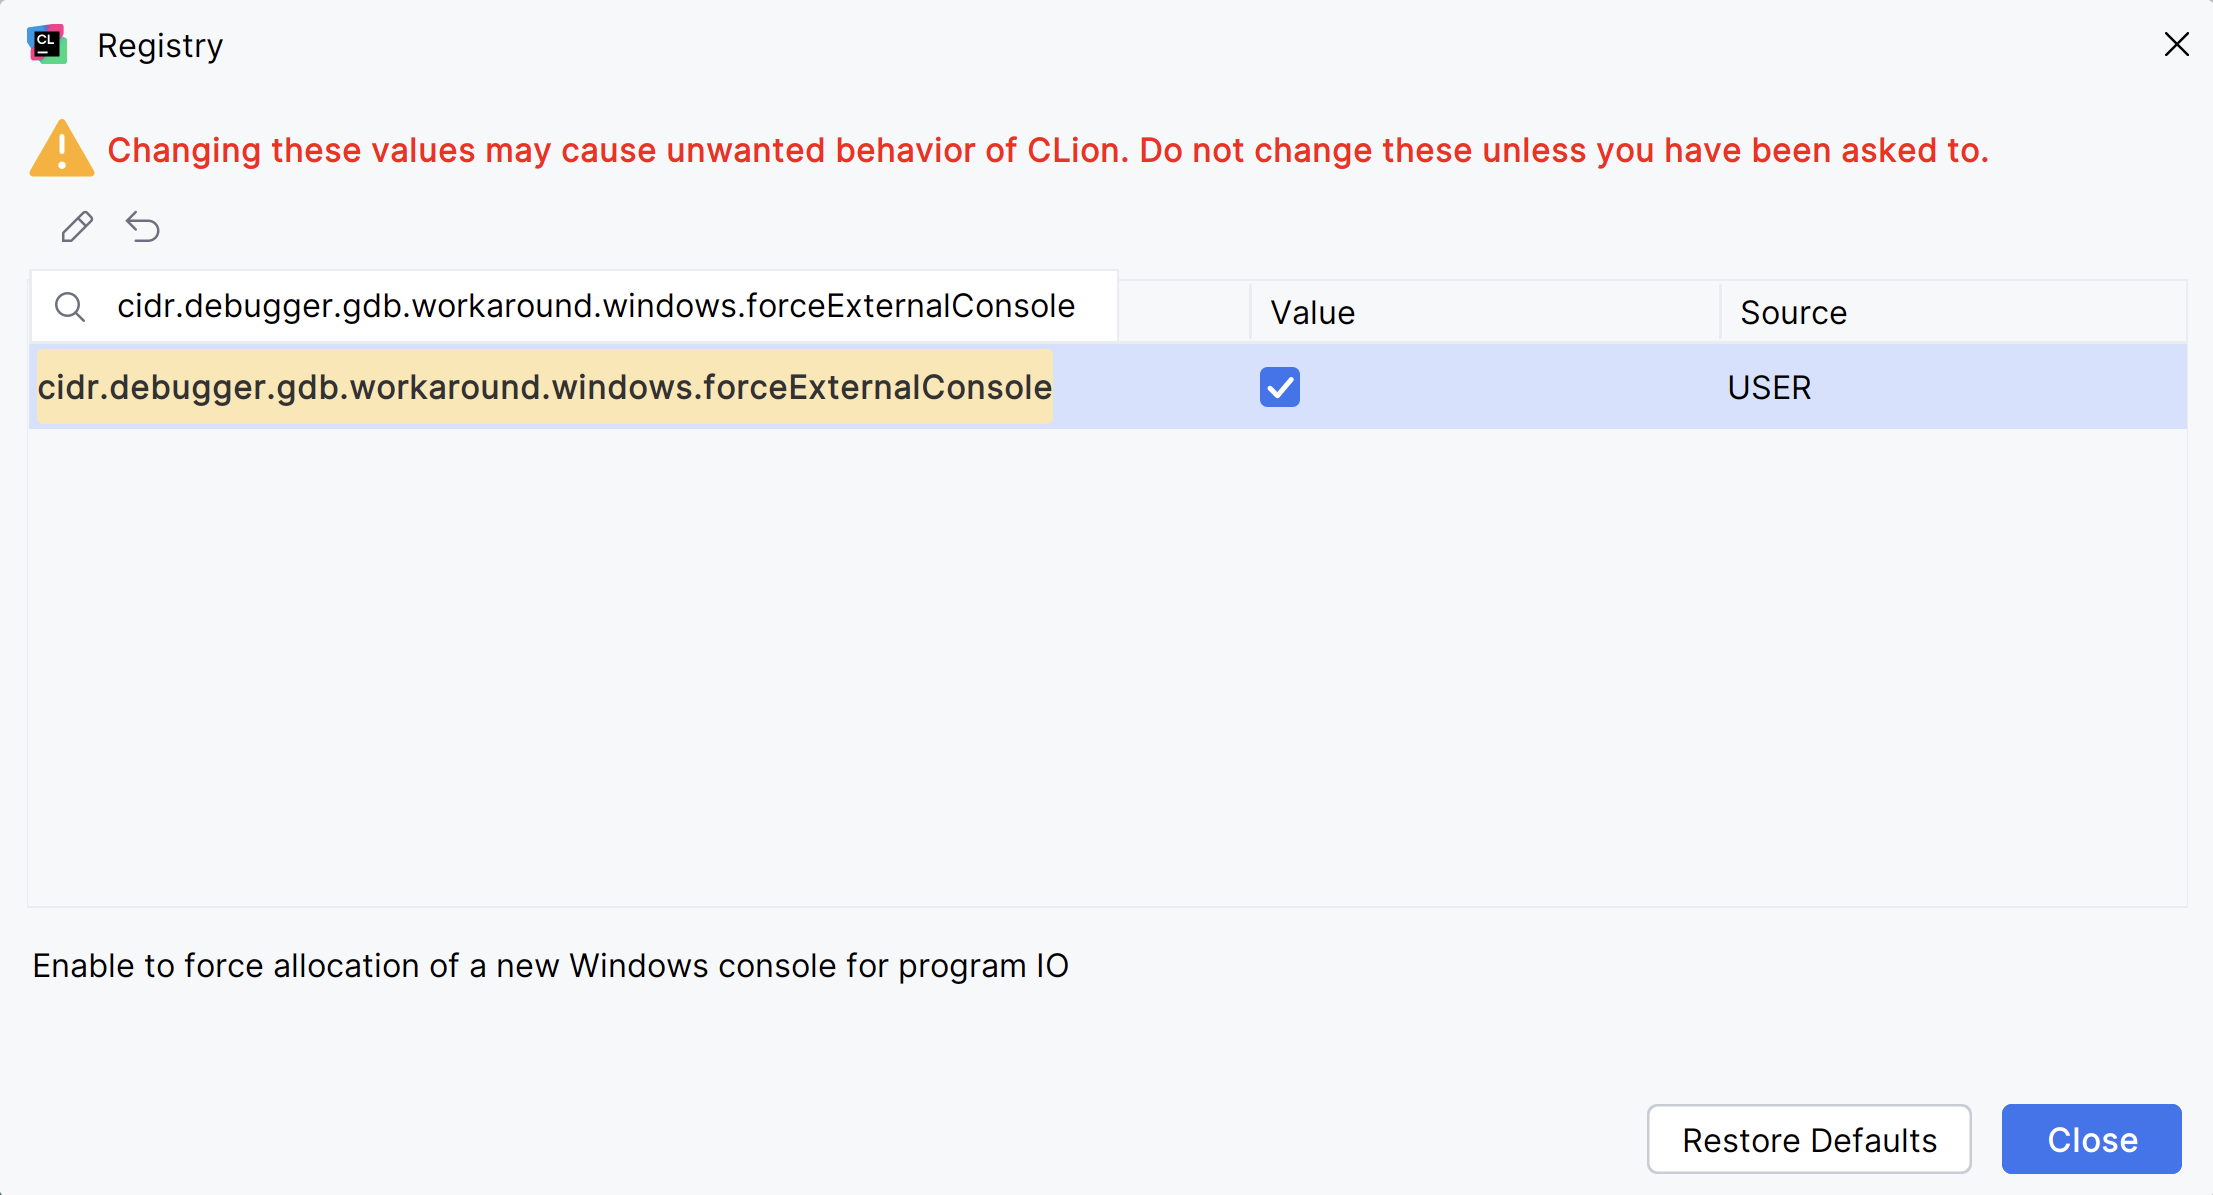
On Windows with GDB versions prior to 8.0, a separate console is used for application input/output. For the newer GDB versions, the output is redirected to CLion console by default. However, you can switch back to opening an external output window.
Press Ctrl+Shift+A or choose from the main menu. In the popup that opens, start typing
Registry, select the corresponding item and press Enter.
In the dialog that opens, start typing cidr.debugger.gdb.workaround.windows.forceExternalConsole. Click the Value field of the highlighted string.
Compile-time evaluations
The Constexpr Debugger gives you a compiler's perspective on what is really happening – by stepping through evaluation, inspecting values, and confirming which if constexpr branch fired. The tool helps you understand exactly what the compiler is doing and fix issues faster.