Debug Adapter Protocol
Besides LLDB and GDB, CLion can work with third-party debuggers that support the Debug Adapter Protocol (DAP). The DAP technology enables CLion to interact with various debugger implementations through a standardized interface. Ultimately, CLion’s DAP support provides a consistent debugging experience when using a new, non-LLDB/GDB debugger that supports this protocol.
Configure a DAP debugger
Go to and then click + to add a new DAP profile or the corresponding icon in the section.
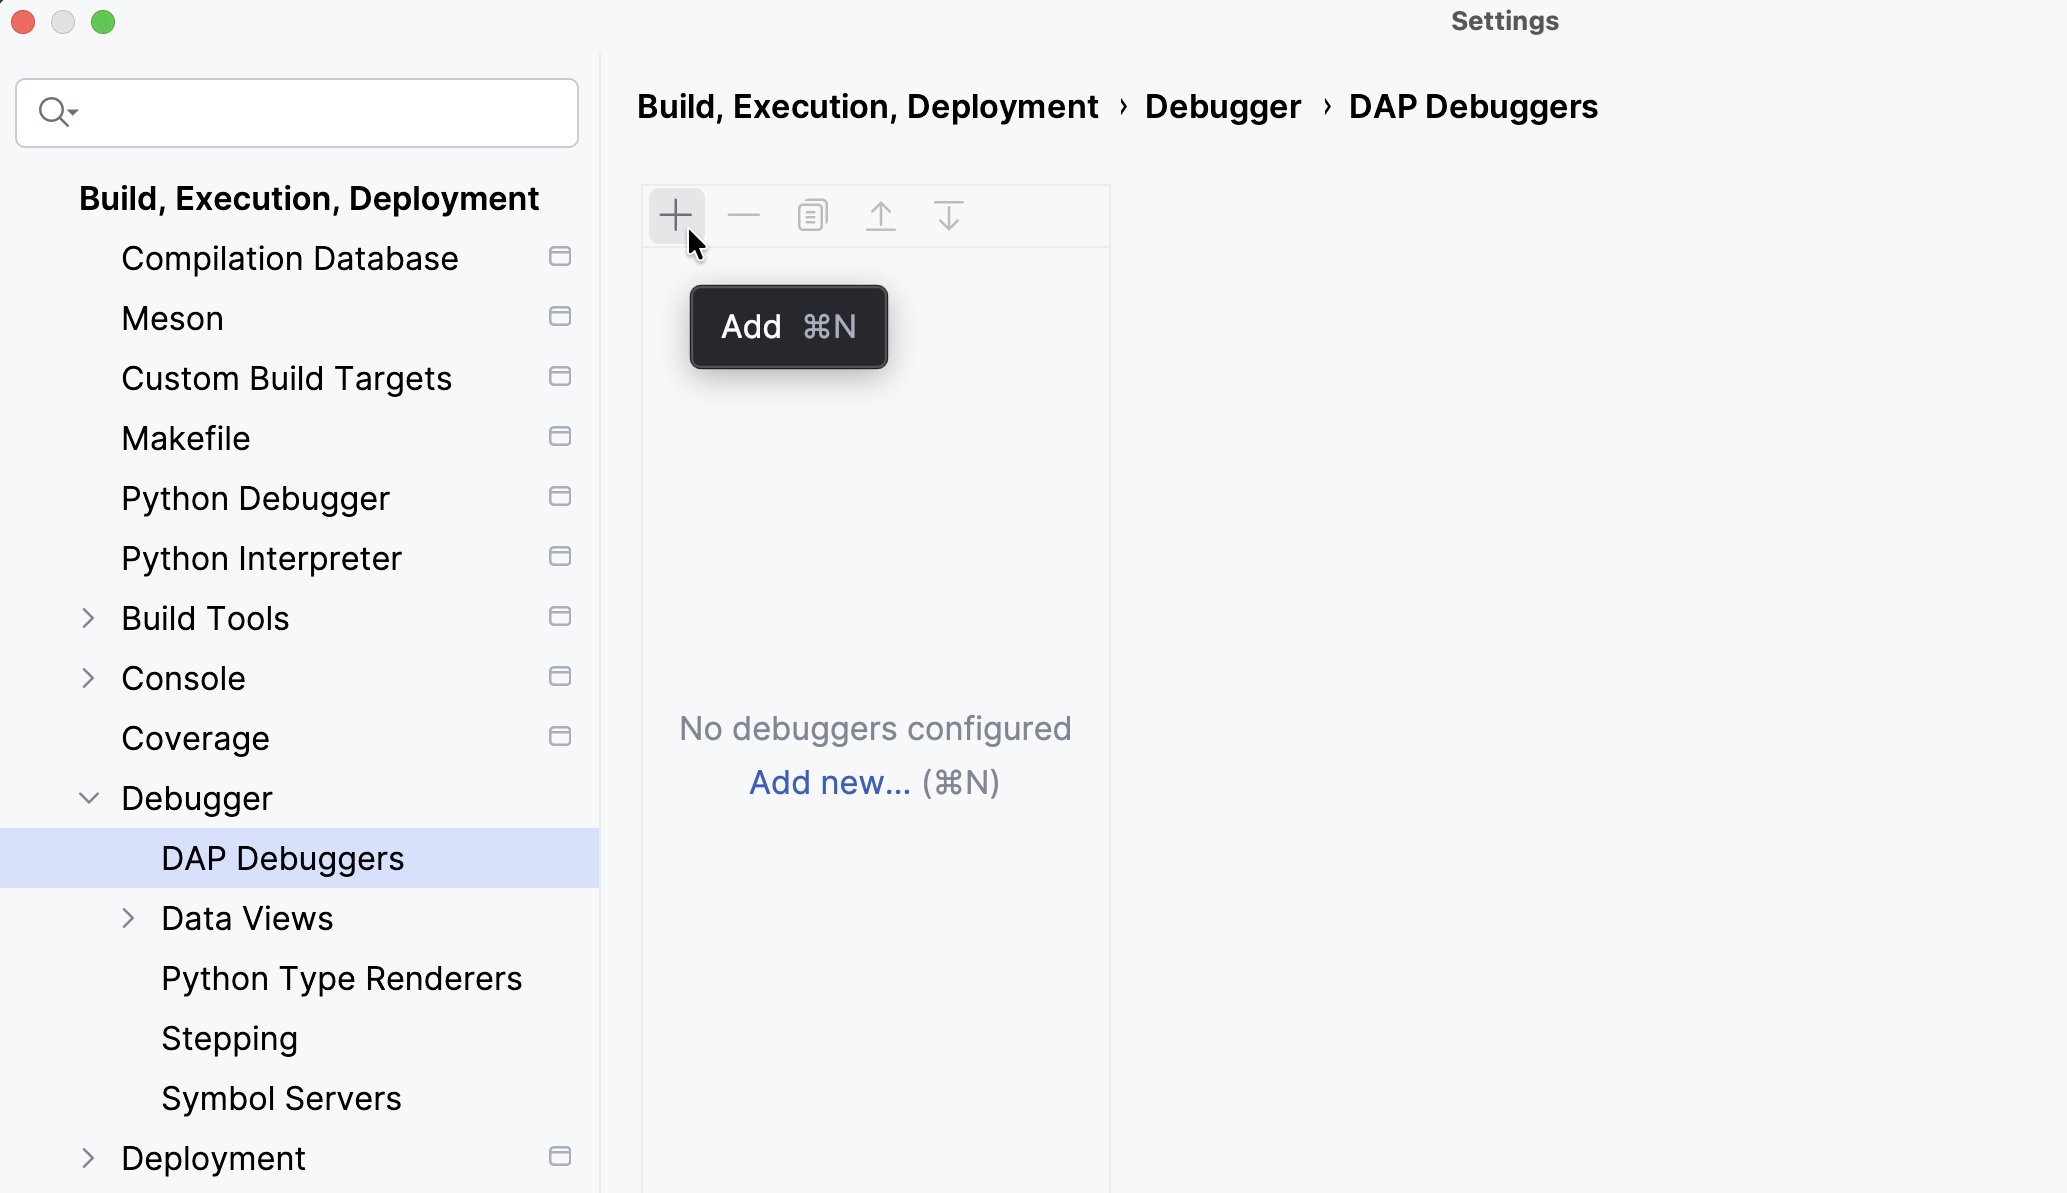
Specify your DAP debugger’s name, path to the executable, arguments, and other parameters. Then, click Apply.
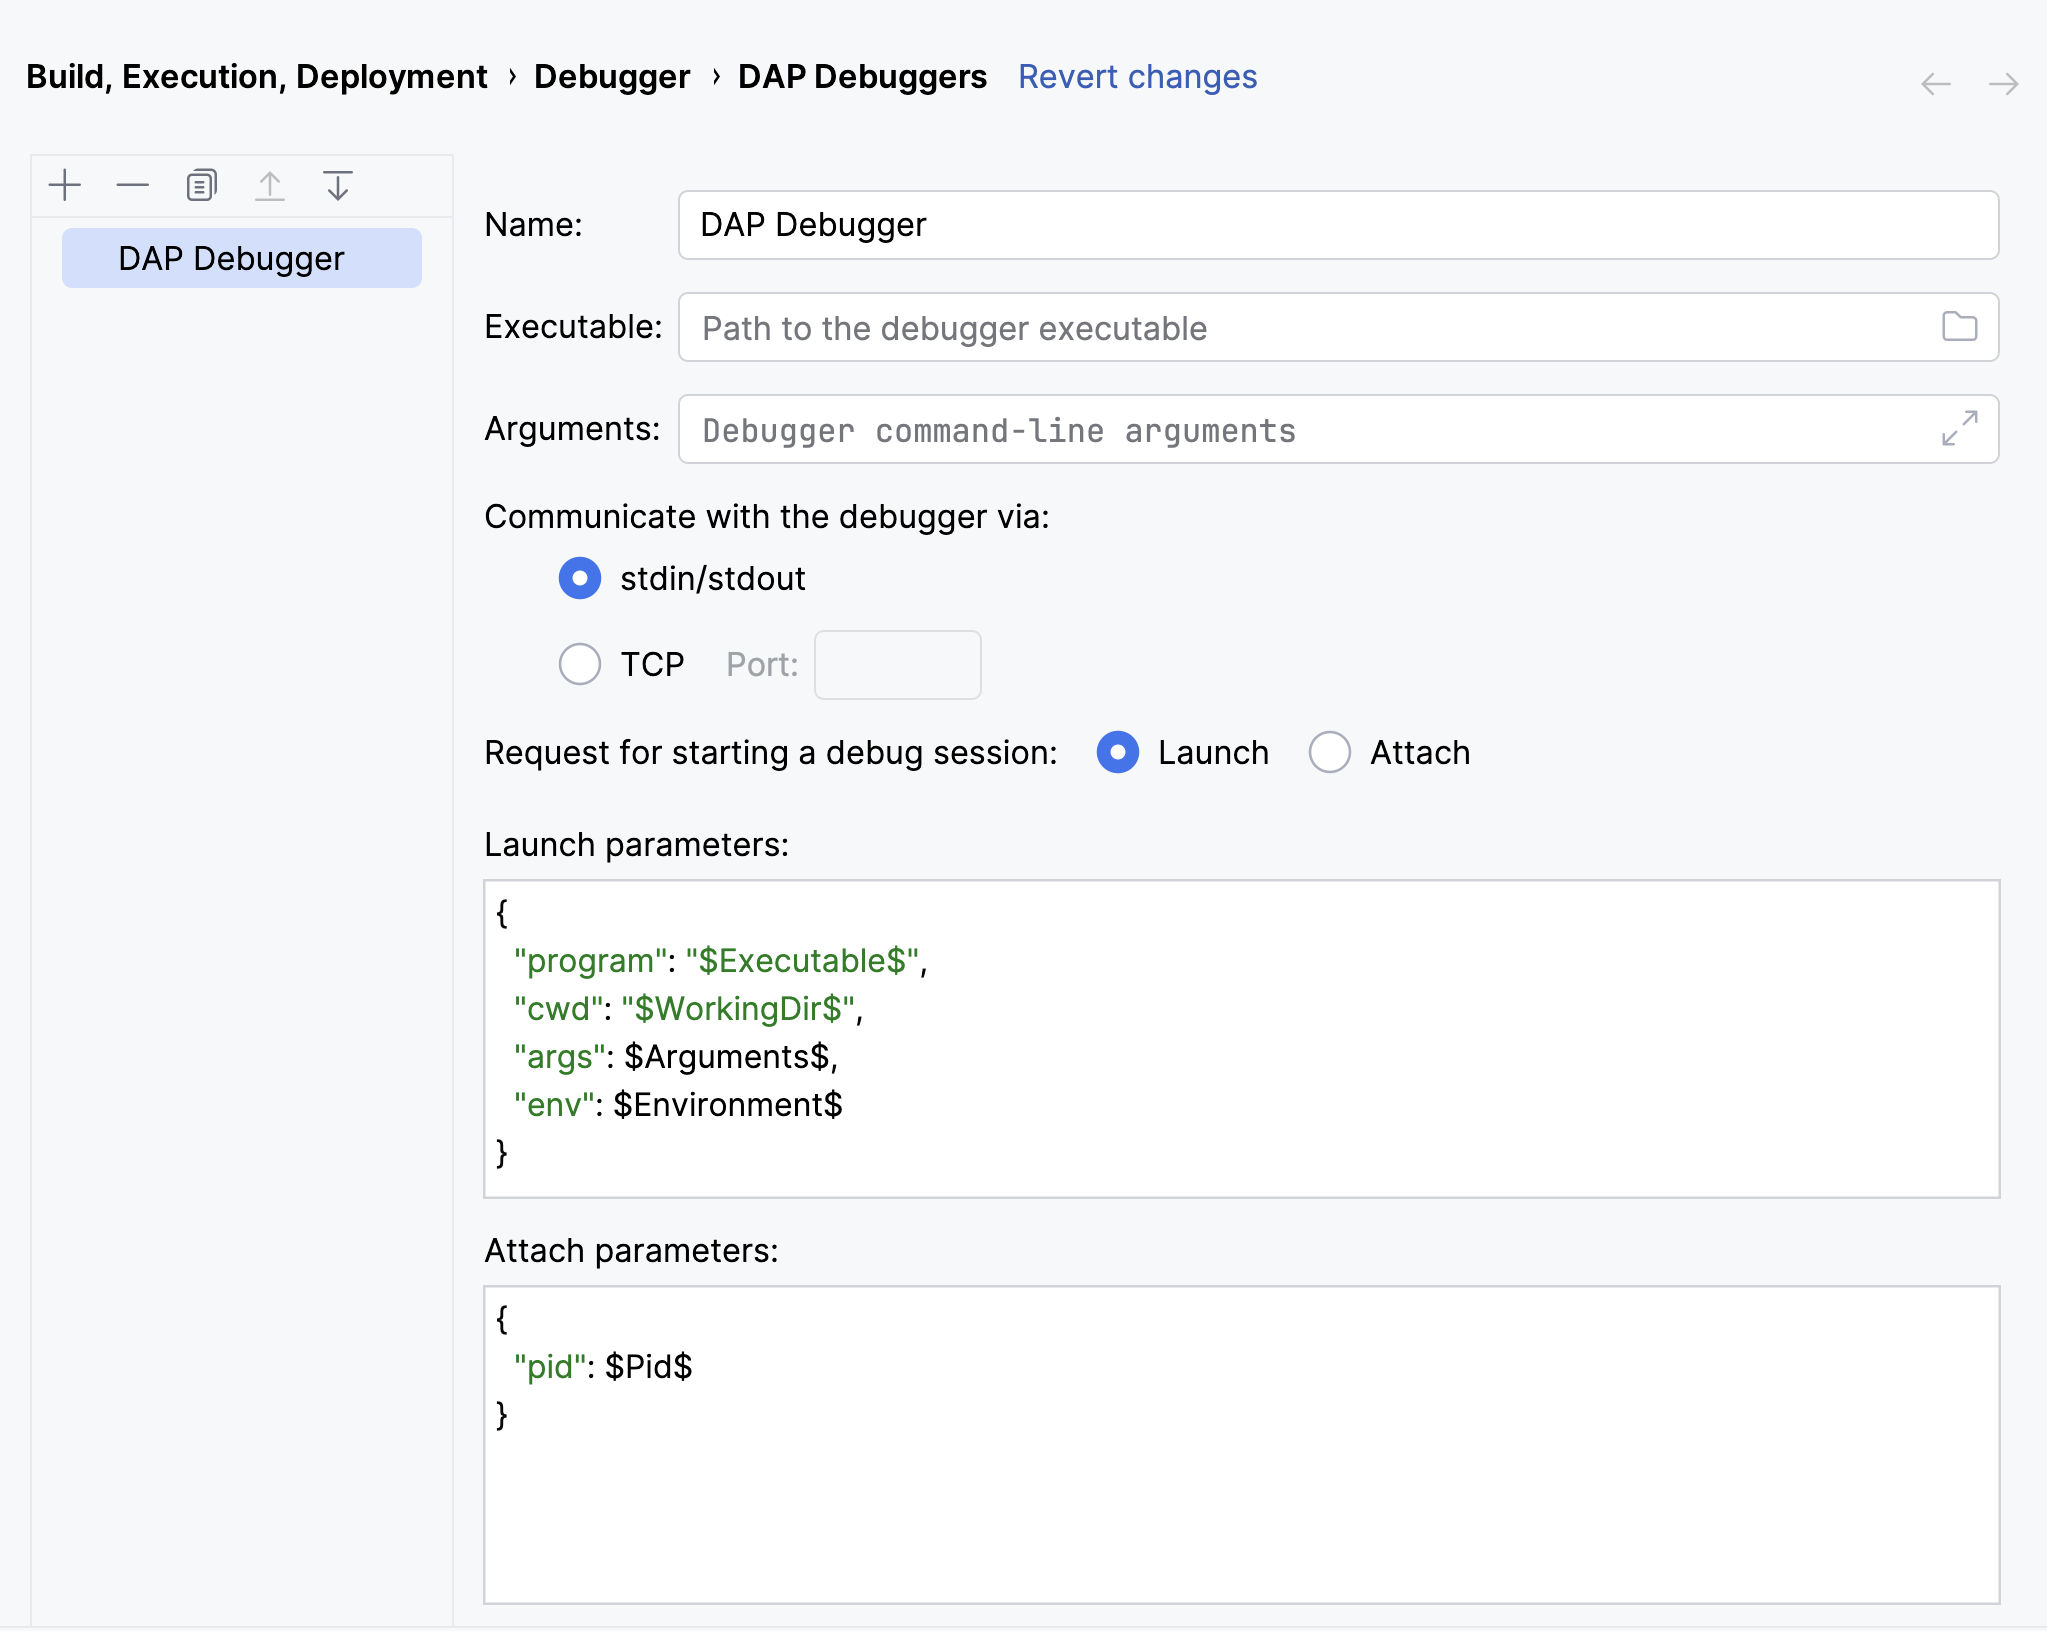
You can choose between communication over standard input/output (
stdin/stdout) or over TCP. If is selected, you need to specify a port to connect to.Keep the following in mind when configuring a DAP debugger:
You can use the
$DebuggerPort$macro in different fields, such as DAP executable command-line arguments or /, to insert the TCP port number specified in the field.When you attach to a running process, the IDE always sends the request. When you run a program with the debugger by clicking the
 icon in the toolbar, the IDE sends the request. Most DAP debuggers expect the request to start a debug session with the given executable. However, if your debugger requires the request instead, you can configure the IDE to send it when starting a debug session.
The and are debugger-specific. CLion prefills them with sensible defaults that work for both GDB and LLDB. However, we recommend consulting the documentation for your specific debugger to determine which JSON parameters to use. CLion currently supports the
$Executable$,$WorkingDir$,$Arguments$,$Environment$, and$EnvironmentArray$macros in and the$Pid$macro in . Code completion works for available macros and shows their meanings.
On the main toolbar, select your DAP debugger.
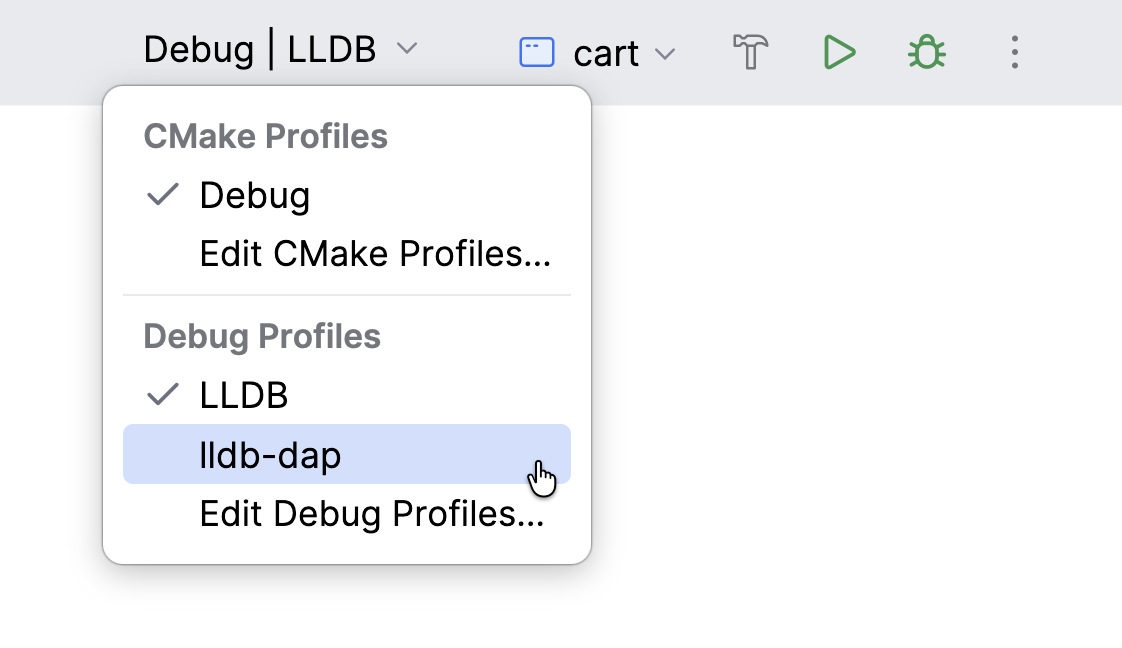
You can now perform standard debugger actions.
Troubleshoot a DAP debugger
If a DAP debugger does not start or behaves unexpectedly, enable debugger logging and reproduce the problem. With the com.jetbrains.cidr.execution.debugger category turned on, idea.log records every DAP request, response, and event exchanged with the adapter. In the log, these entries appear as FINE - #c.j.c.e.debugger, with outgoing messages prefixed out: and incoming messages in::
When the adapter cannot be launched or connected to, CLion reports the Failed to initialize DAP server error in the IDE. The reason is in the traffic: compare it with a successful start, which contains a response to initialize, a response to launch or attach, the initialized event, and a response to configurationDone. The step that is missing or reports "success": false is where the handshake broke down.