Debug profiles
A debug profile defines how CLion debugs your application: which debugger to use and how it is configured. A profile is reusable and independent of the toolchain, so you can change the debugger without changing how your project is built.
Each debug profile is separate from the CMake profile and the run/debug configuration:
The CMake profile (and its toolchain) defines how your project is built.
The run/debug configuration defines what to run: the target, program arguments, and environment.
The debug profile defines how to debug it: the debugger and its options.
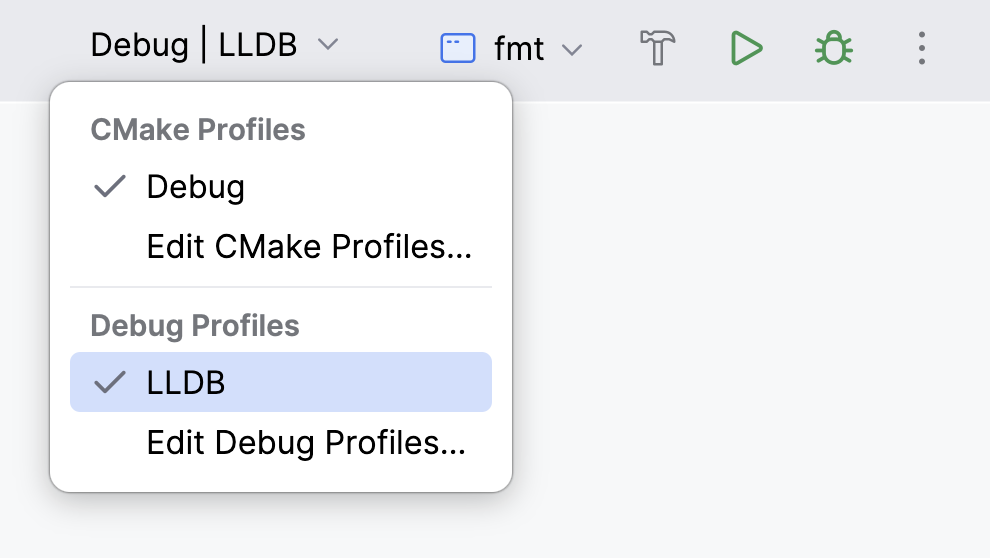
You select the active CMake profile and the active debug profile separately in the main toolbar, so you can pair any build with any compatible debugger.
Debug profile types
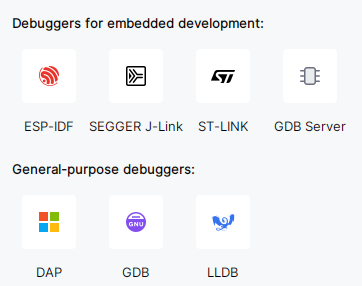
CLion groups the available debugger types into two categories.
General-purpose debuggers:
Debuggers that support the Debug Adapter Protocol (DAP)
Debuggers for embedded development:
GDB Server (a generic
gdbserverprofile)ST-LINK for STM32CubeMX projects
ESP-IDF for ESP-IDF projects
On macOS running on Apple Silicon, a Rosetta GDB profile is also available for debugging x86 targets on the aarch64 host.
Open the Debug Profiles settings
Go to .
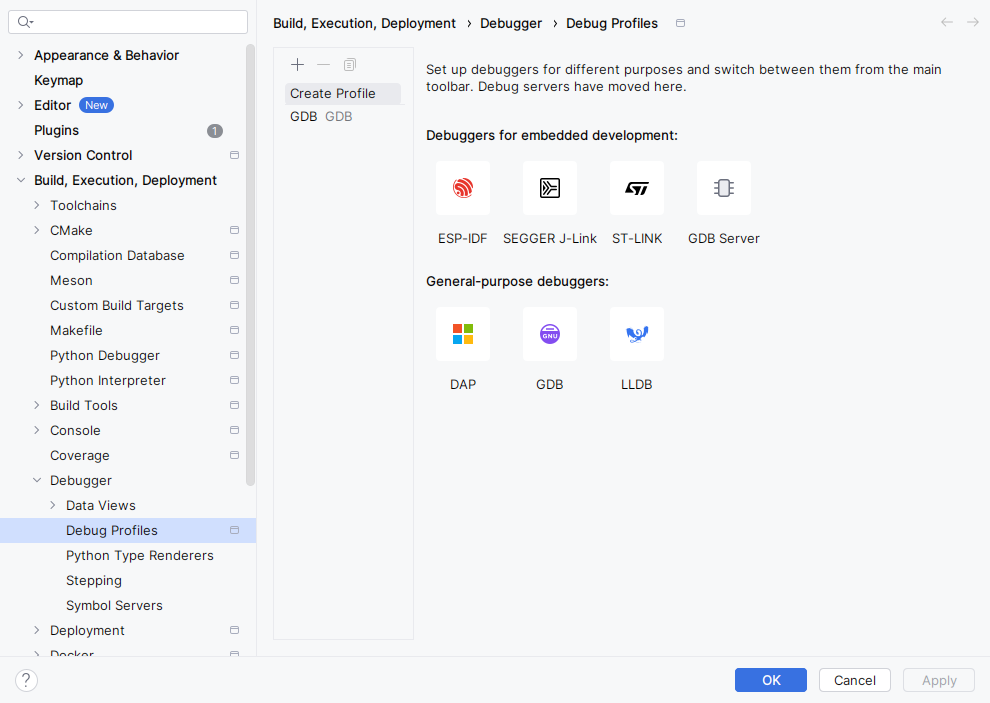
The list on the left shows the existing profiles. The tiles on the right create a new profile of the selected type. CLion detects a default profile for your platform, so the list is not empty on the first run: for example, a GDB profile on Linux or an LLDB profile on macOS.
Create a debug profile
Click the tile of the debugger type you need under General-purpose debuggers or Debuggers for embedded development. CLion adds a new profile of that type to the list.
Configure the profile fields, then click OK.
Configure a general-purpose profile
A GDB or LLDB profile exposes the following fields:
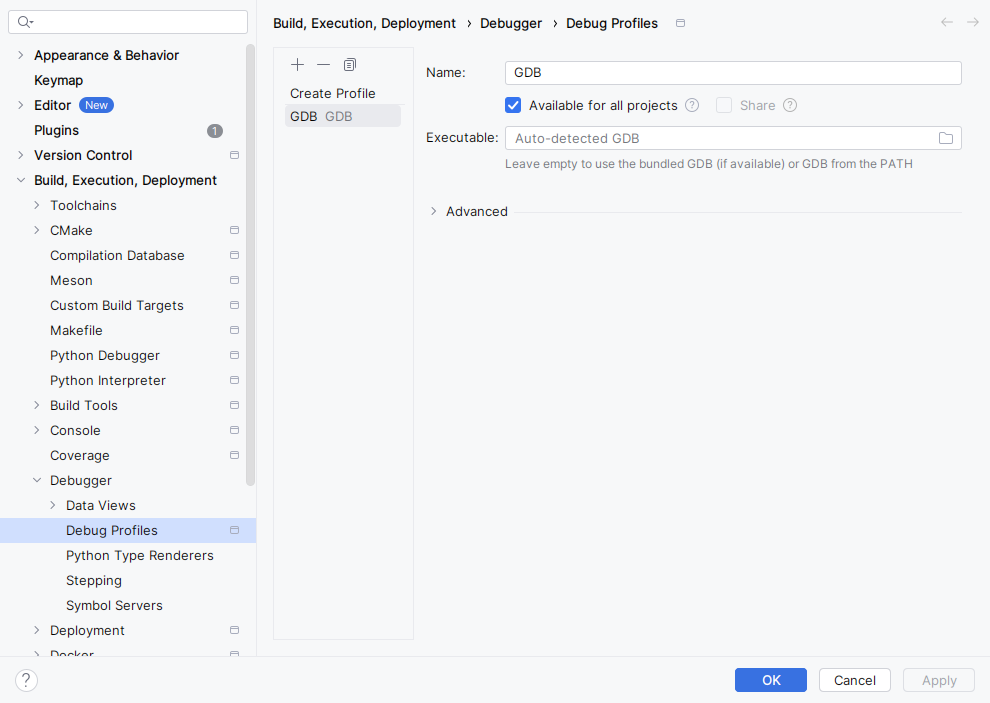
- Name
The profile name shown in the list and in the toolbar switcher.
- Executable
The path to the debugger binary. Leave this field empty to use the bundled GDB or LLDB if available, or the debugger from the
PATH. On a remote, Docker, or WSL toolchain, CLion resolves the debugger from that environment.- Advanced
Type-specific options applied to the debug session. For a DAP profile, use the Launch and Attach tabs to provide the adapter configuration as JSON.
Select the active debug profile
Select the active profile from the debug profile switcher in the main toolbar. The switcher shows the current profile as Debug | <profile> and sits next to the run/debug configuration chooser.
When your project has several CMake profiles, the switcher shows a separate group for CMake profiles and a group for debug profiles. Select one profile from each group: the CMake profile defines the build, and the debug profile defines the debugger. Each group also provides a link to the corresponding settings page.
The debug profile applies to the next debug session you start with  . Running the application with
  does not require a debug profile.
Share a debug profile
By default, a profile is stored in your project. You can change where a profile is stored with two options in the profile settings: Available for all projects and Share.
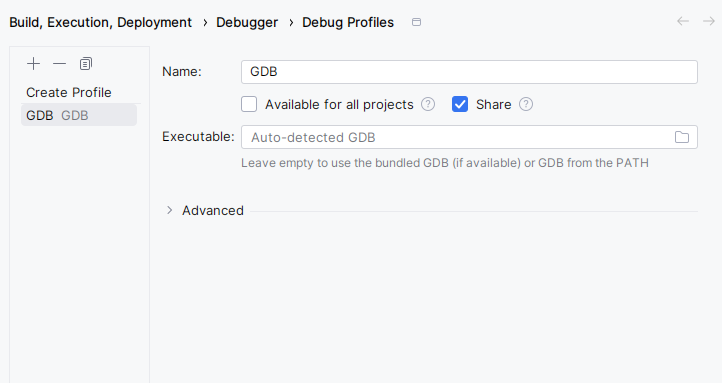
- Available for all projects
Store the profile in the IDE settings and make it usable in every project you open.
- Share
Store the profile in the .idea/debug-profiles.xml file so that you can commit it to version control and share it with your team.
You can use only one of these options at a time: Share is available only while Available for all projects is cleared.
Supported run/debug configurations
You can use debug profiles with the following run/debug configurations:
When you attach to a process, the dialog lists the debug profiles that are compatible with the selected host.
Migration from earlier versions
When you open a project created in CLion 2026.1 or earlier, CLion converts the existing debugger settings into debug profiles once. The conversion covers:
Debuggers set in the toolchain and DAP debuggers, converted into profiles available for all projects.
Custom debuggers used in the Remote Debug and Core Dump Debug configurations, converted into project profiles.
Configured debug servers, converted into project profiles.
The conversion runs only on the first project open and is not repeated afterward, so your profiles are ready to use without extra setup.
Debugger set in the toolchain
The Debugger field in is deprecated in favor of debug profiles.
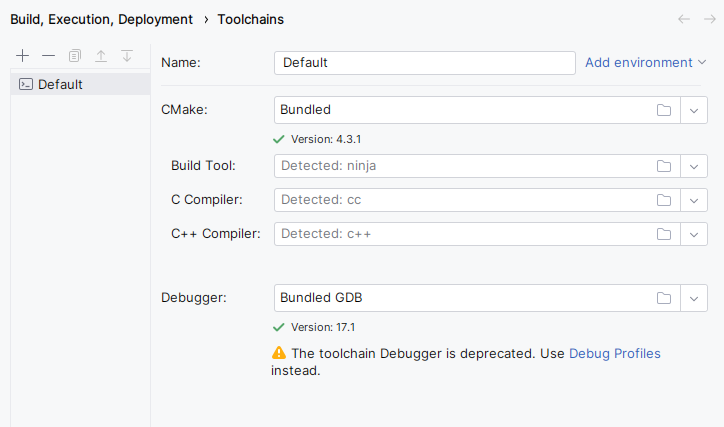
When you start a debug session, CLion uses the selected debug profile instead of the toolchain debugger.