Attach to process
CLion provides a way to attach the debugger to both local and remote processes.
For C/C++ applications, you can attach to a process with GDB or MSVC LLDB on Windows, LLDB on macOS, and both GDB and LLDB on Linux. When applicable, debuggers for other languages (for example, Python debugger) can be used as well.
Prerequisites for Ubuntu
On Ubuntu and some other Linux distributions, you might get the ptrace: Operation not permitted error message upon the first attempt to attach to a process. Do one of the following:
To disable this restriction temporarily, enter the command:
echo 0 | sudo tee /proc/sys/kernel/yama/ptrace_scopeTo disable this restriction permanently, open the /etc/sysctl.d/10-ptrace.conf file for editing and change the line
kernel.yama.ptrace_scope = 1tokernel.yama.ptrace_scope = 0.To apply the changes immediately, enter the above command
echo 0 | sudo tee /proc/sys/kernel/yama/ptrace_scope.Alternatively, run
sudo service procps restartor restart your system.
You can find more details here.
Attach to a running process
Press Ctrl+Alt+F5 or select from the main menu.
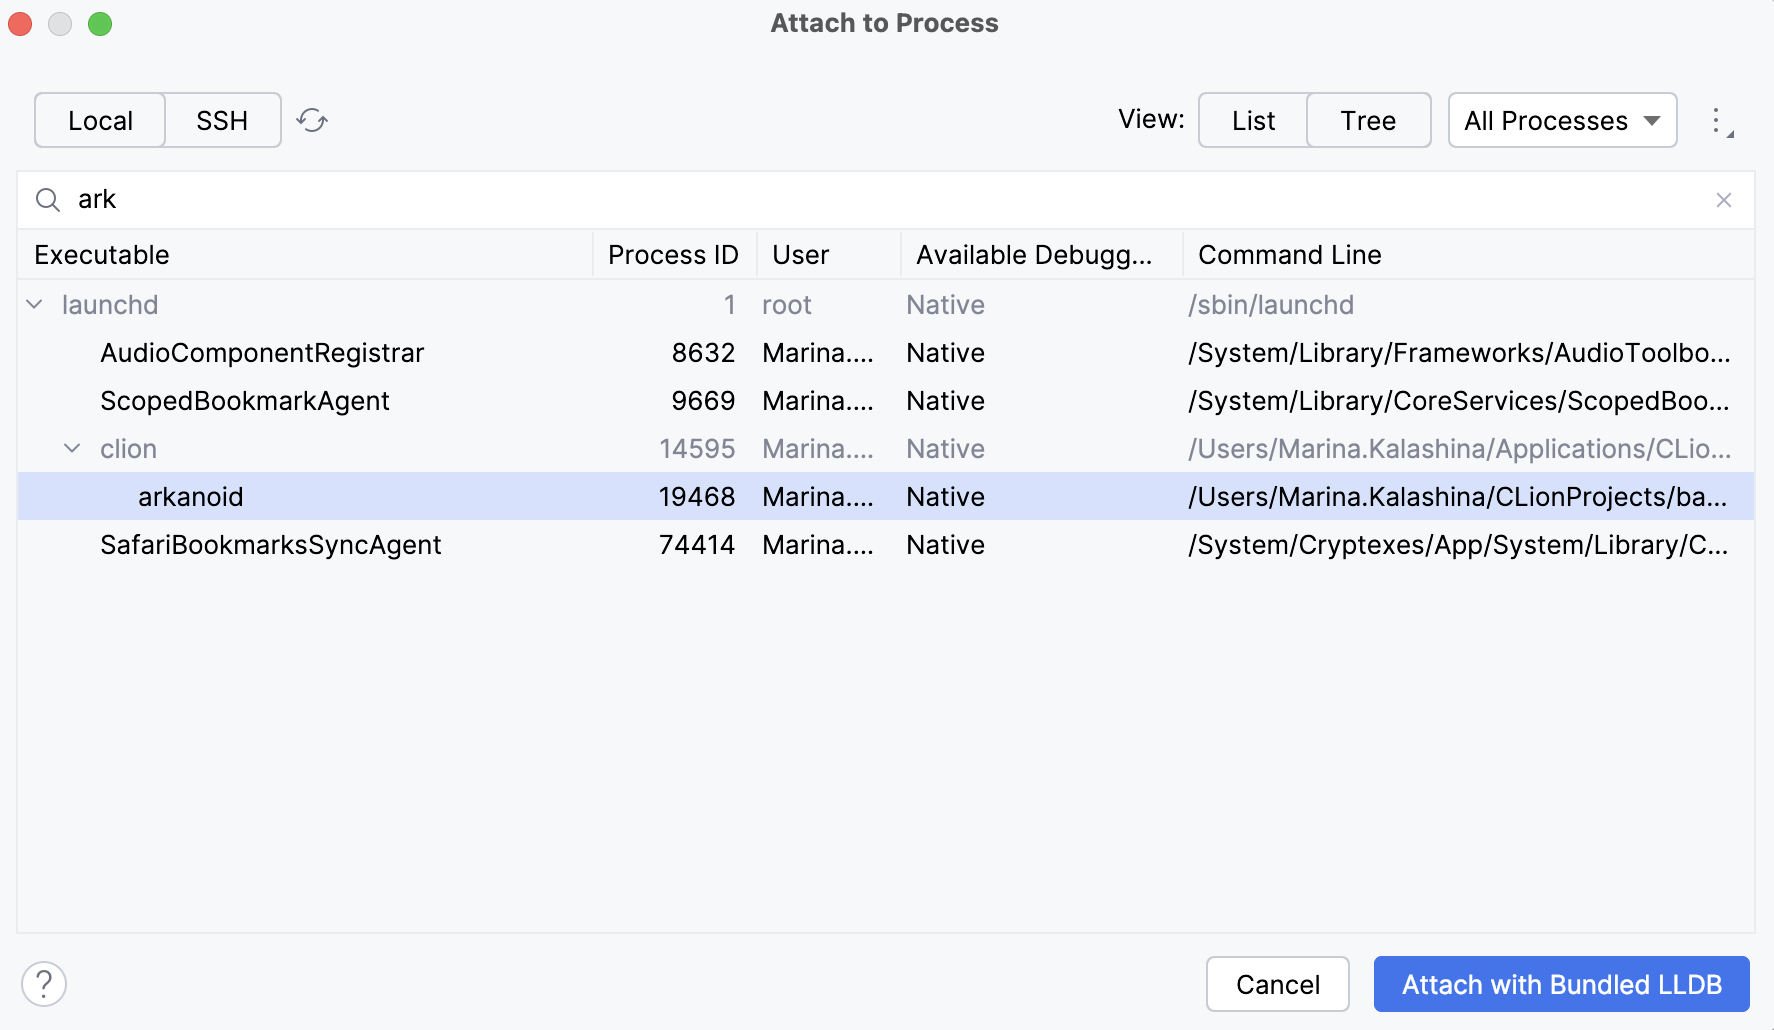
The Attach to Process dialog opens the list of all the detected running processes.
You can view the processes as a list or as a tree and search for a particular process by name:

For each process, you can find the executable name and process ID, the user that launched it, the available debuggers, and the command used for launching.
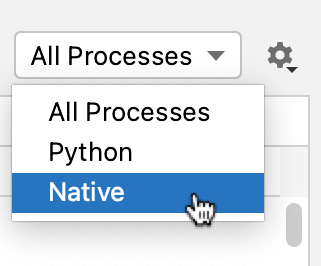
Use the drop-down menu to filter the list of processes by the type of the debugger:

You can also filter the list by setting Show only my processes:

The Local tab shows the list of local processes. Select the process and click Attach with....
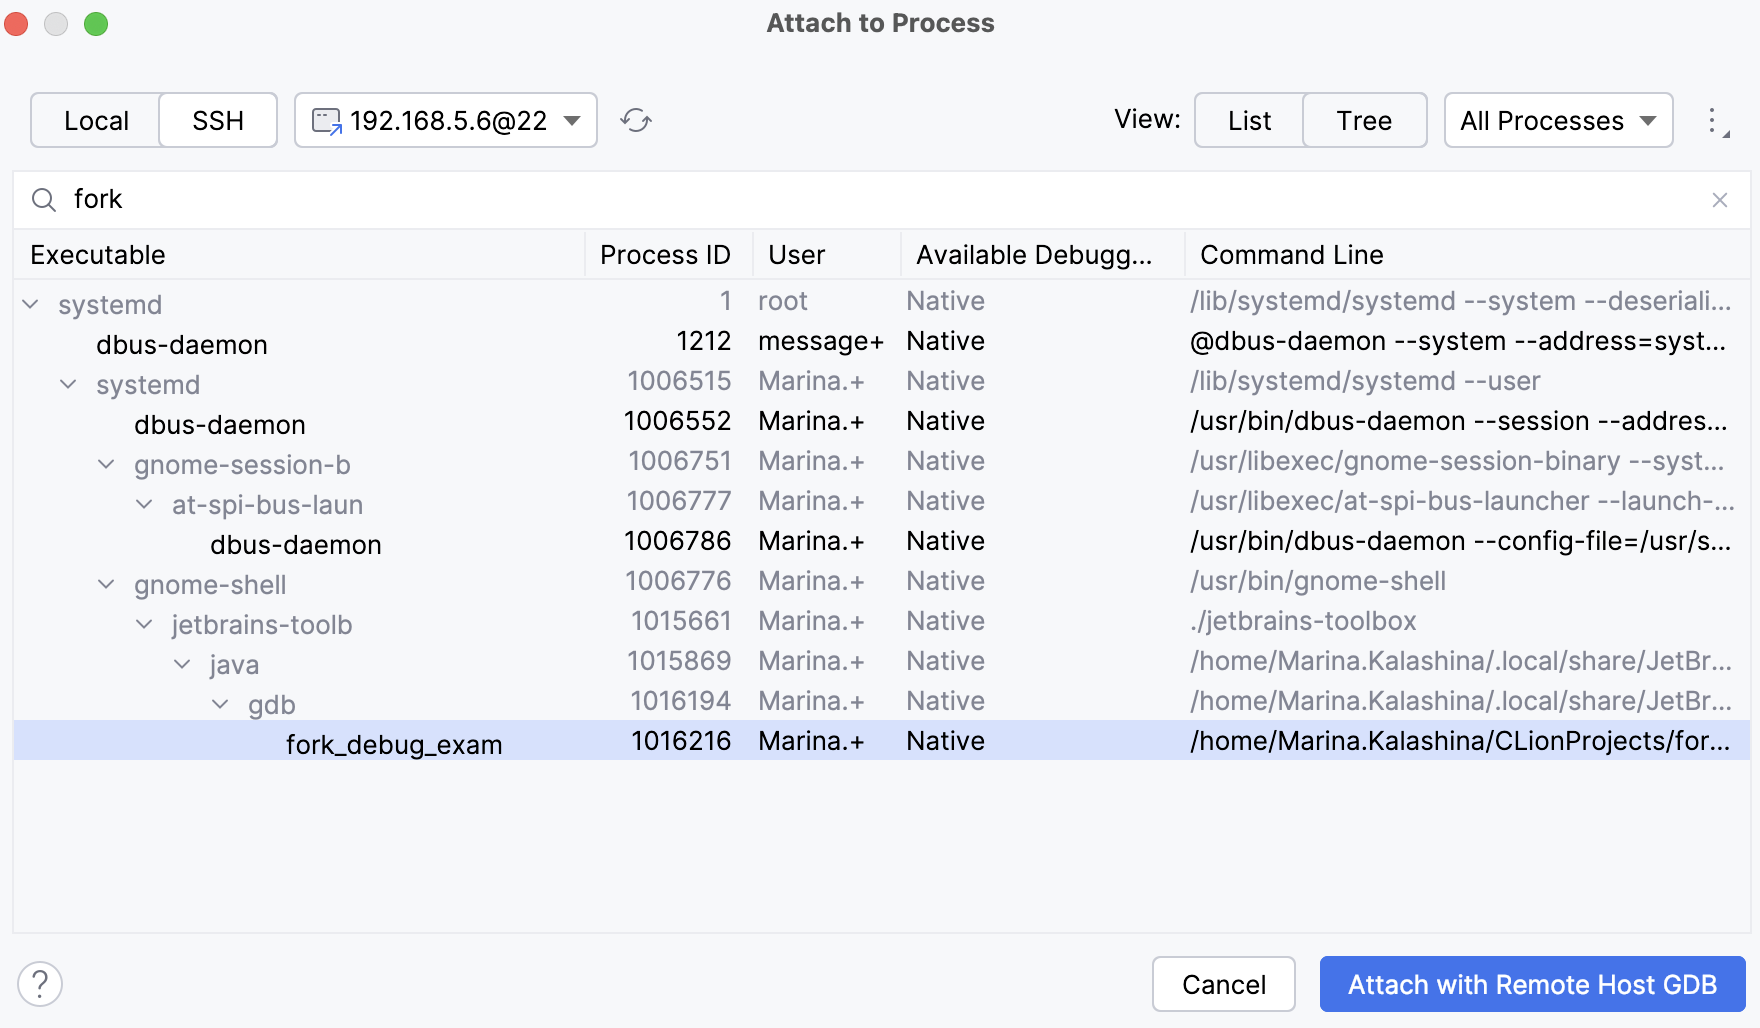
Switch to the SSH tab to view the list of remote processes. Make sure to configure a remote toolchain with SSH credentials beforehand.

On Windows, switch to the WSL tab to open the list of WSL processes. You will be able to attach to them with the WSL GDB debugger (if you have at least one WSL toolchain configured in your project).
Proceed with debugging the same way you usually do it in CLion (set breakpoints, step through, pause and resume the process, evaluate expressions, and so on).
Attach to an unstarted process
If the process you would like to attach to is not running yet, you can preconfigure attachment using the Attach to an Unstarted Process action:
Set the necessary breakpoints in your code.
Select from the main menu.
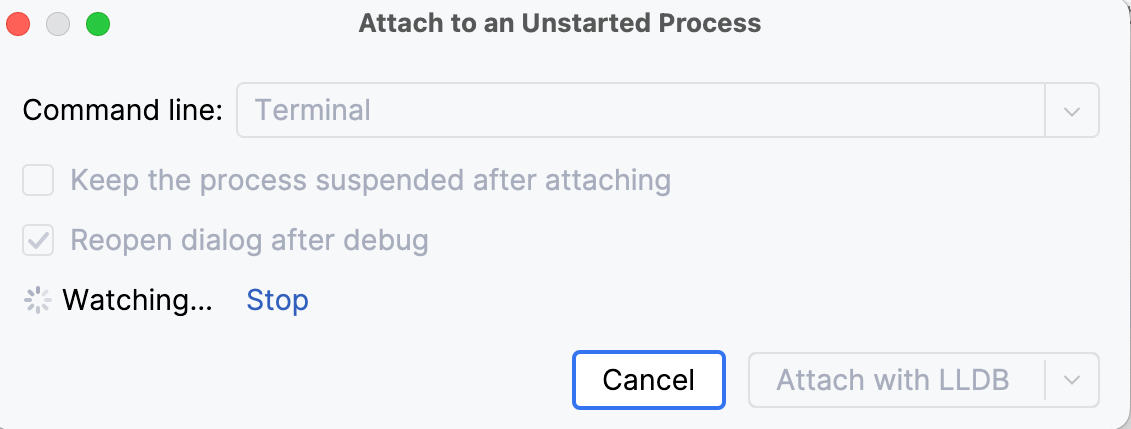
In the dialog that opens, specify the command line of the process or an executable name.
Set the Keep the process suspended after attaching checkbox if you would like the process to be paused once CLion attaches to it.
Clear the Reopen dialog after debug checkbox if you do not want CLion to reopen this dialog once the debugging session terminates.
Click Attach and select the debugger (if applicable).

CLion will begin watching. Once it identifies the process, it will automatically attach to it and trigger debugging.
Detach from a process
The procedure of detaching from a remote process is the same as for stopping a debug session. However, note that when you detach, the debug session closes but the process continues to run.
Click the Stop
button on the main toolbar in the Debug tool window.
Alternatively, click Stop
on the main toolbar or press Ctrl+F2, then select the session to be closed.