Quick start with DataGrip
This quick start guide will introduce you to the key concepts and help you with your first steps in DataGrip.
Also, you can check our introduction video that covers all major topics about the IDE: adding data sources, configuring connection options, working in the editor, and installing plugins.
Step 1. Configure initial settings
After you have installed the product and launched it for the first time, you see the initial configuration wizard. You can see a more detailed description of the installation process in Install DataGrip.
On the first page, select the color scheme for DataGrip, which can be either light or dark.
On the second page, you can configure the default dialect and a directory with SQL scripts.
Default SQL dialect: code in SQL files is highlighted according to the selected dialect. For example, if you select Microsoft SQL Server, the SQL files will be highlighted as SQL Server files by default. You can change this setting later. To set a dialect for a file or a folder, see SQL Dialects.
Scripts directory: a directory that is attached in the Files tool window (). You can attach any directory later.

Step 2. Enable Docker and Git plugins
We are going to need Docker and Git plugins to run the PostgreSQL instance and clone git repositories. Ensure that these plugins are installed and enabled. If you want to use your DBMS and your scripts, feel free to skip this step.
Enable the Git plugin by JetBrains
Press Ctrl+Alt+S to open IDE settings and select Plugins.
Click Installed.
In the search field, type
Git, and press Enter.Select the checkbox near the Git plugin name. To add integration with GitHub, you can also enable the GitHub plugin.
Restart the IDE.

Install the Docker plugin by JetBrains
To Docker support in DataGrip, install the Docker plugin by JetBrains.
Press Ctrl+Alt+S to open IDE settings and select Plugins.
Click Marketplace.
In the search field, type
Docker, and press Enter.To install the plugin, click Install and restart DataGrip.

Step 3. Clone repositories
For example purposes, we are going to use the following two repositories: Sakila dump files (https://github.com/DataGrip/dumps) and Docker-compose files (https://github.com/DataGrip/datagrip-documentation). Sakila repository includes scripts that generate the structure of the Sakila database and scripts that add data to database objects. Docker repository includes YAML files that define services, networks, and volumes.
Enable version control integration
Click VCS | Enable Version Control Integration.
In the Enable Version Control Integration dialog, ensure that
Gitis selected in the drop-down list and click OK.
Clone repositories
Click .
In the URL field, copy and paste the following web URL:
Sakila dump files:
https://github.com/DataGrip/dumps.gitDocker-compose files:
https://github.com/DataGrip/datagrip-documentation.git
In the Directory field, click the folder icon (
 ) and specify a directory for the repository files.
Step 4. Run the Docker database image
For this tutorial, we are going to run a PostgreSQL container for Docker (from the datagrip-documentation repository). In the Docker directory of the repository, you can find .env and docker-compose.yml files. .env includes credentials for the PostgreSQL service. docker-compose.yml defines how the service is created and configured.
The service name is the first line of the service definition (before the JDBC URL). In our example, the service name is postgresql_12, the JDBC URL is jdbc:postgresql://localhost:54333/guest?user=guest&password=guest.
You can run the container from a command line by running:
Alternatively, you can enable and use the Docker plugin in DataGrip.
Enable Docker support
Install and run Docker.
For more information, see the Docker documentation.
Configure the Docker daemon connection settings:
In the Settings/Preferences dialog Ctrl+Alt+S, select .
Click
 to add a Docker configuration and specify how to connect to the Docker daemon.
The connection settings depend on your Docker version and operating system.
The Connection successful message should appear at the bottom of the dialog.

Connect to the Docker daemon.
The configured Docker connection should appear in the Services tool window ( or Alt+8). Select the Docker node
 , and click
  , or select Connect from the context menu.
To edit the Docker connection settings, select the Docker node and click
 on the toolbar, or select Edit Configuration from the context menu.
Create the Docker-compose deployment configuration
In the Services tool window (), right-click the Docker node and select Deploy.
In the popup window, select Create Docker-compose Deployment.
In the Create Deployment Configuration dialog, click the Browse icon of the Compose file(s) field.
In the Docker Compose Configuration Files dialog, click the Add button and navigate to the compose file. The Compose YAML file defines services, networks, and volumes. In our case, it is docker-compose.yml
In the Docker Compose Configuration Files dialog, click OK.
In the Service(s) field, type
postgresql_12.Click Run.
As a result, you can see the
postgresql_12running container in the Services tool window.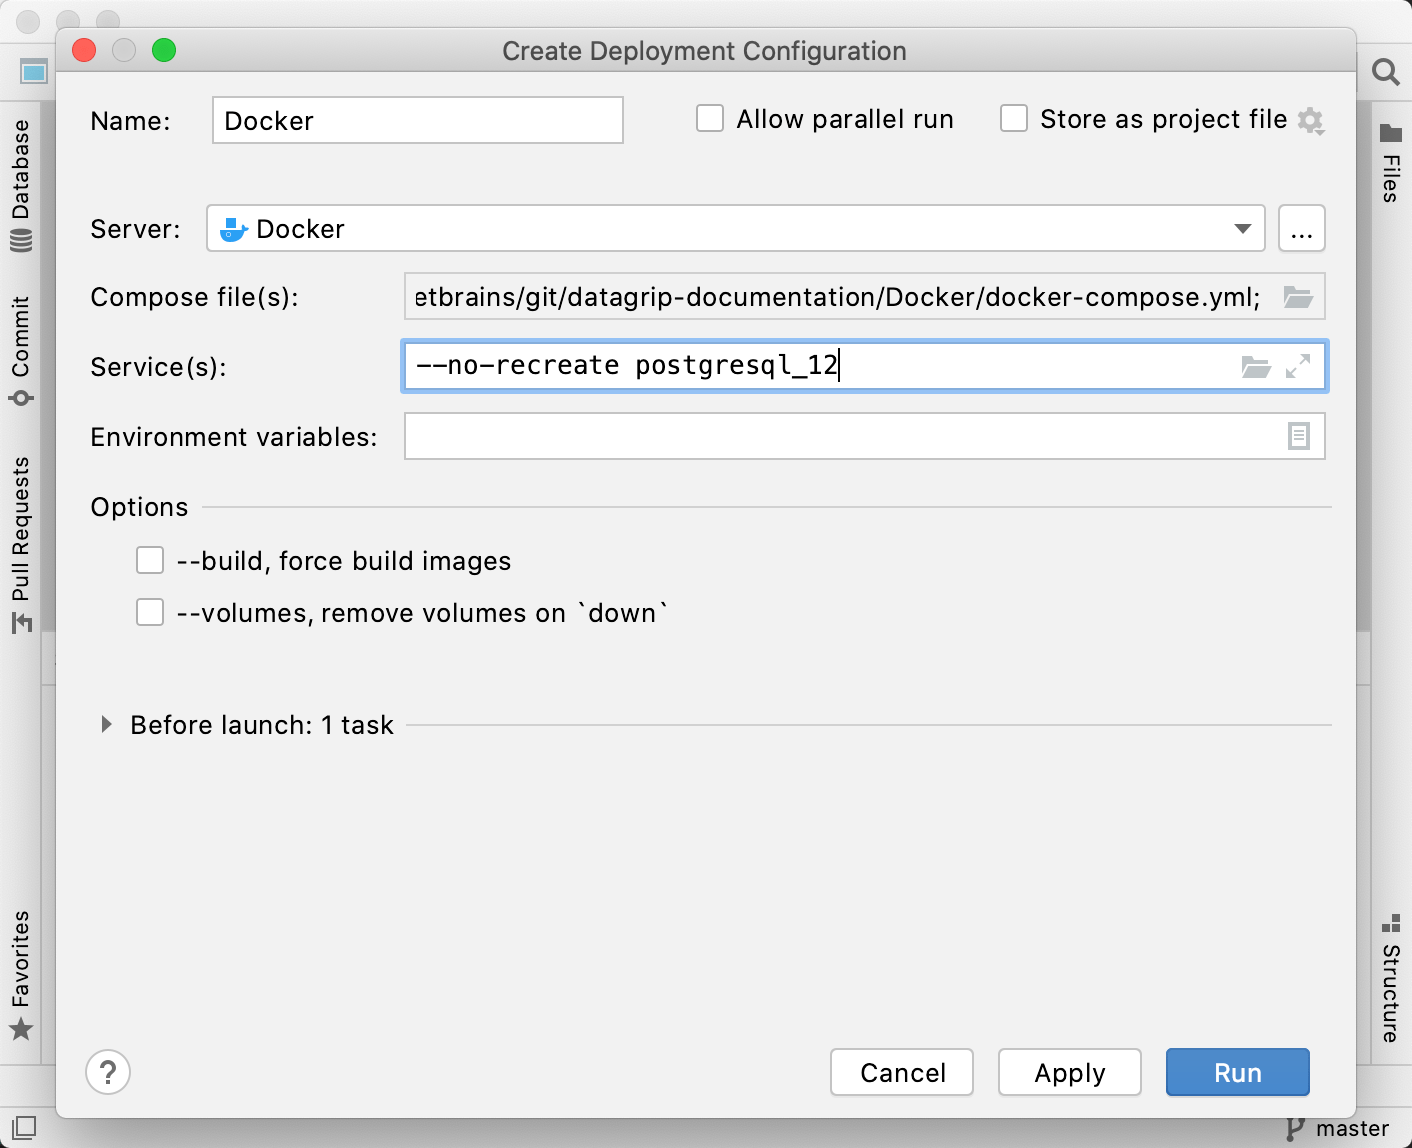
Step 5. Connect to a database
Depending on a database vendor (MySQL, PostgreSQL, Oracle), you need to create a corresponding data source connection. In this tutorial, we will create a PostgreSQL connection.
If you want to connect to other database management systems (DBMS), refer to Database connection. If you cannot connect to
Open data source properties. You can open data source properties by using one of the following options:
Navigate to .
Press Ctrl+Alt+Shift+S.
In the Database tool window (), click the Data Source Properties icon
 .
.
In the Data Sources and Drivers dialog, click the Data Sources tab.
Click the Add icon (
) and select PostgreSQL.At the bottom of the data source settings area, click the Download missing driver files link. As you click this link, DataGrip downloads drivers that are required to interact with a database. To decrease the size of the installation package and keep driver versions up-to-date, drivers are not bundled with the IDE.
You can specify your own drivers for the data source if you do not want to download the provided drivers. For more information about creating a database connection with your driver, see Add a user driver to an existing connection.
In the URL field, copy and paste the JDBC URL: jdbc:postgresql://localhost:54333/guest?user=guest&password=guest.
(Optional) In the Name field, delete the current name and type a new name for the connection (for example, PostgreSQL).
To ensure that the connection to the data source is successful, click the Test Connection link.

Step 7. Attach a directory with SQL scripts
To run SQL scripts, you can right-click the data source and select Run SQL script. Alternatively, you can attach a folder with these scripts to the Files tool window and run them from here.
Navigate to .
In the Files tool window, right-click any area and select Attach Directory to Project.
Navigate to the directory that you want to attach. In our case, it the dumps directory.
Click OK.

Step 8. Run dump files
In the Files () tool window, navigate to the postgres-sakila-db tree node.
Expand postgres-sakila-db tree node.
Hold Ctrl and click postgres-sakila-schema.sql and postgres-sakila-insert-data.sql.
Right-click the selection and click Run '<file_names>'. Alternatively, press Ctrl+Shift+F10.
In the Target data source / schema table, click the Add button (
) and select PostgreSQL.Ensure that the postgres-sakila-schema.sql file is on top of the list in the Execute table. Otherwise, use Up (
 ) and Down (
 ) buttons to change the order of files.
DataGrip executes files from the top of the list.
Press Run.

Step 9. Write your code
As you work in the editor, DataGrip analyzes your code, searches for ways to optimize it, and detects potential and actual problems. The following list includes basic features and tools that might be useful for your code writing and increase your productivity:
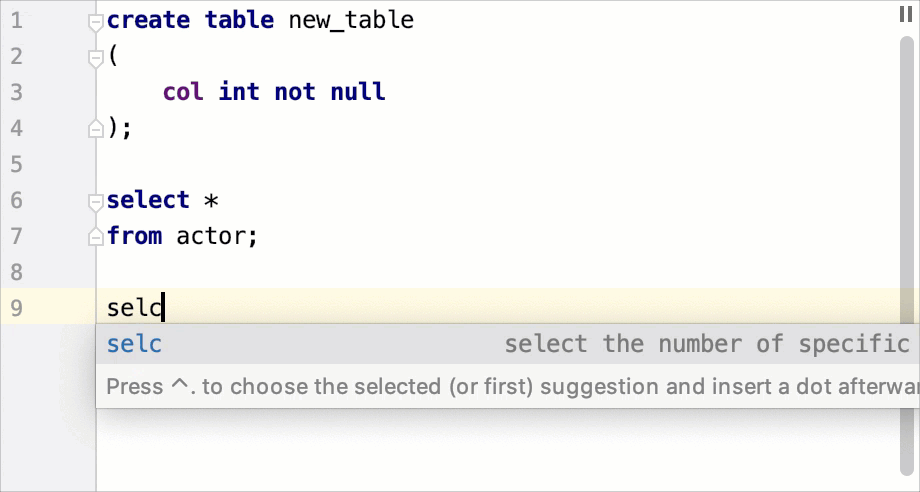
Code completion
Suggestions for code completion appear as you type your code. DataGrip has two types of code completion:
Basic code completion Ctrl+Space helps you complete names of types, interfaces, methods, and keywords within the visibility scope. When you invoke code completion, DataGrip analyzes the context and suggests the choices that are reachable from the current caret position. By default, DataGrip displays the code completion popup automatically as you type.
Smart code completion Ctrl+Shift+Space filters the suggestions list and shows only the types applicable to the current context.
The following animation shows the difference between basic and smart completion. Notice the number of variants that are suggested for different completion types
Generating code
DataGrip provides multiple ways to generate common code constructs and recurring elements, which helps you increase productivity. These can be either file templates used when creating a new file, custom or predefined live templates that are applied differently based on the context, various wrappers, or automatic pairing of characters.
You can generate functions, procedures, views, and other database objects.
To generate an object, press Alt+Insert and select the object that you want to generate.

Live templates
Use live templates to insert common constructs into your code, such as statements or definitions of database objects.
The following video shows how you can use live templates.
To expand a code snippet, type the corresponding template abbreviation and press Tab. Keep pressing Tab to jump from one variable in the template to the next one. Press Shift+Tab to move to the previous variable.
To see the list of live templates, open settings Ctrl+Alt+S and navigate to .
Inspections
In DataGrip, there is a set of code inspections that detect and correct anomalous code in your project before you compile it. The IDE can find and highlight various problems, locate dead code, find probable bugs, spelling problems, and improve the overall code structure.
Inspections can scan your code in all project files, or only in specific scopes (for example, only in production code, or in modified files).
Every inspection has a severity level— the extent to which a problem can affect your code. Severities are highlighted differently in the editor so that you can quickly distinguish between critical problems and less important things. DataGrip comes with a set of predefined severity levels and enables you to create your own.
To see the list of inspections, open settings Ctrl+Alt+S and navigate to . Disable some of them, or enable others, plus adjust the severity of each inspection. You decide whether it should be considered an error or just a warning.
For example, the Redundant code in COALESCE call inspection reports all the arguments except for the first expression that does not evaluate to NULL.

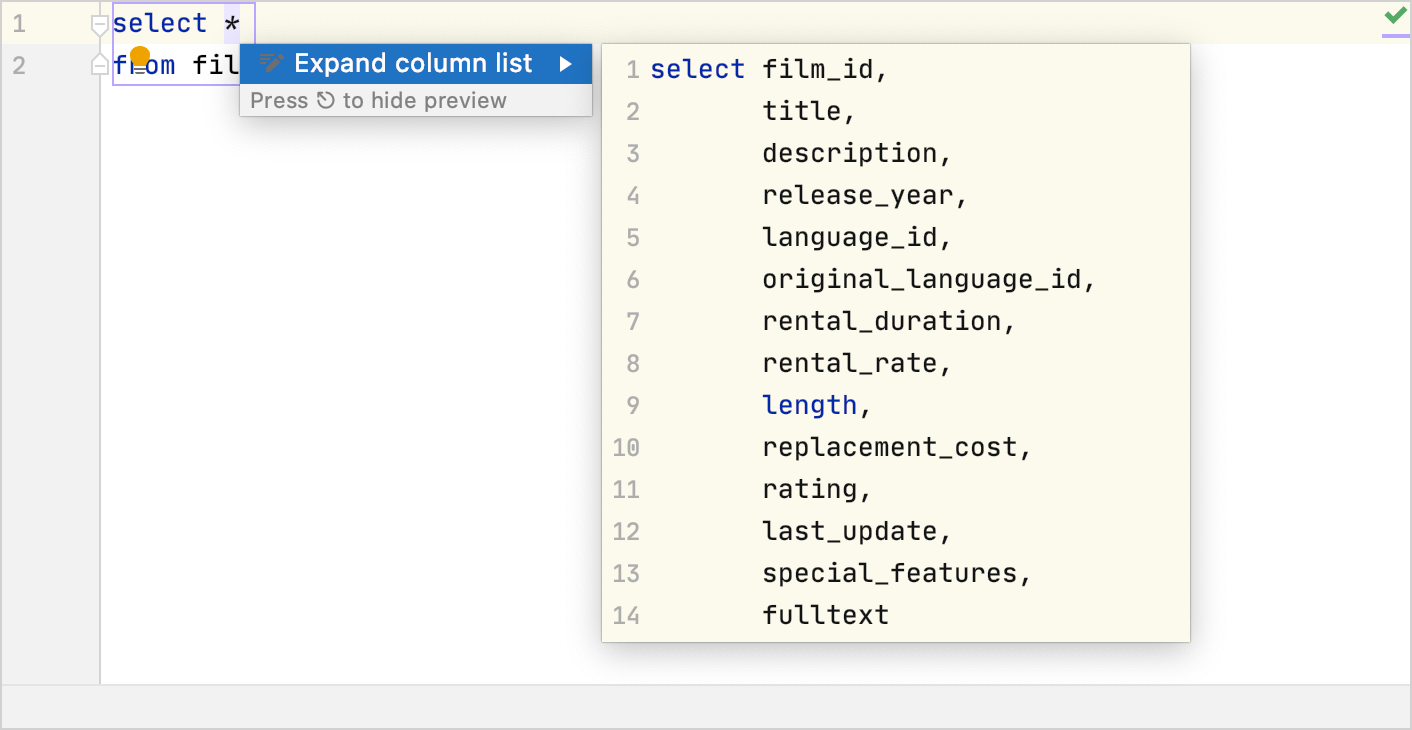
Intention actions
As you work in the editor, DataGrip analyzes your code, searches for ways to optimize it, and detects potential and actual problems.
As soon as the IDE finds a way to alter your code, it displays a yellow bulb icon ![]() in the editor next to the current line. By clicking this icon, you can view intention actions available in the current context. Intention actions cover a wide range of situations from warnings to optimization suggestions. You can view the full list of intentions and customize them in the Settings/Preferences dialog Ctrl+Alt+S.
in the editor next to the current line. By clicking this icon, you can view intention actions available in the current context. Intention actions cover a wide range of situations from warnings to optimization suggestions. You can view the full list of intentions and customize them in the Settings/Preferences dialog Ctrl+Alt+S.
To see the list of intention actions, open settings Ctrl+Alt+S and navigate to .
Click the light bulb icon (or press Alt+Enter) to open the list of suggestions.
Select an action from the list and press Enter.
For example, you can use an intention action in the INSERT statement to create a table with valid field types:
Video tutorials
This video covers various topics about DataGrip. The video length is 40 minutes but you can click time codes on the Youtube page to see the topic that you are interested in. For more information about time codes and topics, see the description section at youtube.com.