Release notes
This section lists functionality added to DataGrip in the current release. To view release notes for other DataGrip versions, click the version switcher on the help site and select the version that you need.

Code completion: completion for cross-database synonyms
Code completion works for cross-database synonyms.

Code completion: computed columns in INSERT statements
Computed columns are taken into account when completing INSERT statements – they are not included in the suggested item.

Code completion: fields and operators in MongoDB
Code completion for fields in MongoDB supports:
Fields
Nested fields
Fields inside aggregation expressions
Code completion for operators in MongoDB supports:
CockroachDB: native introspection
CockroachDB is fully supported. The full list of objects that are now introspected includes database, role, privilege, schema, sequence, deftype, table, view, mat view, index, column, and constraints. It’s a known issue that partitions are not introspected yet.
Data editor: shorten tab titles
By default, the Shorten Tab Titles option is enabled. A data source name in the tab title is shortened to 36 characters.
To disable this feature, right-click a tab of a query console and select Shorten Tab Titles.

Database tool window: a DDL data source from a database
You can generate a DDL data source from any data source that you have (for example, from PostgreSQL). DDL files are generated and saved to your hard drive. A new DDL data source is based on them. If something has changed in the database, you can always regenerate DDL files and update your DDL data source.
Also, you can add new objects to your DDL data source by right-clicking a node of this data source in the Database tool window.

Database tool window: linked servers
Linked servers are shown in the Database tool window, and the DDL for their creation can be generated.

Database tool window: natural sort order for database objects
If you turn off the Sort Alphabetically option in the view options of the Database tool window, the natural sort order for objects is applied.
Sort Alphabetically is enabled | Sort Alphabetically is disabled |
|---|---|
 |  |
Database tool window: separate folders for functions and procedures
In the Database tool window (), click the Show Options Menu icon (![]() ) and select the Separate Procedures and Functions setting.
) and select the Separate Procedures and Functions setting.

Database tool window: separate nodes for triggers, keys, and indexes
The new database tree option called Place Constraints and Similar Objects under Schema displays separate nodes for triggers, keys, and indexes.
Enabled | Disabled |
|---|---|
 |  |
Diagrams: the display of table comments and table colors
Diagrams now include table comments and display colors assigned to database objects.

Diagrams: better layout for diagrams
Object names do not overlap with relation lines.

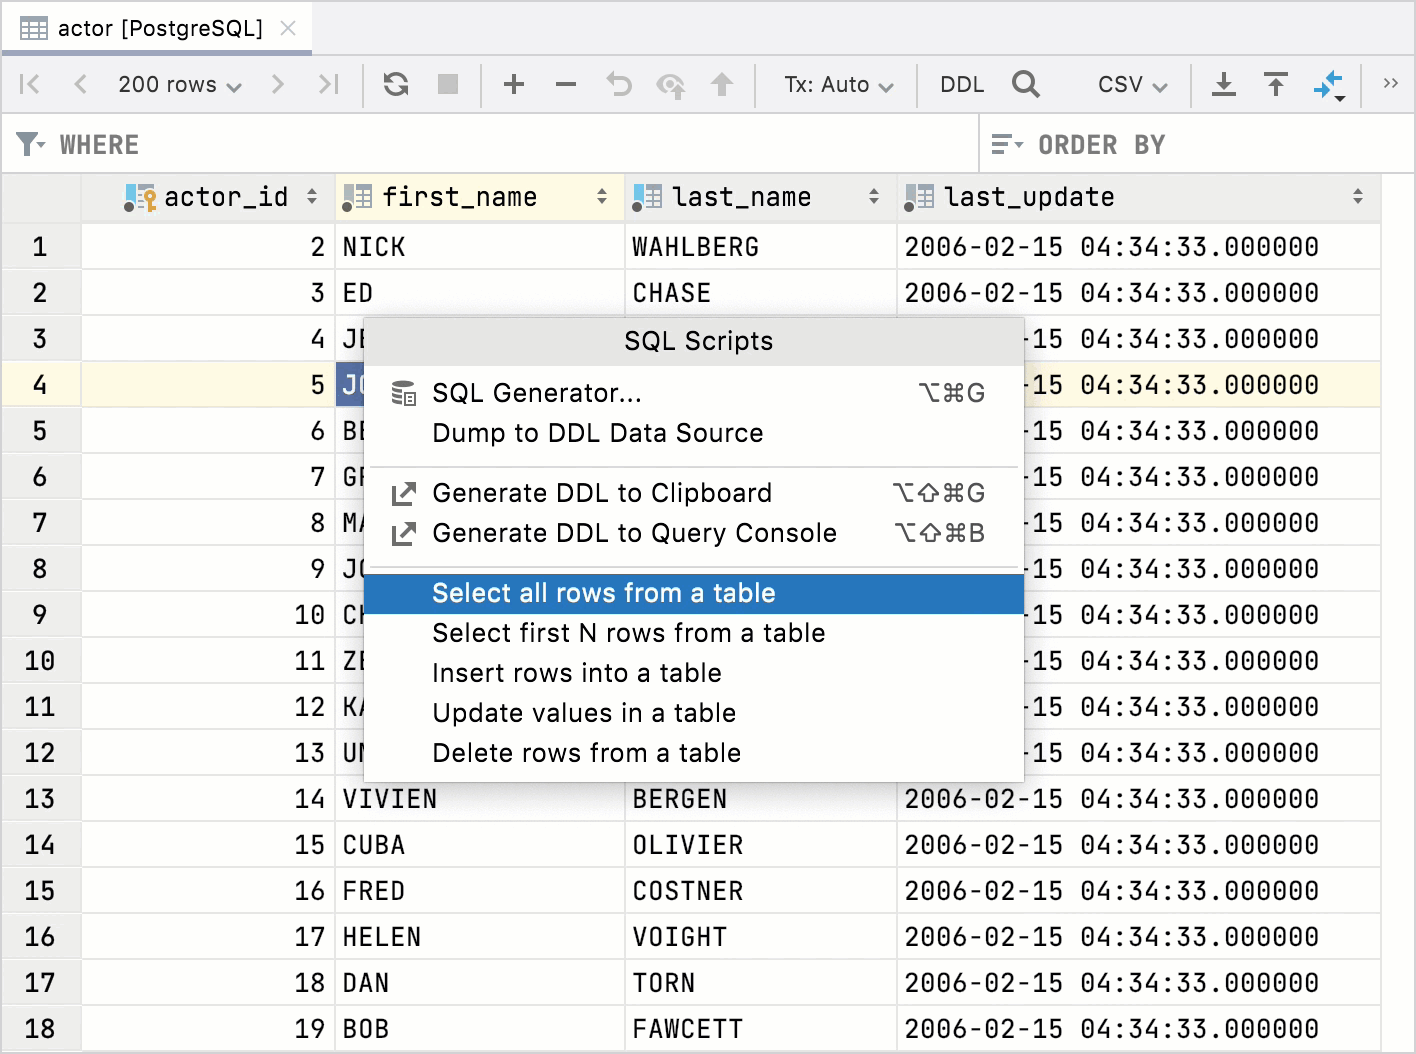
Editor: context live templates from the data editor
Context live templates work from the data editor. If you are working with a table and you wish to query it, you can use the SQL Scripts context menu action and select the template that you need.
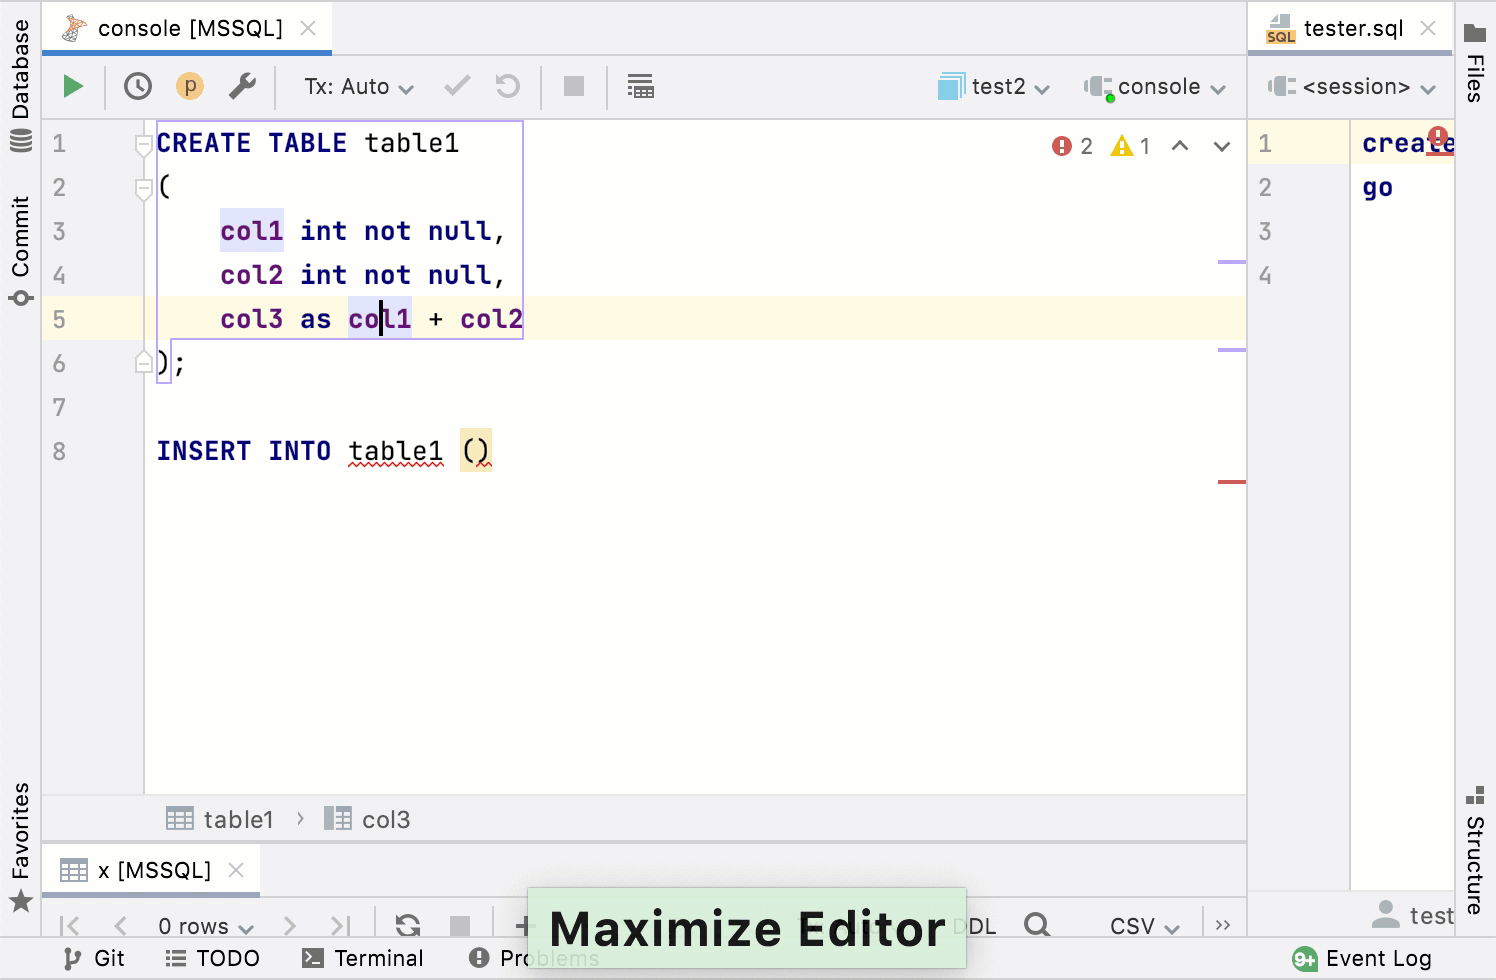
Editor: Maximize Editor and Normalize Splits actions
The Hide All Tool Windows action (Ctrl+Shift+F12) does not hide split tabs. The Maximize Editor action expands the area of the editor tab, the Normalize Splits allocates equally split tabs and the editor tab.
Editor: search in the local history
You can use text search in the local history if you are looking for a particular revision of your code.

Editor: settings for stacked sorting
To sort the column data, click the column name. The column sorting is not stacked by default. It means that if you click a column name to sort data by, the sorting based on other columns will be cleared. If you prefer to use the stacked sorting, click a column name while pressing Alt.
To change the default option for stacked sorting, open settings by pressing Ctrl+Alt+S and navigate to . Change the value for the Add columns to sorting option.

Editor: snippets for scratch files in a popup
The Show Scratch Files action shows a list of scratches with snippets in a popup.

Import: a link to the newly imported data
When you finish importing data, a link to a table with this data appears in the notification area.

Introspection: tablespaces, data files, and temporary files in Oracle
We added support for tablespaces, data files, and temporary files. They are displayed in the Database tool window and are included in the DDL generation.
Introspection: virtual foreign keys for pg_catalog
In PostgreSQL, you can use virtual foreign keys and query system tables. Also, the navigation by data now works in system tables. To navigate by data, right-click a cell and select .

MongoDB: add and delete operations for columns
You can add columns to MongoDB collections. This action lets you add a new field to any document of a collection.

Navigation: qualification for foreign keys
If you have foreign keys pointing to the objects in another schema and these objects have the same names, they will be displayed as qualified in the navigation dialog for foreign keys.
Navigation: expand a node on pressing Enter
Before DataGrip 2021.2, the Enter key opened data for tables or opened consoles for data sources. Now the Enter key expands a node.
Projects: a new location for projects
Starting from DataGrip 2021.2, projects are located in in the user’s home directory, inside the DataGripProjects subdirectory.
To see the Welcome screen each time you open DataGrip, open settings by pressing Ctrl+Alt+S and navigate to . Clear the Reopen projects on startup checkbox.

Search: the display of signatures
When searching for a function, procedure, or operator, DataGrip shows signatures in the search window.

Settings: Back and Forward buttons in settings
You can use Back and Forward buttons to navigate between different pages in settings.

Settings: the Disconnect task for the Before Launch section
You can add the Disconnect Data Source task in your run configurations to disconnect from your data source before running the SQL script.

Settings: the display of the Services tool window
You can define which operations make the Services tool window appear. To customize this setting, open settings by pressing Ctrl+Alt+S and navigate to . Select the necessary setting for the Show Services tool window for query console output.
