Support and assistance
Need assistance with DataGrip? Look for an answer in YouTrack, on our discussion forum, on Twitter, or contact the DataGrip team by email.
Where to look for information
Sources of information
YouTrack: the JetBrains tracking system.
JetBrains Community Forum: the online community where you can learn new things and share your knowledge about JetBrains products.
JetBrains Knowledge Base: a knowledge base that is collected and published by the JetBrains support team.
Stack Overflow: a knowledge base with questions and answers on a wide range of topics in computer programming and software products.
Twitter: Follow us on Twitter to be aware of new features, releases, and tips. You can ask us for help on Twitter, just mention @datagrip in your message.
Tips of the day
Tips of the day provide a collection of useful and interesting hints.
To see the Tip of the Day window, click .
To disable tips of the day on startup, clear the Show Tips on Startup checkbox in the Tip of the Day window.
Keymap reference
The default keymap reference for Windows, Linux, and macOS in the PDF format
To view the built-in keymap reference, click Help | Keyboard Shortcuts PDF.
Where to report an issue
Report an issue in Youtrack
Click .
Describe your problem and provide a brief summary in the Description and Summary fields respectively.
If it is possible, attach some troubleshooting materials.
Click Create.
Submit a request in the JetBrains Support Center
Open the request form by doing one of the following:
Click .
The request form will contain prefilled fields about your product and OS.
Go to the Submit a request page.
Fill in the Submit a request form.
If it is possible, attach some troubleshooting materials.
Click Submit.
Tweet us about your problem
Mention @datagrip in your message on Twitter and describe your problem. We will reach out to you.
Write to the DataGrip team
Email our team at datagrip@jetbrains.com. Describe your problem, and attach all available materials that can speed up troubleshooting (code samples, screenshots, logs, animations, videos, and other materials).
Troubleshooting materials
Consider attaching some troubleshooting materials for a more precise and quick answer. The following materials might be helpful for our investigation: log files, screenshots, animations, videos, database dumps.
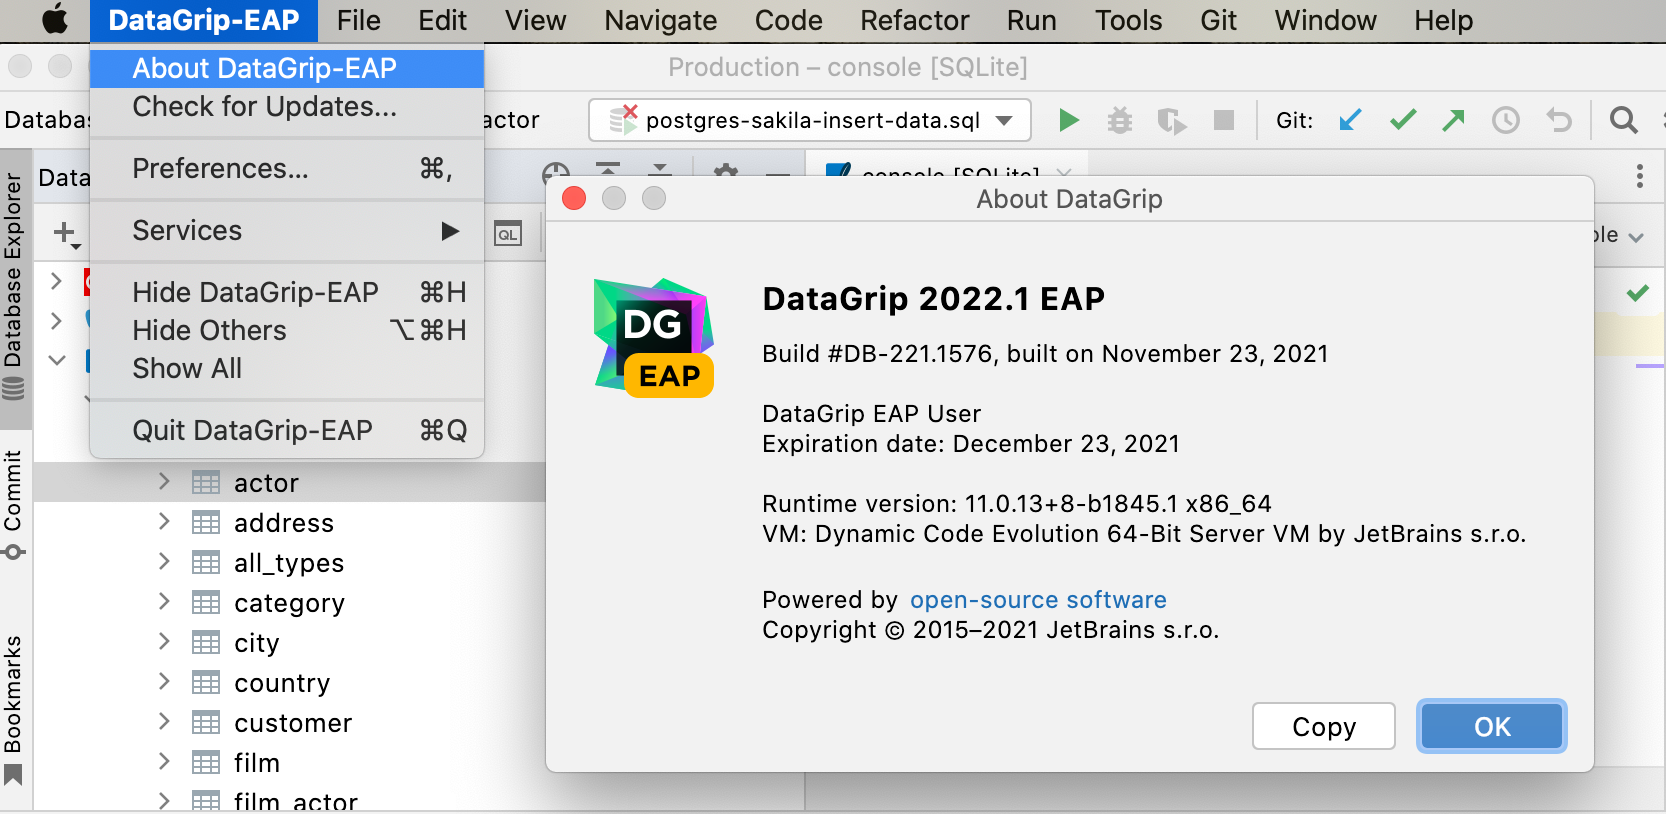
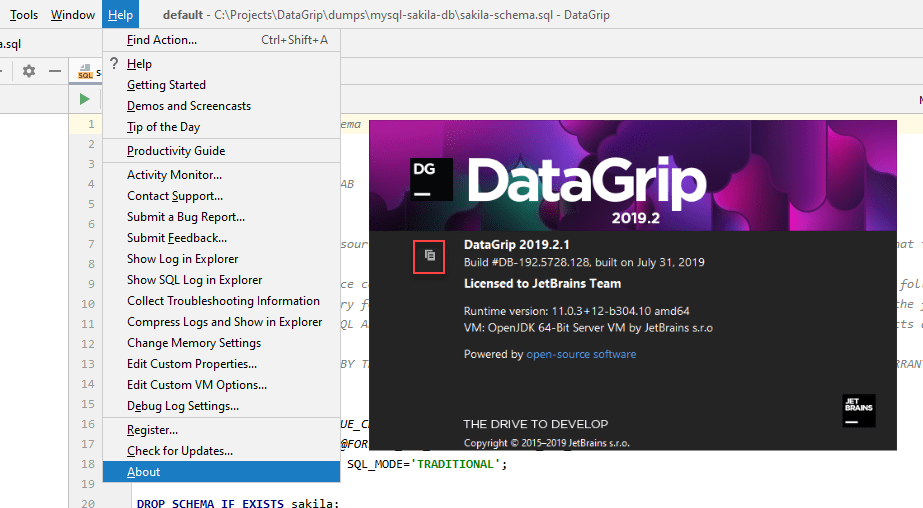
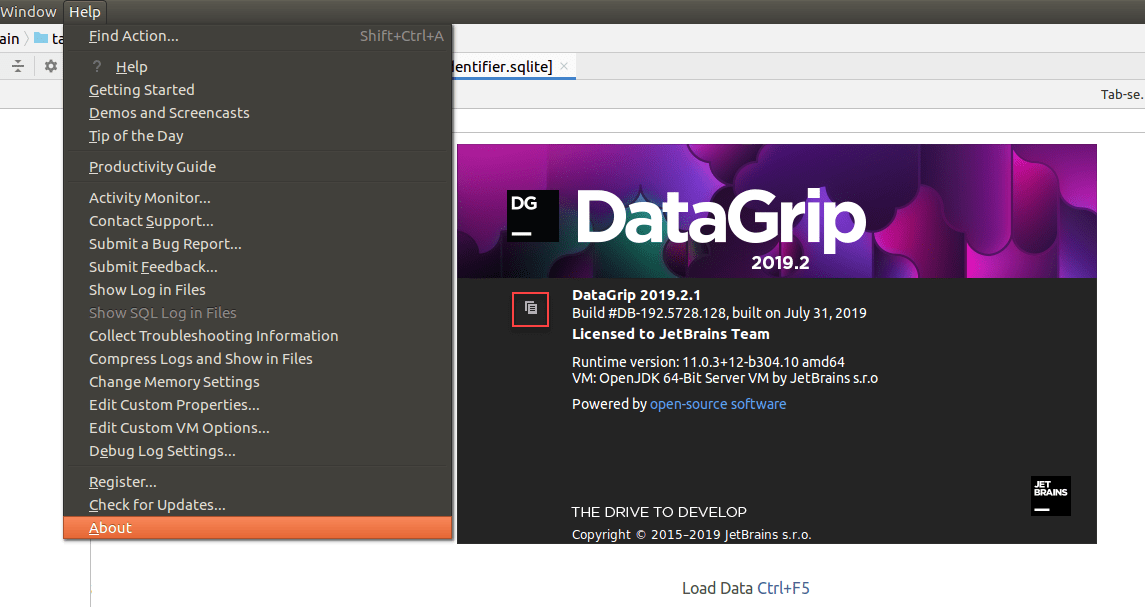
Copy DataGrip version and system information
You can get product and system information by using the following actions:
Use product help menu.
For macOS, click .
For Windows and Linux, click .
Click Ctrl+Shift+A, type
About, and press Enter.
Click the copy icon
and paste it in your Youtrack ticket, email message, support request.


Locate DataGrip log
Click . The idea.log file contains recent log information about your IDE performance.
Locate a query log
SQL log includes all queries that you have ever run in DataGrip. It means all user queries and all internal queries (except for the queries that are run by the JDBC driver). The log information is stored in database.log. The database.log file is stored on your hard drive until you delete or overwrite the file. When the file size reaches 1 MB, a new file with a different name is created.
To locate database.log, click . You can open database.log in DataGrip or in a text editor.
Configure DataGrip log settings
To avoid editing the log.xml file itself, DataGrip suggests a handy dialog to change logging level for a category. This file resides under the bin directory of DataGrip installation.
Click .
In the Custom Debug Log Configuration dialog, type the log categories names, separated with new lines.
Reporting issues
Reporting performance issues
DataGrip is completely frozen and does not respond to any actions? The IDE performance is slower than expected, CPU usage is high, and you suspect a memory leak? To resolve your issue, JetBrains might need a memory snapshot, profiler information, or a thread dump.
Find the information about collecting the data in Reporting performance issues.
For more information about troubleshooting these issues, read Reporting performance problems.
Reporting introspection issues
Some objects that exist in the database do not show up in the Database Explorer? Introspection takes too much time? There are outdated objects in the database, or the new objects are missing?
In these cases, JetBrains support team might a need detailed log file, or a database model in a DataGrip internal format. To resolve some of the issues, they might need a set of a few files that include information about the data source, a module that was used to load the metadata from the database, and a part of the database model.
For the information about collecting the data, refer to Reporting introspection issues.
Reporting connection issues
If DataGrip cannot connect to the database and shows a connection error message, consider checking out the troubleshooting steps listed in Cannot connect to a database. In case the issue persists, JetBrains support team might need a JDBC driver log file to help you with it.
For the information about collecting the data, refer to Reporting connection issues.
Share your feedback
Click .
Select checkboxes according to your preference. Alternatively, type your variant in the corresponding text boxes.
Click Submit.