Jupyter notebooks
With Jupyter Notebook integration available in DataSpell you can edit, execute, and debug notebook source code and examine execution outputs including stream data, images, and other media.
Notebook support in DataSpell includes:
Coding assistance:
Error and syntax highlighting.
Code completion.
Ability to create line comments Ctrl+/.
Dedicated Jupyter Notebook Debugger.
Shortcuts for basic operations with Jupyter notebooks.
Ability to recognize .ipynb files and mark them with the
icon.
Jupyter-specific AI features.
Quick start
To start working with Jupyter notebooks in DataSpell:
Open files in your workspace.
If needed, configure or create a new virtual environment.
Add and edit source cells.
Execute any of the code cells to launch the Jupyter server.
Get familiar with the user interface
Jupyter notebook toolbar
The Jupyter notebook toolbar provides quick access to all basic operations with notebooks.

You can customize the toolbar by adding, removing, and rearranging actions:
Click
More on the notebook toolbar.
Do one of the following:
Select Customize Toolbar, then select the action from the list. It will be added to the toolbar.
Select to open a dialog where you can add or remove additional actions. For more information, refer to Menus and toolbars.
Item | Description |
|---|---|
Code Cell Below | Adds a code cell below the selected cell. |
Move Cell Up | Moves the current cell up. |
Move Cell Down | Moves the current cell down. |
Run Cell and Select Below | Executes this cell and selects a cell below. If there is no cell below, DataSpell will create it. |
Run All | Executes all cells in the notebook. |
Restart Kernel | Click this icon to restart the currently running kernel. |
Clear All Outputs | Clears all outputs in the notebook. |
Create Gist | Opens the Create Gist dialog. |
| Click this widget to navigate to the last executed cell. |
| Shows the currently used Jupyter server. Click this widget and select to set up another local or remote Jupyter server. |
Additional actions | |
Cell Type Selector | Shows the type of the selected cell. Click to choose a different type and convert the cell accordingly. |
Delete Cell | Deletes the current cell. |
Debug Cell | Starts debugging for the selected cell. |
Select Cell Above | Selects the cell above. |
Select Cell Below | Selects the cell below. |
Open Notebook in Browser | Opens the current notebook in a browser. |
Cells
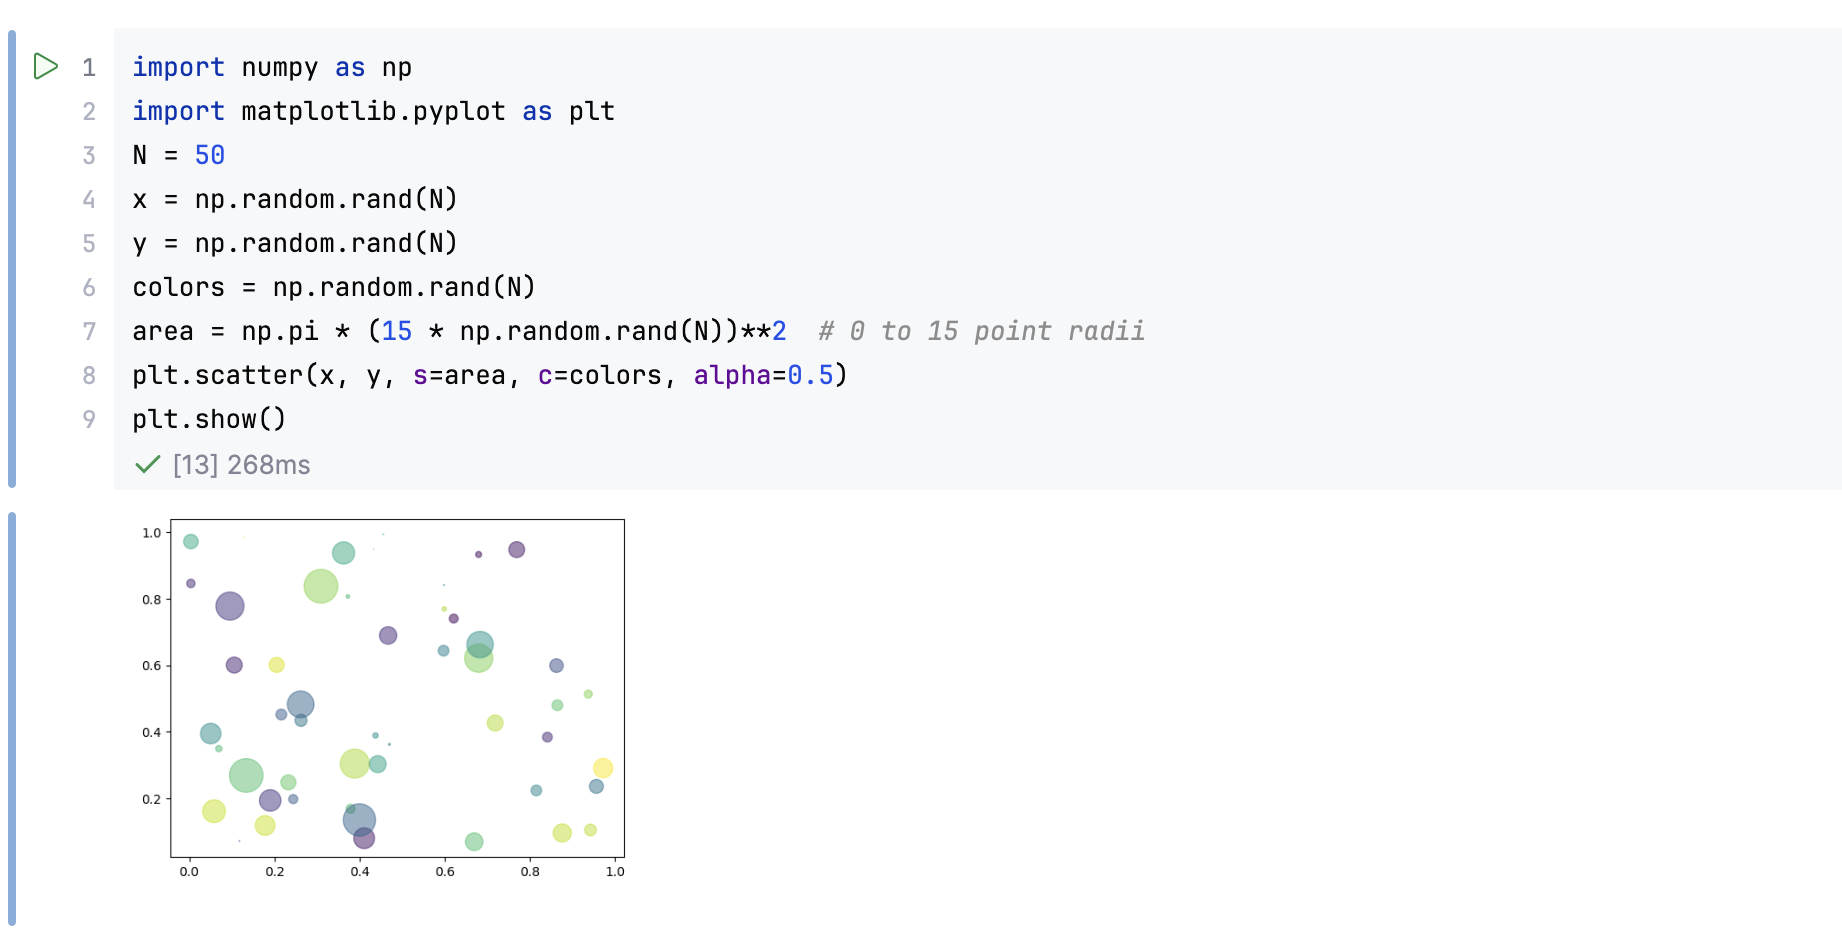
A cell contains a piece of either a code or Markdown text. When you run a code cell, you can view the cell output, which is the result of code execution:

Each cell includes its own toolbar, providing quick access to essential actions.
Cell toolbar consists of the following elements:
Actions available directly on the toolbar.
Additional actions in the context menu. To open the context menu, click
on the cell toolbar.
The actions available on the toolbar and in the context menu vary depending on the type of cell:
Item | Description |
|---|---|
Toolbar actions | |
| Get AI assistance for code suggestions or improvements. |
| Debug the code in the cell. |
| Remove the current cell. |
Context menu options | |
Run Above Cells | Run the cells above the current one. |
Run Cell and Below | Run the current cell and the cells below. |
Move Cell Up | Move the current cell up. |
Move Cell Down | Move the current cell down. |
Merge Cell Above | Merge a current cell with the cell above. |
Merge Cell Below | Merge a current cell with the cell below. |
Split Cell | Split a cell into two at the caret position. |
Duplicate Cell Below | Duplicate the current cell and insert the copy below. |
Copy Cell | Copy the cell and add it to the clipboard. |
Cut Cell | Remove the cell and add it to the clipboard. |
Convert Cell to Markdown | Change the type of the current cell to Markdown. |
Convert Cell to SQL | Change the type of the current cell to SQL. |
Add Cell Tag | Add a tag to organize or manage the cell. |
Clear Output | Clear the output of the cell. |
Item | Description |
|---|---|
Toolbar actions | |
| Get AI assistance for code suggestions or improvements. |
| Switch to edit mode. |
| Execute all cells within a Markdown section. |
| Remove the current cell. |
Context menu options | |
Add Cell Tag | Add a tag to organize or manage the cell. |
Duplicate Cell Below | Duplicate the current cell and insert the copy below. |
Move Cell Up | Move the current cell up. |
Move Cell Down | Moves the current cell one down. |
Copy Cell | Copy the cell and add it to the clipboard. |
Cut Cell | Remove the cell and add it to the clipboard. |
Item | Description |
|---|---|
Toolbar actions | |
| Get AI assistance for code suggestions or improvements. |
| Debug the code in the cell. |
| Remove the current cell. |
Context menu options | |
Run Above Cells | Run the cells above the current one. |
Run Cell and Below | Run the current cell and the cells below. |
Move Cell Up | Move the current cell up. |
Move Cell Down | Move the current cell down. |
Merge Cell Above | Merge a current cell with the cell above. |
Merge Cell Below | Merge a current cell with the cell below. |
Split Cell | Split a cell into two at the caret position. |
Duplicate Cell Below | Duplicate the current cell and insert the copy below. |
Copy Cell | Copy the cell and add it to the clipboard. |
Cut Cell | Remove the cell and add it to the clipboard. |
Convert Cell to Markdown | Change the type of the current cell to Markdown. |
Add Cell Tag | Add a tag to organize or manage the cell. |
Clear Output | Clear the output of the cell. |
Customize cell toolbar
Press Ctrl+Alt+S to open settings and then select .
Alternatively, click
on the toolbar and select Customize Cell Toolbar.
Add or remove actions under Customize Jupyter Cell Toolbar.
For more information, refer to Menus and toolbars.
Click OK to apply the changes and close the window, or click Apply to keep the window open.
Jupyter tool window
Jupyter tool window appears when you have any of the Jupyter servers launched. The Server tab of this window shows the current state of the Jupyter server and the link to the notebook in a browser.
It also provides controls to stop the running server () and launch the stopped server (
).
Jupyter console
You can execute commands in a Jupyter Console:
Click
Open Jupyter Console on the notebook toolbar. This button is enabled when you have started a Jupyter server for the current notebook. You can open one console for each notebook file.
Type a command or a series of commands and press
on the console toolbar.
The Variables tab provides a detailed report about variable values of the executed cell. The tab automatically opens when you launch the Jupyter console.
Jupyter Variables tool window
The Jupyter Variables tool window will appear each time you execute a cell. If you need to hide it permanently, go to and uncheck the Show Variables tool window on execution checkbox.

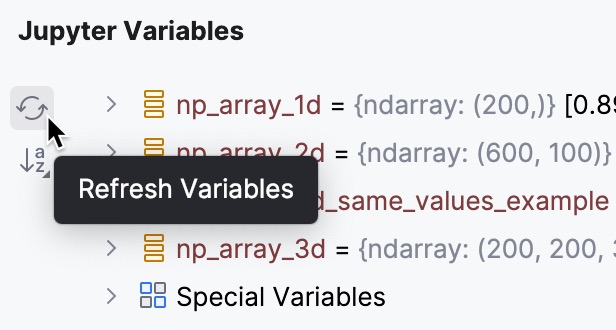
In the Jupyter Variables tool window, you can view variable values and manage the list of variables:
Click
Refresh Variables to refresh the list of variables without rerunning code cells.

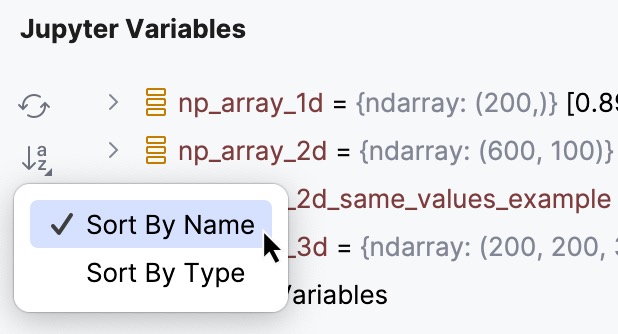
To sort the variables by name or by type, click
Sort By and select the required option from the list
