Get Started
JetBrains dotCover is a .NET unit test runner and code coverage tool. dotCover lets us analyze how much of our .NET application code is actually being tested. By measuring method calls during unit tests or when running the application manually, dotCover shows us which statements were covered and which weren't.
dotCover integrates into Visual Studio 2010, 2012, 2013, 2015, 2017, 2019, 2022, and 2026. After installing dotCover with or without any other dotUltimate tools and opening Visual Studio, you will find dotCover commands under the and in the main menu. From these menus, you can execute various commands available in dotCover.
Unit testing and code coverage
The most basic scenario of using dotCover is measuring how much of your code is actually executed when you run unit tests. Baseline conditions are as follows: you have a solution opened in Visual Studio and code in the solution is covered with some unit tests. The task is to understand how much of the code is covered.
Analyze coverage of unit tests in a solution
Choose from the main menu. This will open the Unit Test Explorer tool window. Here you can take a look at how many tests are there in the solution.
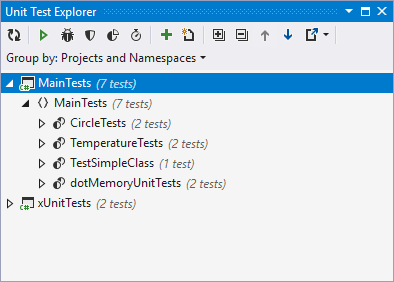
In the Unit Test Explorer window, select the test project or the tests whose coverage you want to analyze. Note that you can limit coverage scope by using coverage filters.
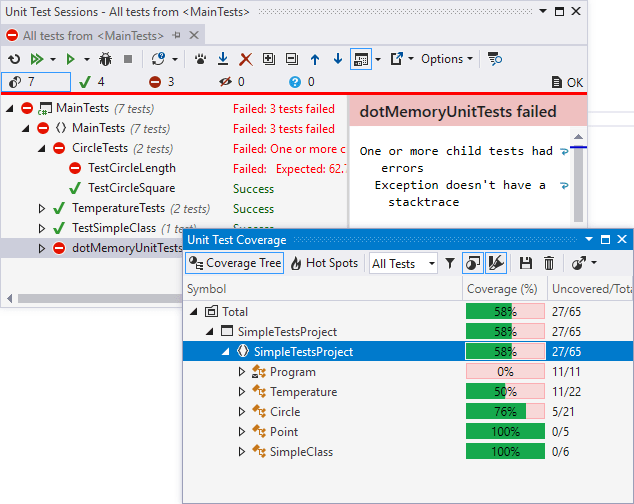
This will run a regular unit tests session, but dotCover will collect coverage data in the background. dotCover will show test results in real-time in the newly opened Unit Test Sessions window . Coverage results (how tests cover particular classes and methods in your code) will be shown in the Unit Test Coverage tool window.
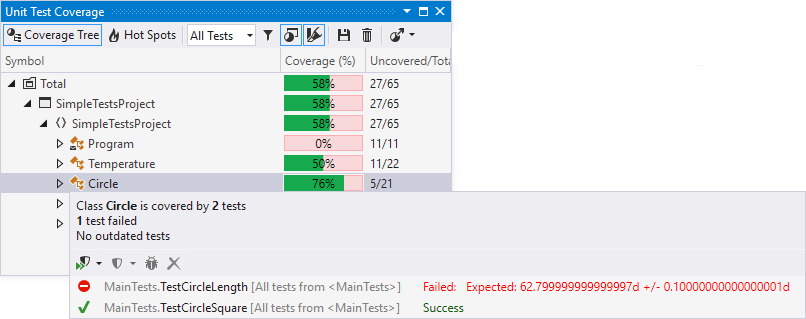
If you want to see what tests exactly cover a particular class or method, select it in the Unit Test Coverage window and in the context menu choose Show Covering Tests.
Visualize code coverage by clicking Highlight code
.png) in the Unit Test Coverage window.
in the Unit Test Coverage window.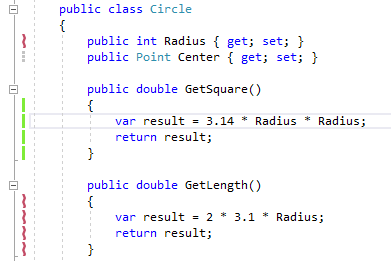
By default, coverage and test results are shown by markers in the editor gutter: a marker is red if any tests related to the current statement are failing, green if all tests are passing, and grey if there are no tests covering this statement.
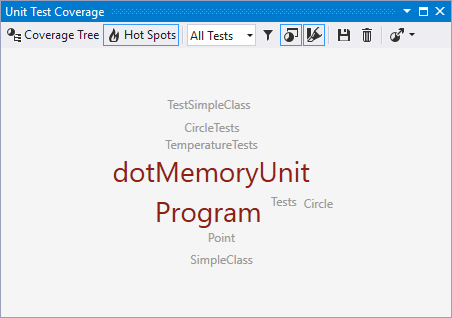
The Unit Test Coverage window contains one more very useful metric. After you click Hot Spots
 , it will show you a "cloud" of potentially risky classes: the classes that have high cyclomatic complexity but are poorly covered with tests.
Coverage of applications
dotCover enables us to calculate code coverage for a specific use-case scenario. Hitting Control+Alt+K P or choosing from the menu launches our solution's startup project under dotCover control. Alternatively, Control+Alt+K K or enables us to specify the application to calculate code coverage for.
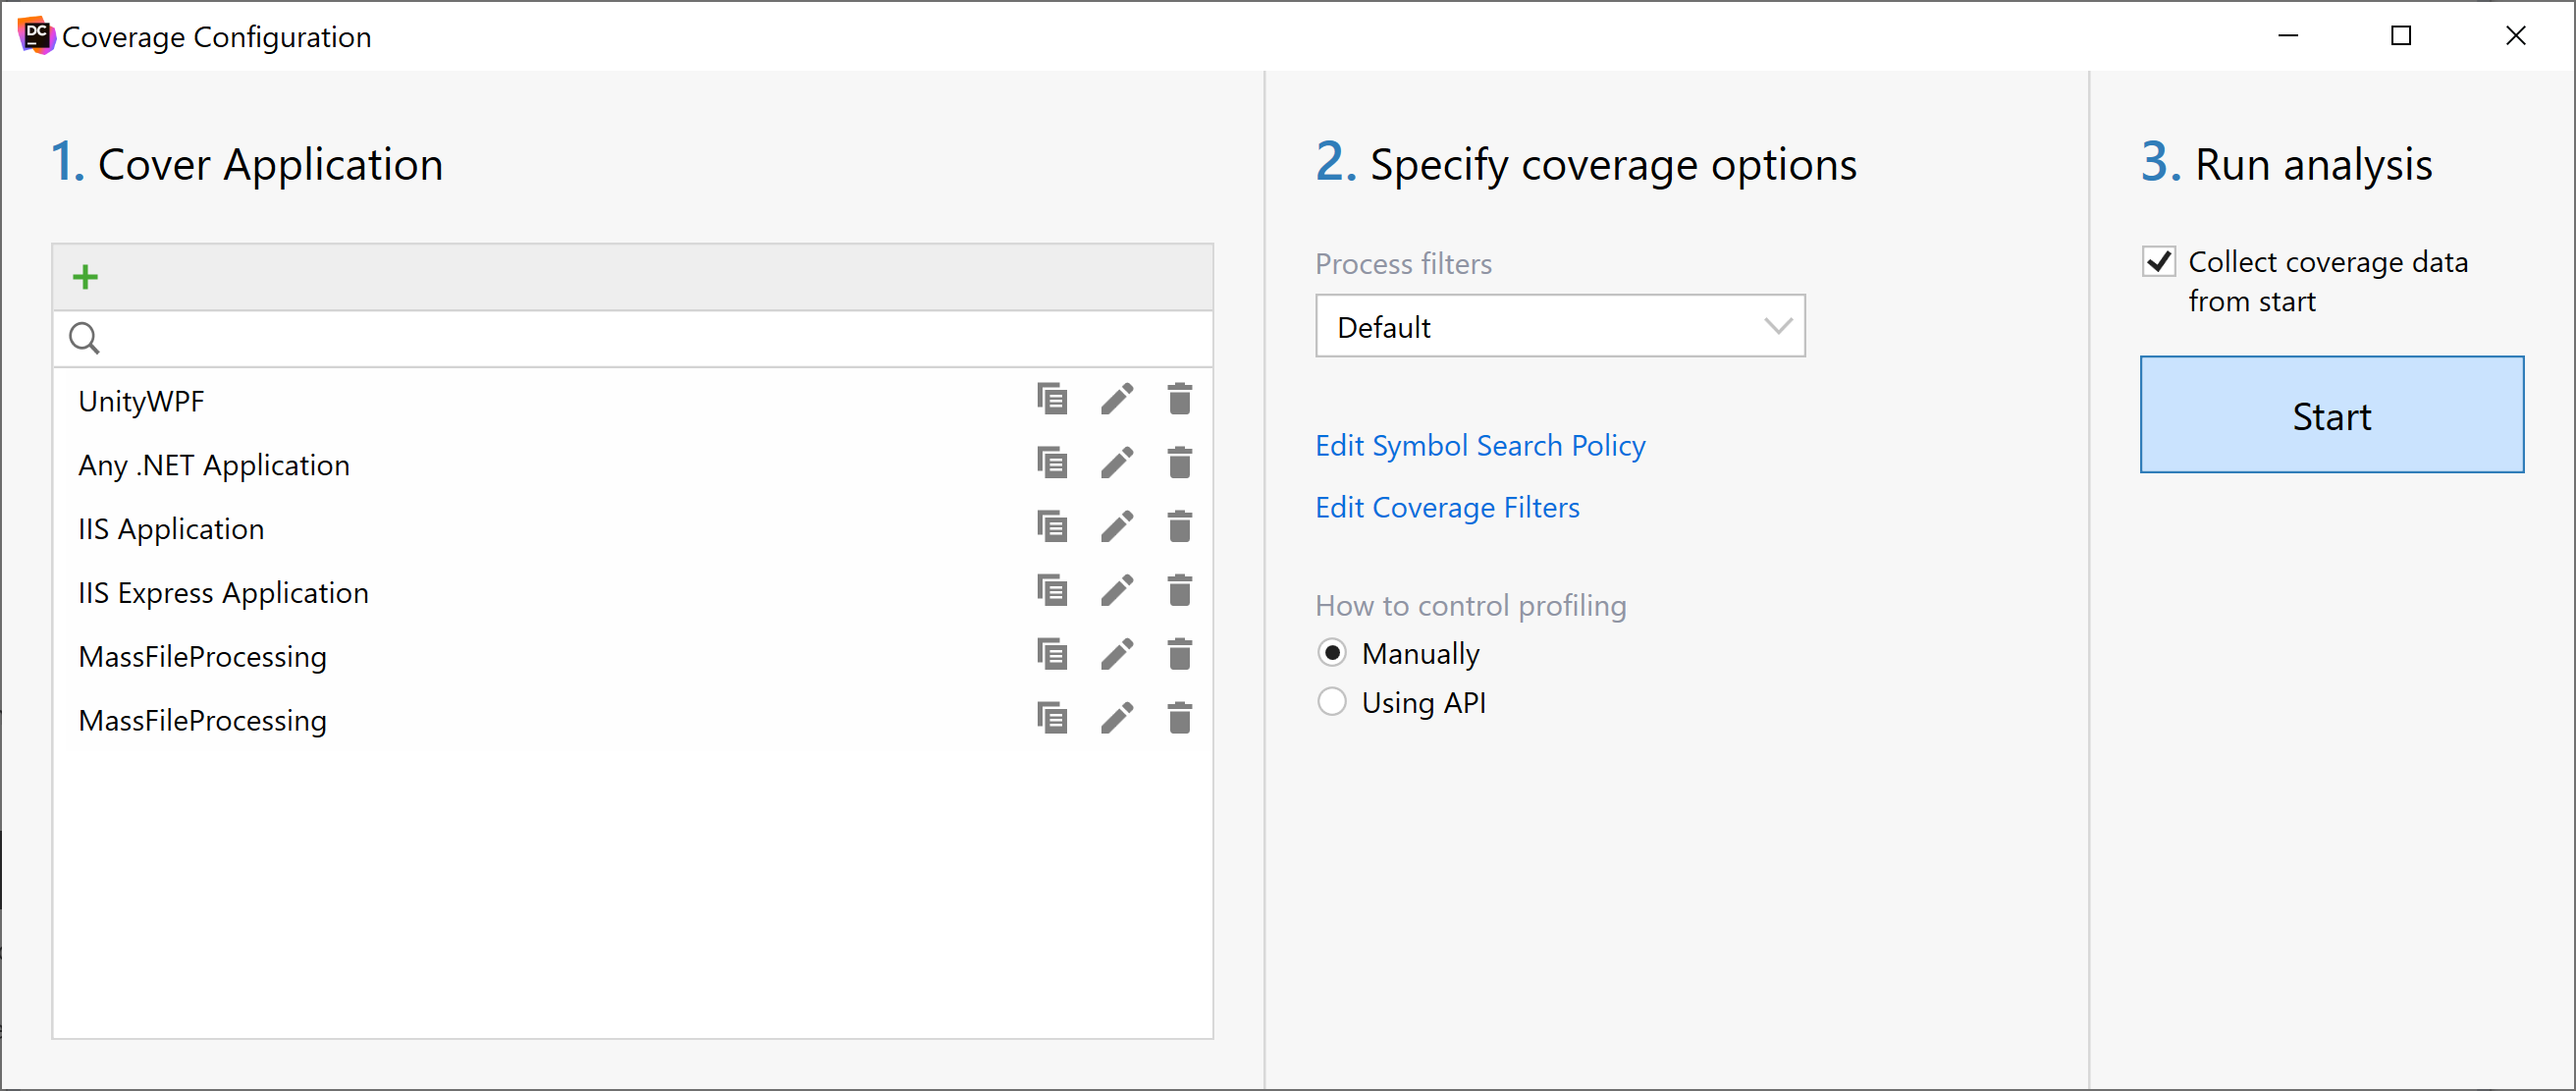
Next, we can run our application and work through a use-case scenario and tell dotCover to get a snapshot once completed. As long as the tested application runs under dotCover control, the controller dialog is displayed where you can click Get Snapshot and inspect which lines of code were covered when we worked with the tested application.

Filtering coverage results
Code coverage results can be cluttered with infrastructure code or projects that we are not interested in inspecting. We can exclude specific nodes by right-clicking them and choosing Exclude and Create Coverage Filter:
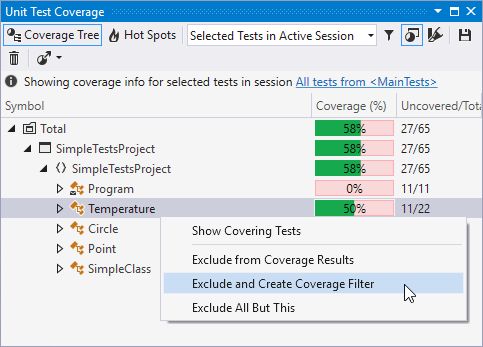
Excluding item and creating a corresponding runtime coverage filter will tell dotCover not to cover the item next time we run coverage analysis.
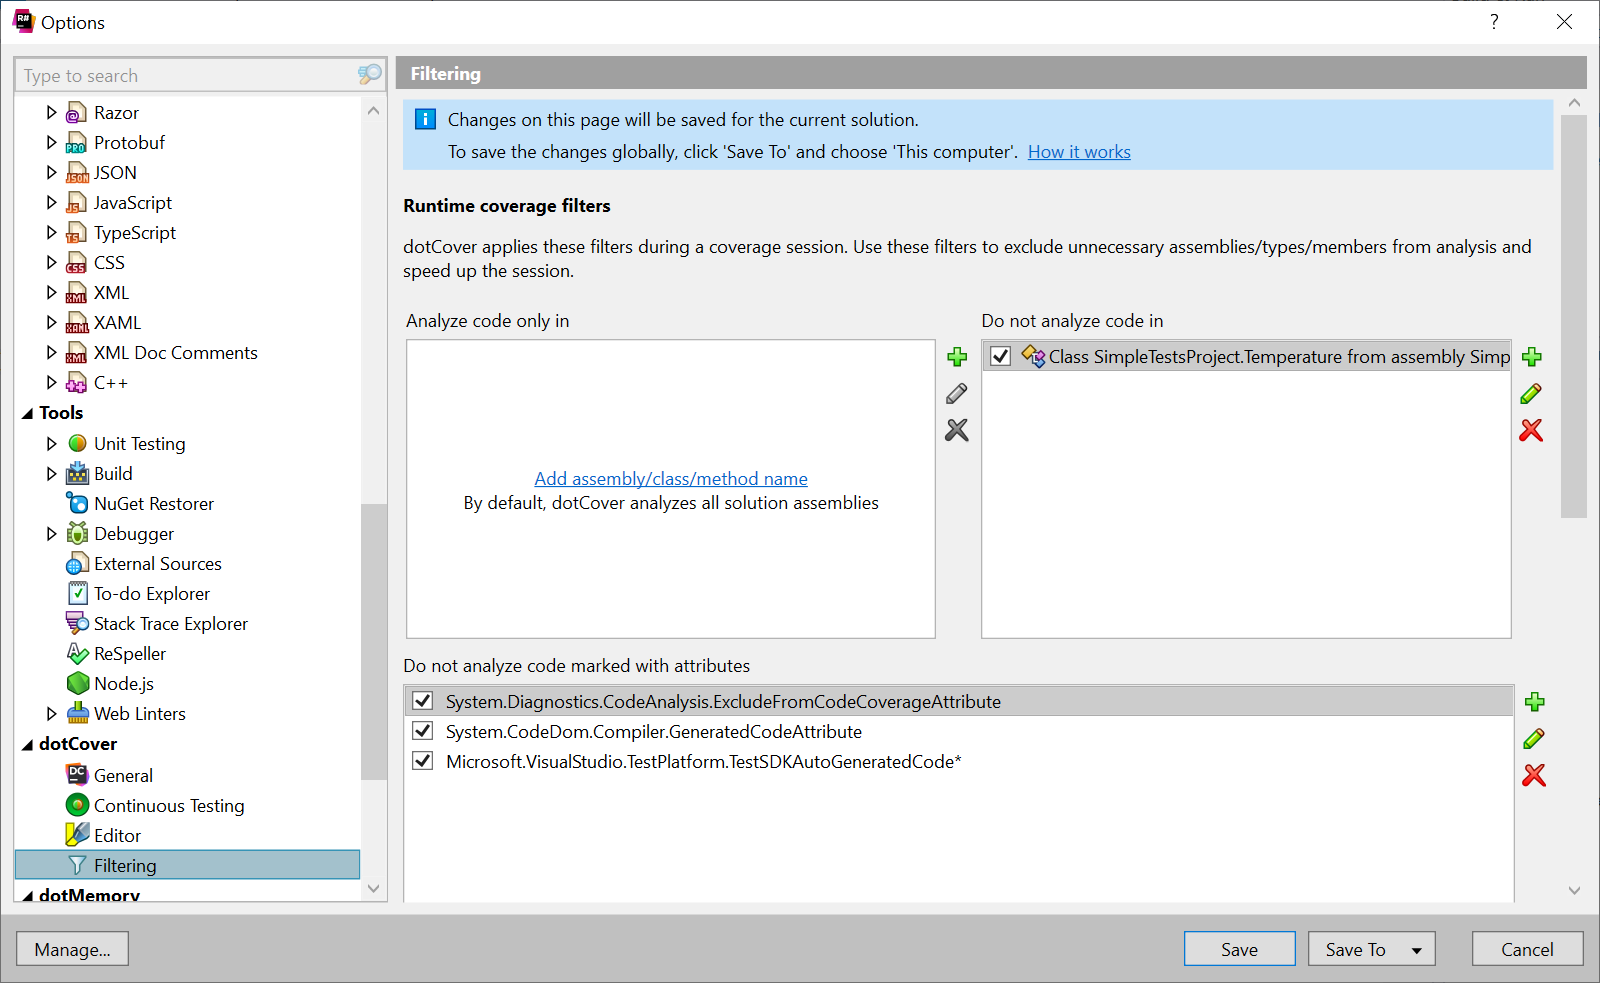
Coverage filters can also be managed through the Filtering dotCover settings (Control+Alt+K F, or ). Filters can be defined for any solution you open or scoped to the active solution.
Once you've mastered these basics, you can learn the keyboard shortcuts or check how to work with the command-line version of dotCover.