Inspect and fix C# code
In Smart Mode, each C# file that you open in the editor is analyzed on the fly with hundreds of code inspections:
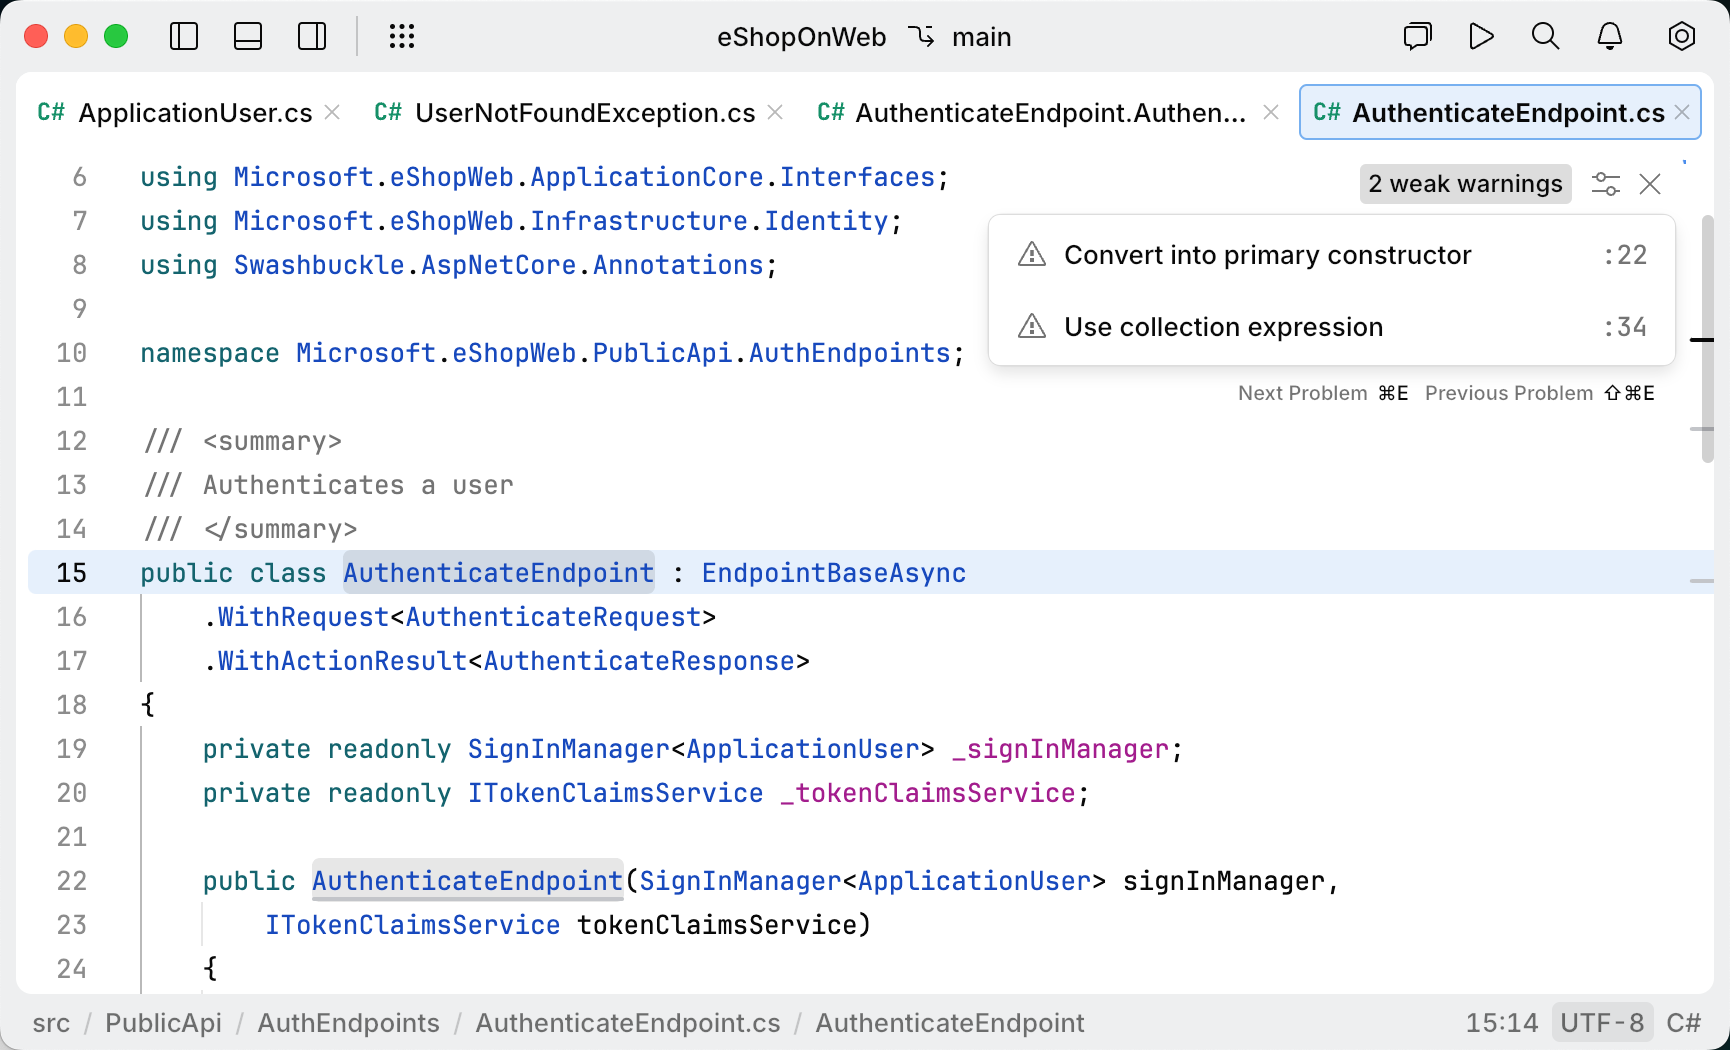
The status indicator in the top-right corner displays the number of code issues detected in the file. You can hover over the indicator to see how many issues of different severity levels are present.
All detected issues are underlined with different colors according to the severity level of the corresponding inspection. For example, red indicates an error (the code will likely not compile), yellow indicates a warning (a compiler warning or suboptimal code), and grey indicates a suggestion (an improvement that can be safely ignored).
Markers on the scrollbar show the relative positions of issues within the file, helping you navigate code issues in large files.

To see why a part of your code is underlined as a code issue, hover over the highlighting:

To go to the next or previous issue in the file, press ⌘ E or ⌘ ⇧ E.
For most detected issues, one or more quick-fixes are available. To see the available fixes, press ⌥ ⏎, then select the desired fix and press ⏎.

Switch context for multiple target frameworks
Results of code inspection can vary depending on the target .NET Framework because different versions of the framework have different features and capabilities, which can affect the behavior of the code. In most cases, each file belongs to a single project that targets a single .NET Framework, so JetBrains Fleet can unambiguously set a specific framework version context for code inspection in that file.
However, there are two cases when a file can be compiled with different framework versions:
Multiple framework versions are defined in the project file where the file belongs.
A file belongs to several projects with different framework versions.
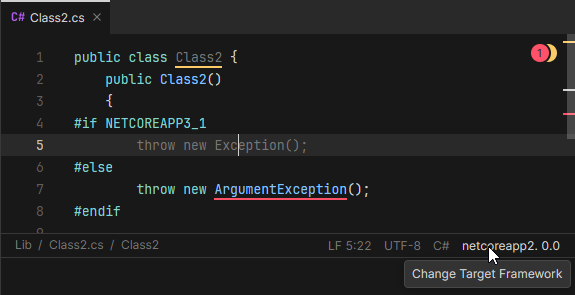
In both cases, the framework version of the current context appears in the bottom-right corner of the editor, and you can click it to switch the context to another version. In the case of multiple frameworks in the project, the context will be switched for the whole project; otherwise, only the file context will be changed.

In the example above there are two unresolved calls in the file — Exception() and ArgumentException() — but only the second call is highlighted as error because the first one if filtered out for .NETCoreApp 3.1 with the #IF directive and .NETCoreApp 2.0 is selected for analysis.
In this section:
- Code inspections in C#
- Value and nullability analysis in C#
- Analysis of integer values in C#
- Collection access analysis in C#
- Code analysis in C# string literals
- Report and update deprecated APIs in C#
- Use annotations to refine code inspection in C#
- List of code inspections in C#