Run profiling
Run profiling
You can start profiling in several ways. All options run your application with the Go profiler.
Run profiling
To run profiling, do one of the following:
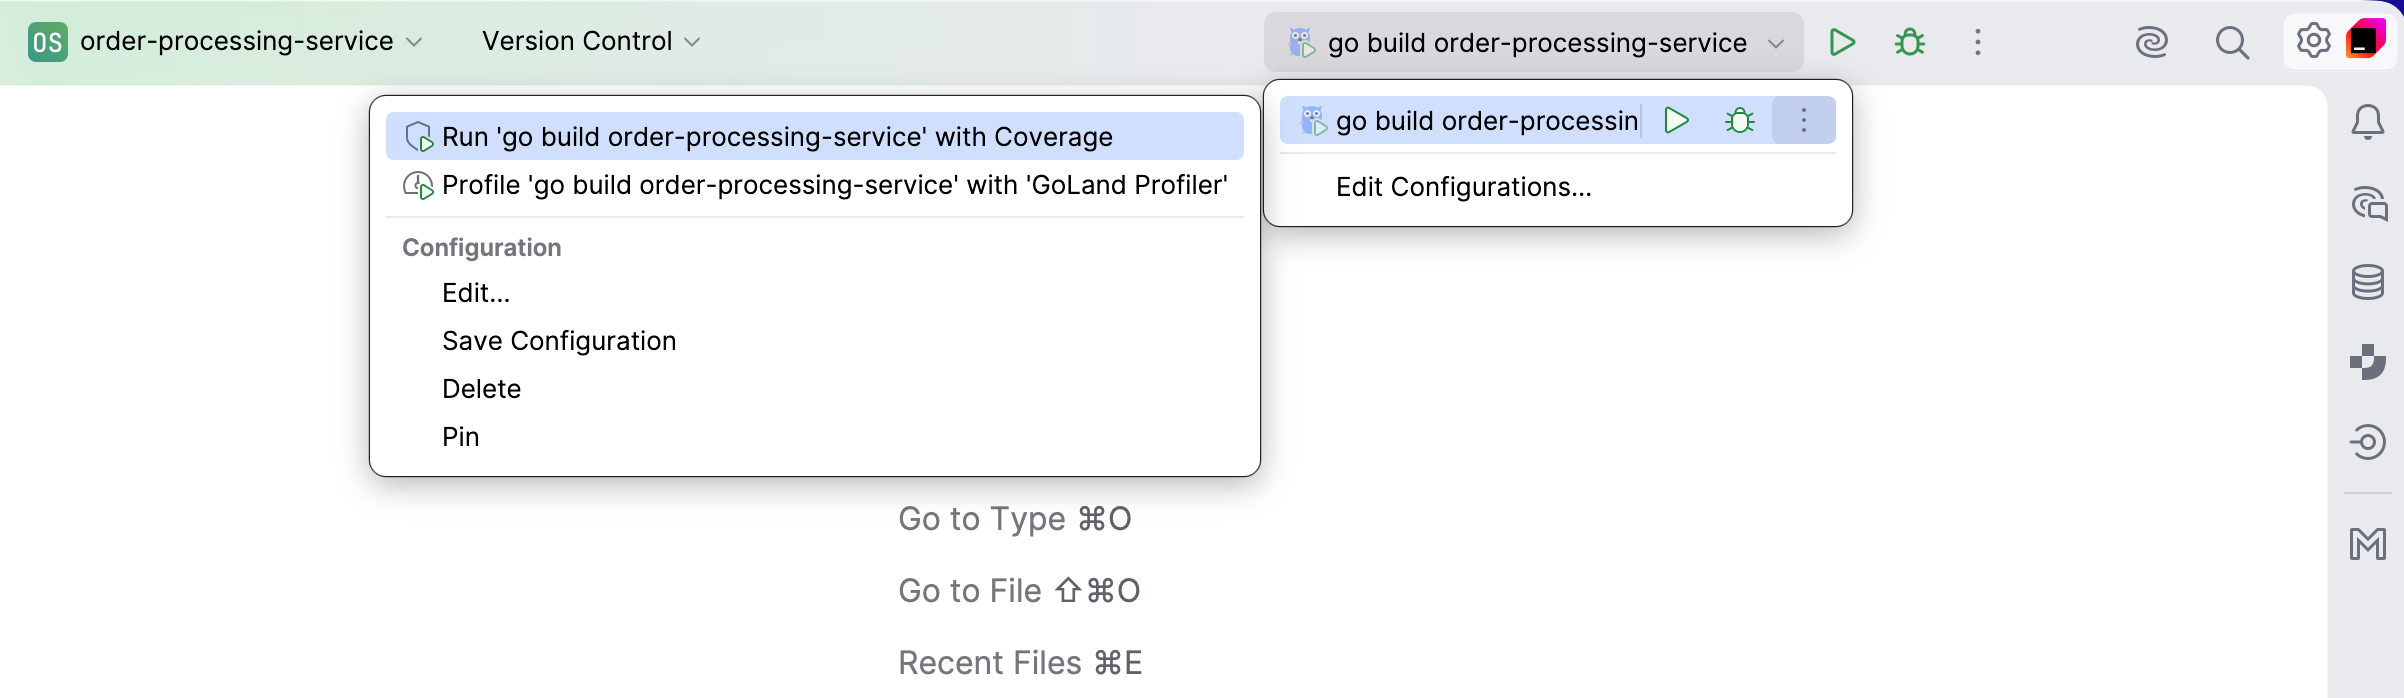
Open the run configuration selector on the toolbar, click the More icon, and select Profile with GoLand Profiler.
Open a file that contains a
mainfunction or a test, click the Run icon ( ) in the gutter, and select Profile with GoLand Profiler.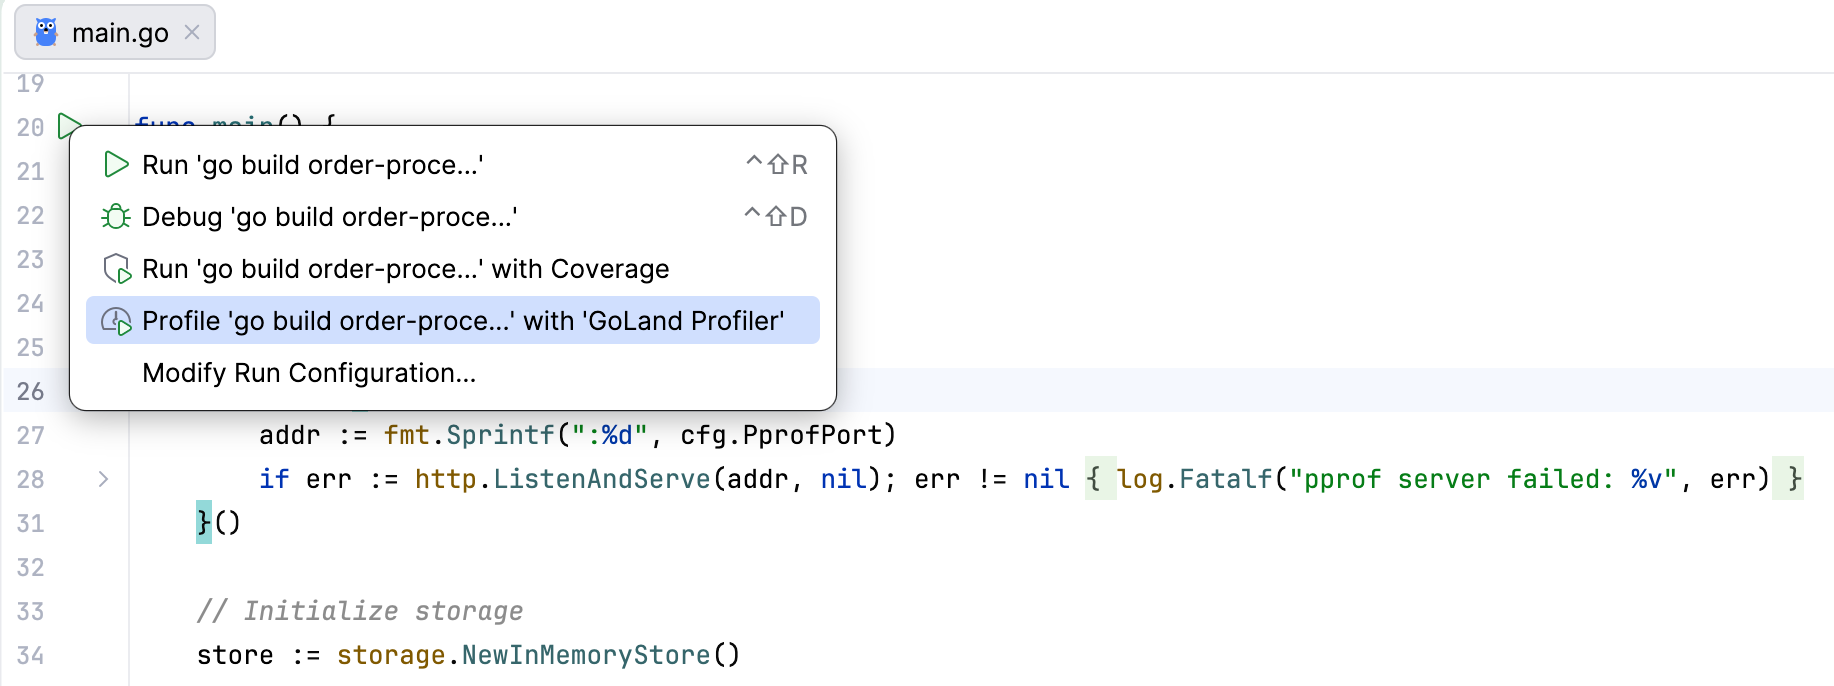
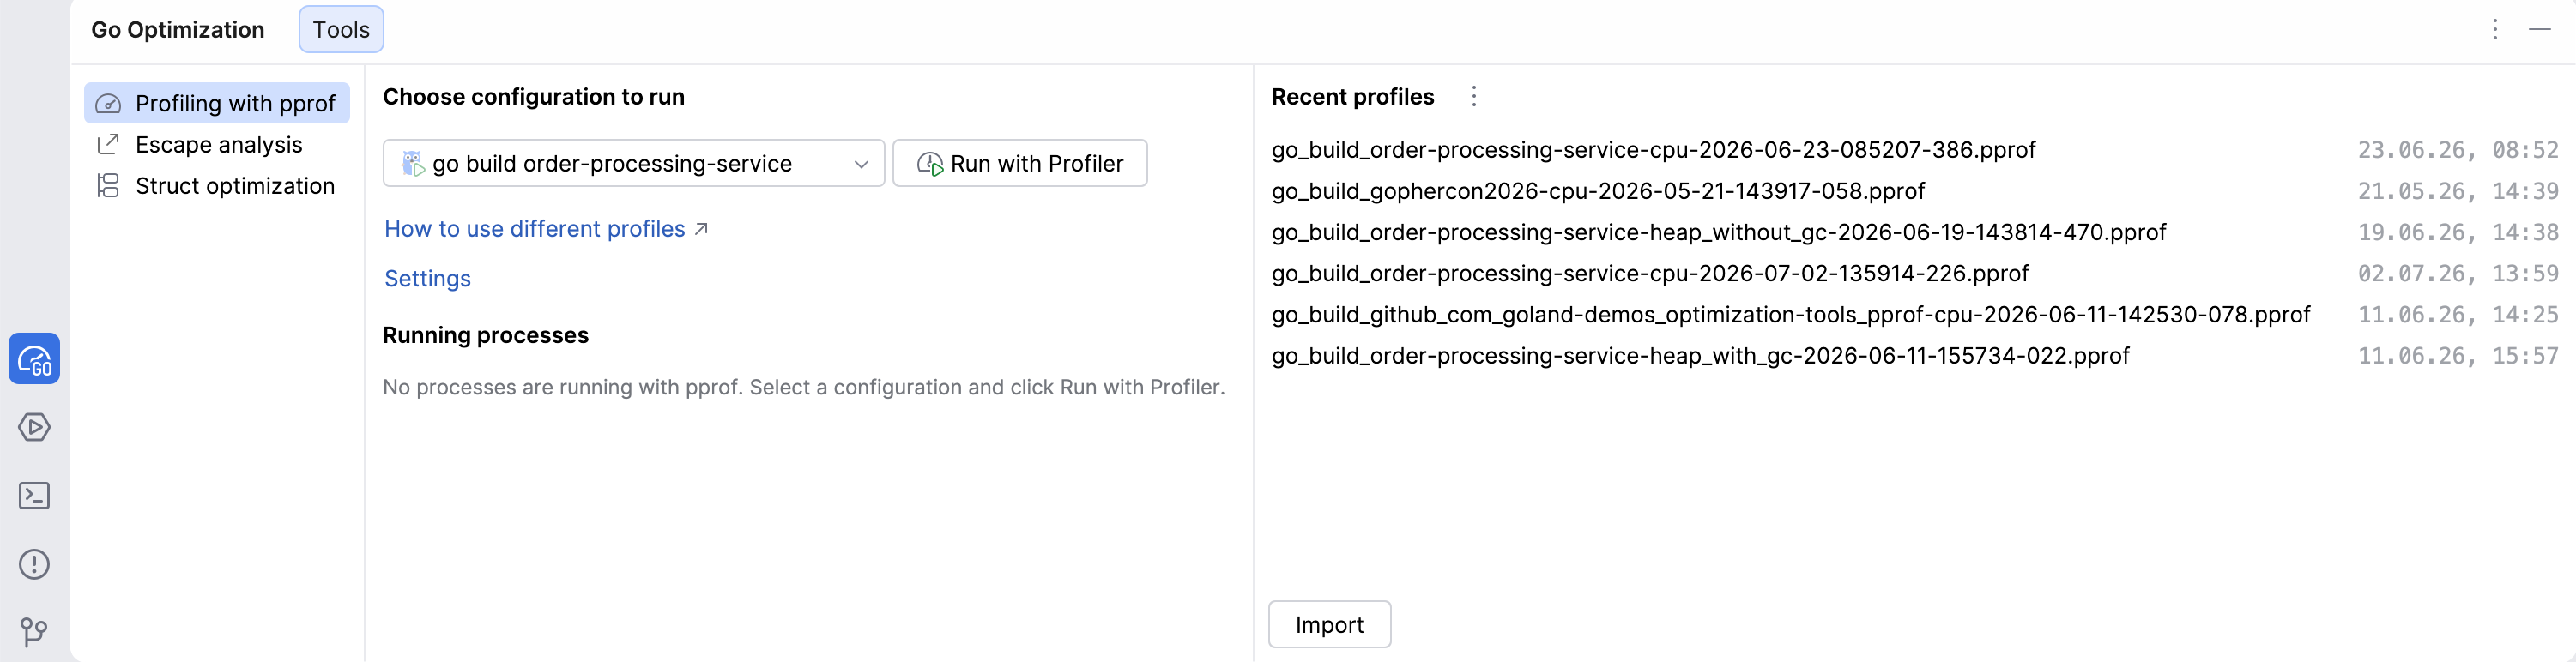
Open the Go Optimization tool window, select a configuration in the Profiling with pprof tab, and click Run with Profiler.
From the Run tool window using Rerun with Profiler.
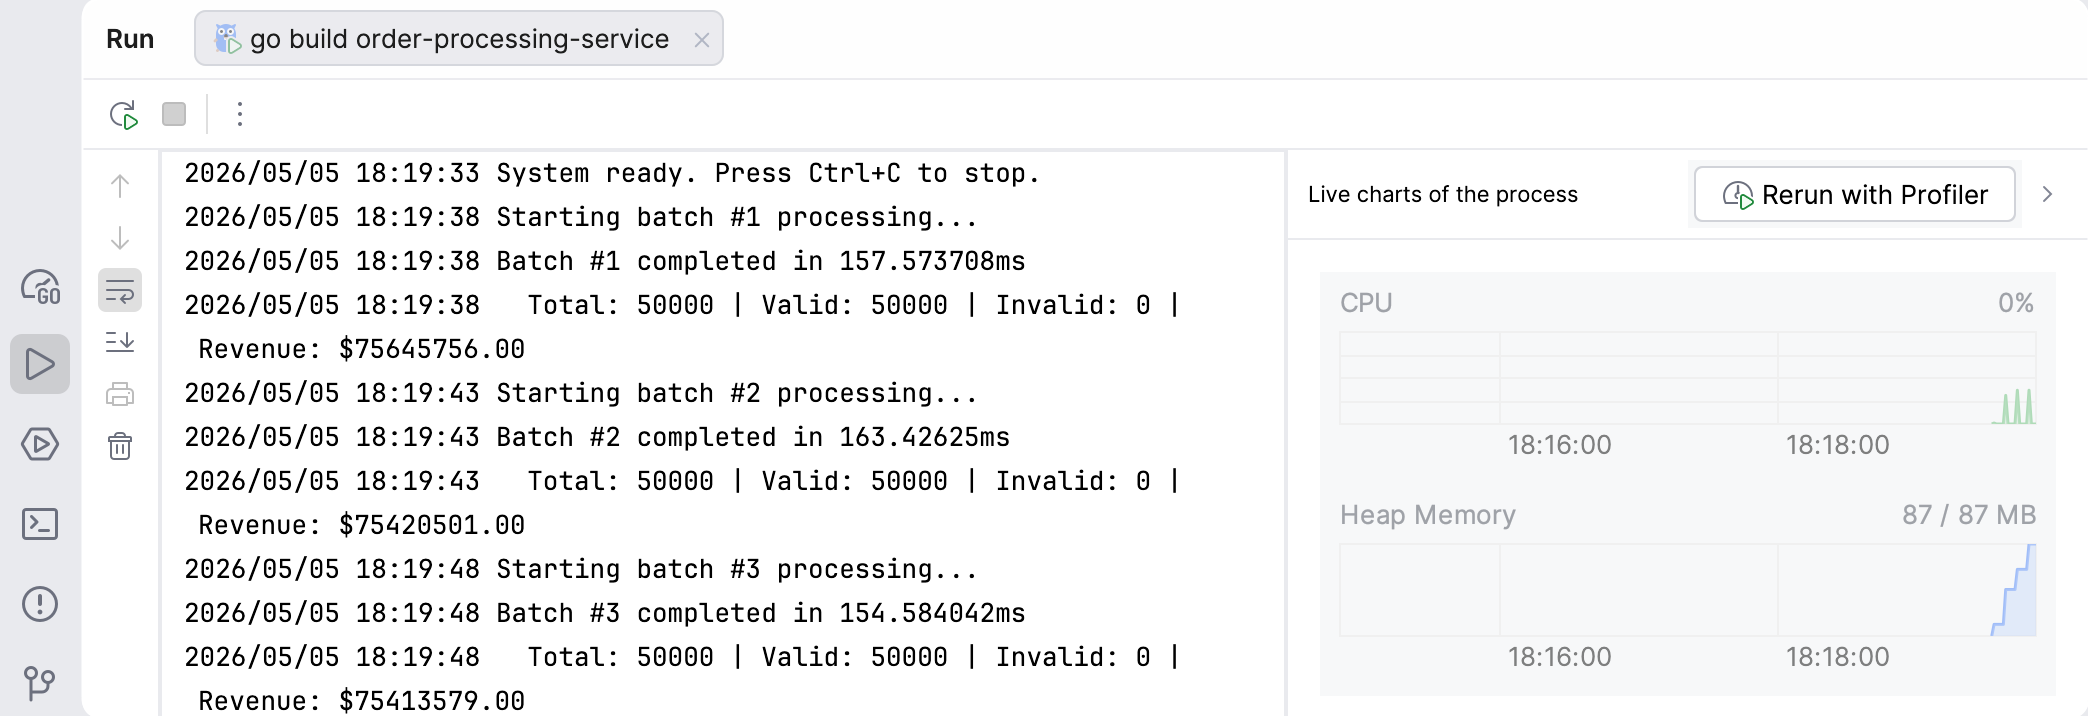
Use the Go Optimization tool window
The Go Optimization tool window provides a central place to run profiling and manage profiling sessions.
Tool window overview
The Go Optimization tool window contains sections to start profiling and manage results.
The following screenshot shows the tool window when no profiling processes are running.
When you start profiling, the tool window displays the Running processes pane.
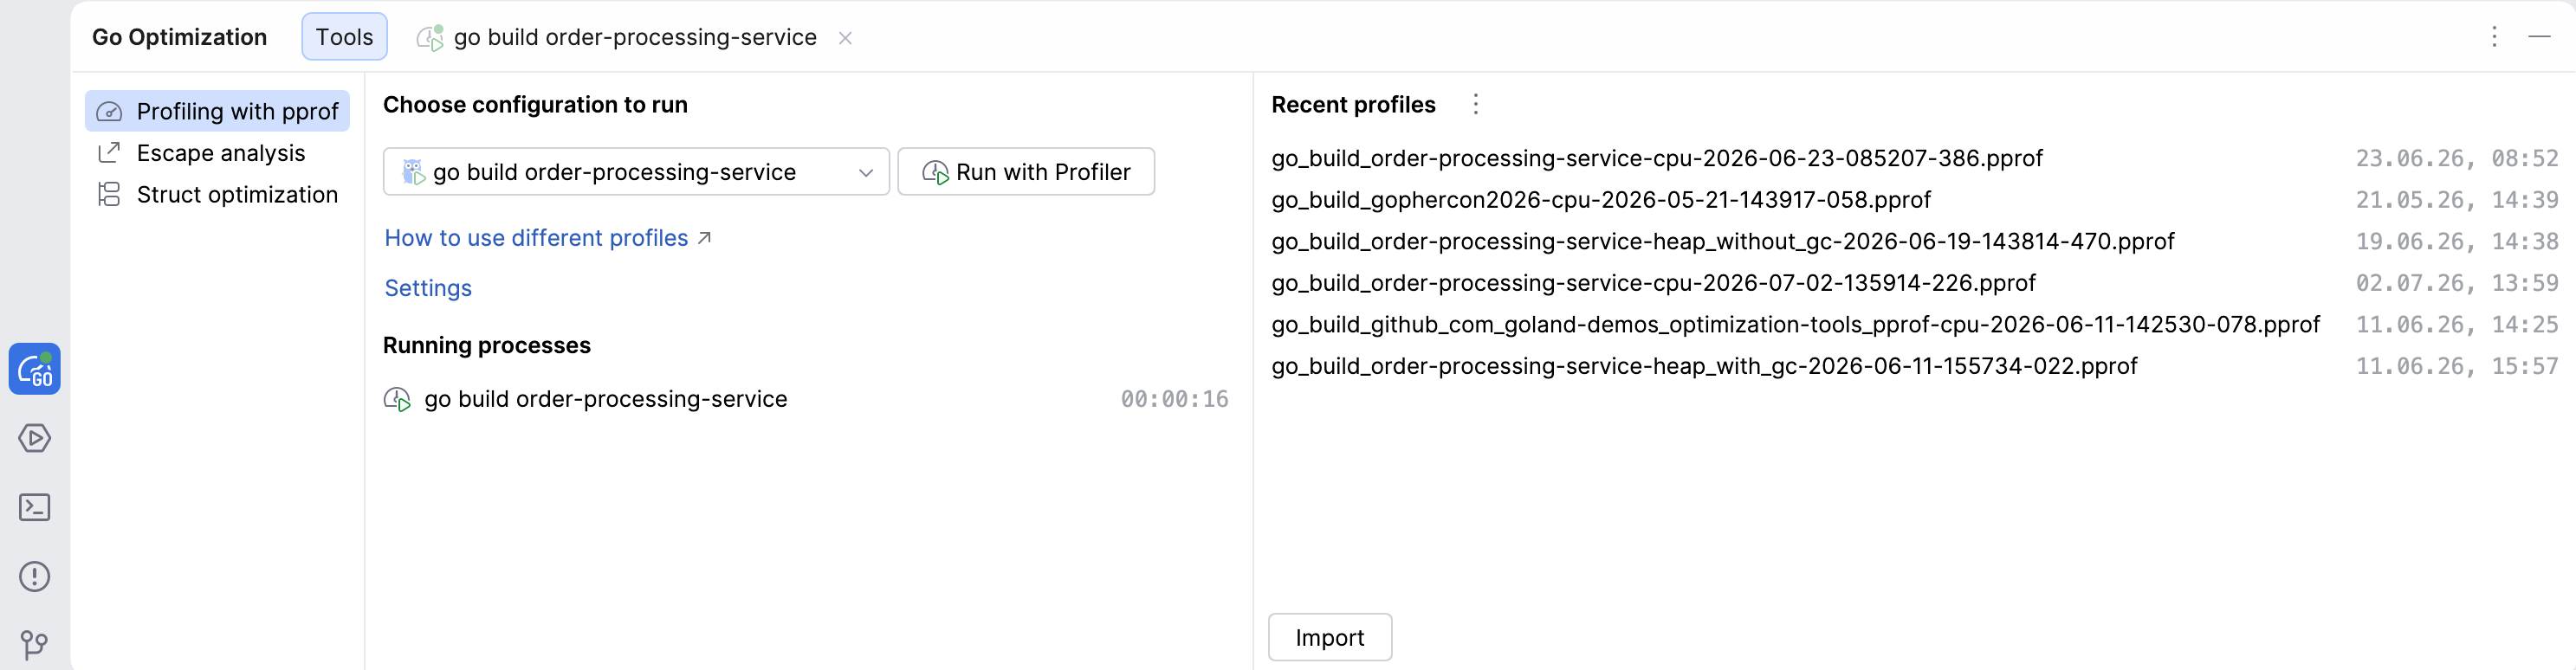
The main components of the Go Optimization tool window are:
Configuration selector lets you choose a run configuration.
Run with Profiler starts profiling for the selected configuration.
Running processes shows active profiling sessions.
Recent profiles lists saved profiling results.
Capture a profile
Capture a profile
Start your application with the Go profiler.
In the Running processes pane of the Go Optimization tool window, click the process. The IDE opens its Run tool window.
On the Go profiler toolbar in the Run tool window, click the action for the profile that you want to capture.
For a CPU profile, click Start CPU Recording, run the workload that you want to analyze, and then click Stop CPU Recording.
For a heap profile, click Heap with GC to run garbage collection before capture. Click Heap without GC to capture the profile without forcing garbage collection.
To capture another profile, click its action. Click More Profiles to select Heap without GC, Block, Mutex, or Goroutine Leak.
Work with profiling sessions
GoLand stores collected profiles in the Recent profiles section in a pprof-compatible format.
View and open profiles
Navigate to .
In the Go Optimization tool window, locate the Recent profiles section.
Click a profile to open it in the profiler view.
You can import pprof-compatible profiling data that was collected outside the IDE.
Import a profile
In the Go Optimization tool window, click Import.
In the file browser, select a pprof-compatible profile file.
Open the imported profile from the Recent profiles section.
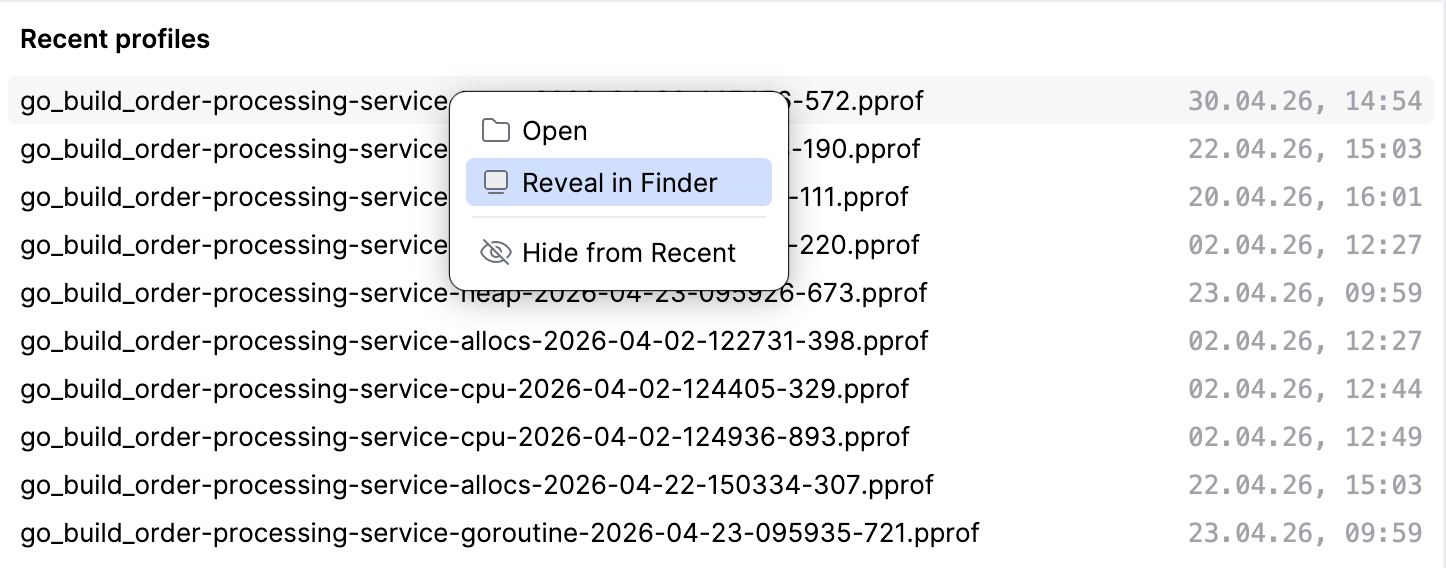
Export a profile
In the Recent profiles section, right-click a profile.
Select Reveal in Finder on macOS, Reveal in Explorer on Windows, or Reveal in File Manager on Linux.
In the file manager, copy or move the pprof-compatible profile file to the required location.