Read the pprof profile
After you collect a profile, you can analyze it in the Go Optimization tool window.
CPU, Heap, Allocs, Block, and Mutex profiles use sampled data, so their values are estimates. Goroutine and Goroutine Leak profiles are snapshots of the goroutines that they report at the time of capture.
You can view the data using different representations, such as a table, a call graph, or a flame graph. Each view highlights a different aspect of performance and helps you find expensive functions and call paths.
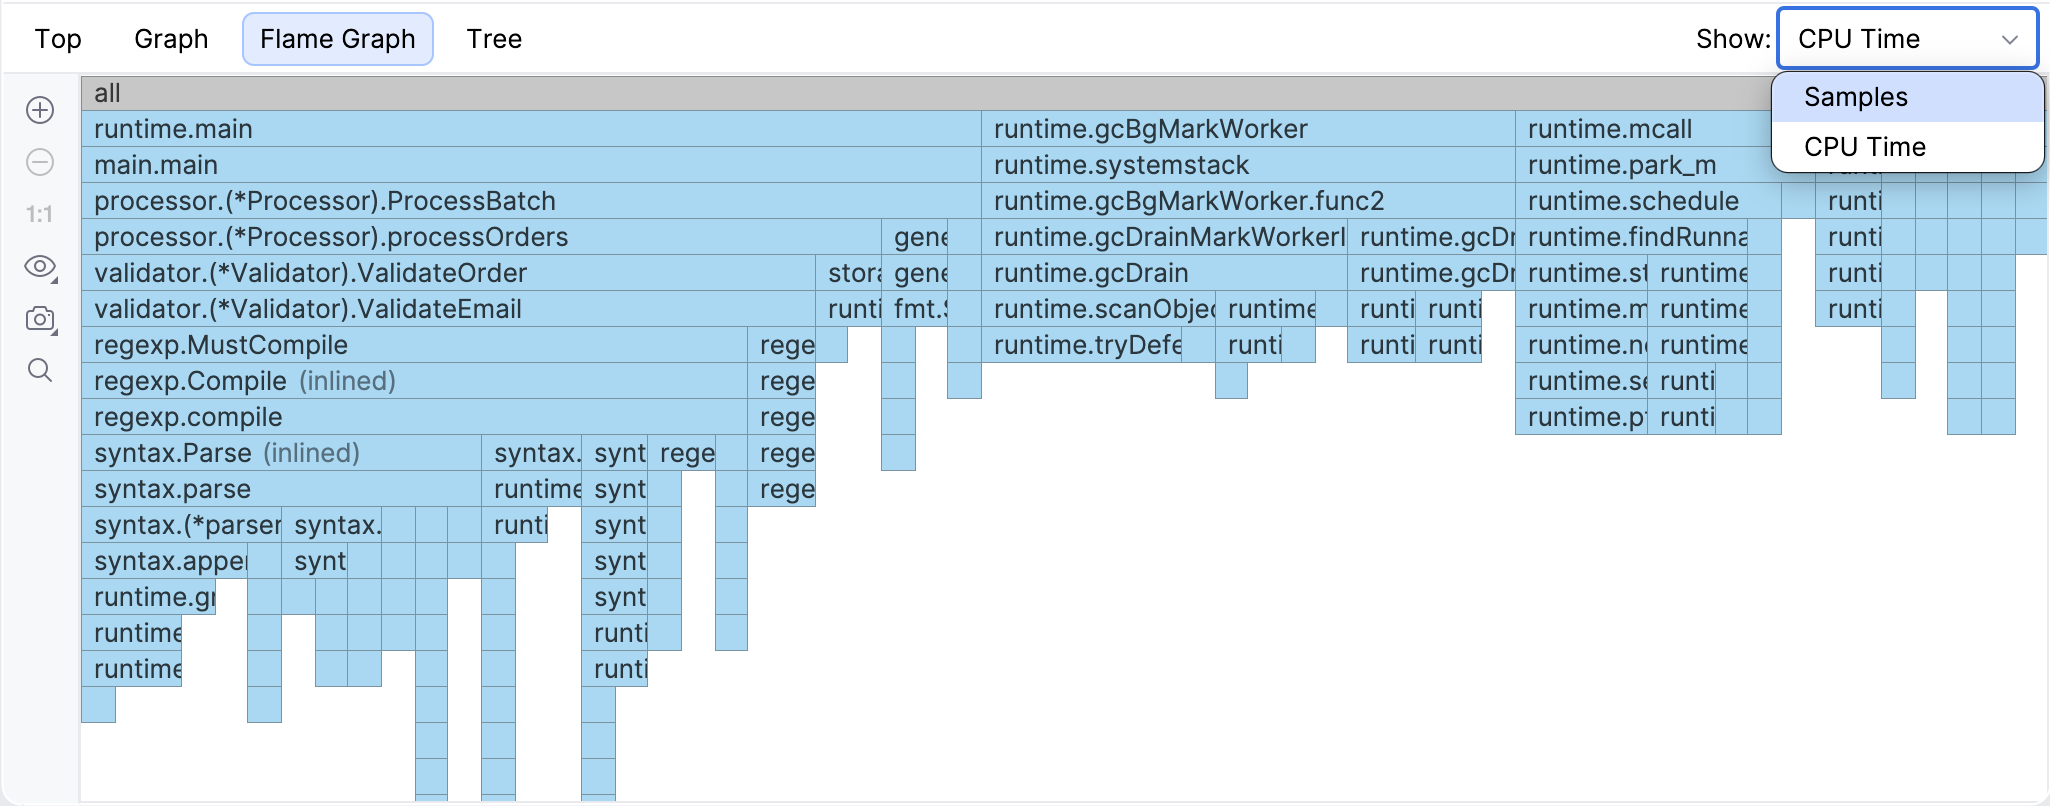
By default, GoLand opens a profile in the Flame Graph view.
Switch a sample type
Use the Show menu in the top-right corner of the tool window.
The Go profiler provides several views to analyze the snapshot:
Top: a flat view that shows aggregated statistics for functions.
Graph: a call graph that shows relationships between functions.
Flame Graph: a visual representation of call stacks that helps you identify hot paths.
Tree: a hierarchical view of function calls. It shows CPU time, memory, delay, or a count, depending on the selected sample type.
Top
The Top view shows profiling data for functions in a flat table. Each row represents a function.
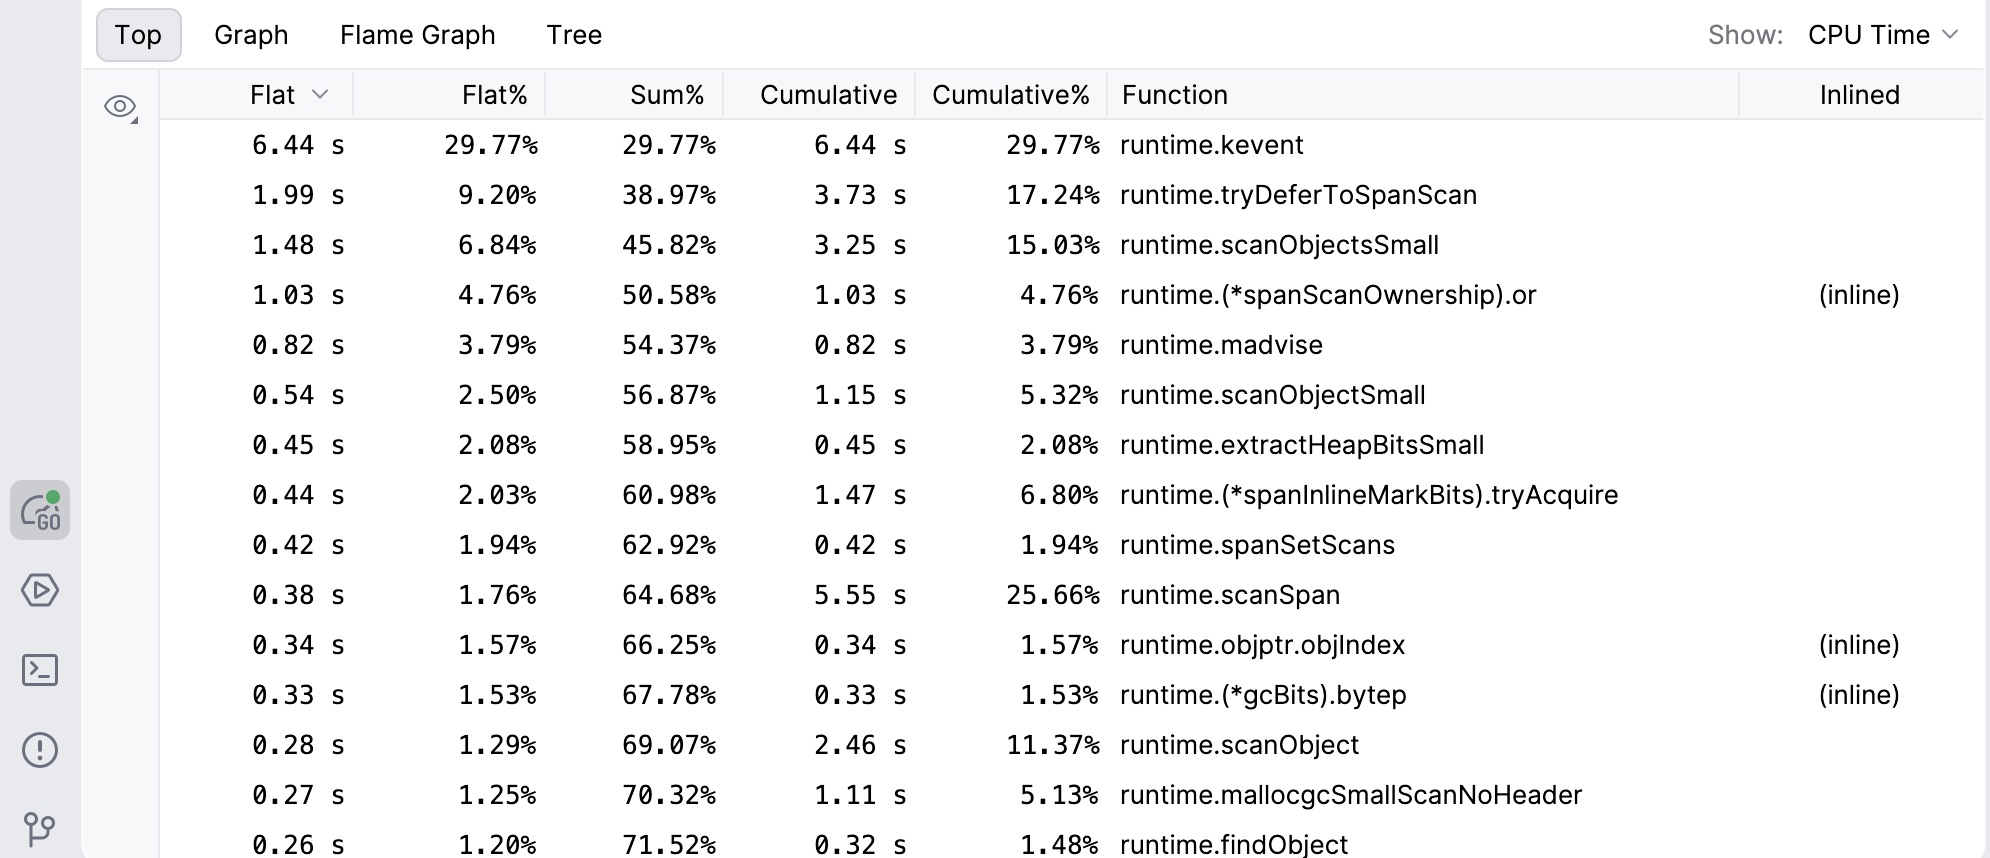
The view aggregates data from the selected profile. For profiles that use sampling, the numbers are estimates.
The selected sample type determines what the numbers show:
CPU Time: CPU execution time.
Allocated space and In-use space: memory in bytes.
Delay: time that goroutines spent waiting.
Samples: number of stack samples that include the function.
Allocated objects and In-use objects: number of objects.
Contentions: number of waits for a lock or another synchronization operation.
Goroutine and Goroutine Leak: number of goroutines with the stack trace.
The table includes the following metrics:
Flat – CPU time, memory, delay, or a count from the function itself. It does not include data from functions that it calls.
Flat% – the percentage of total CPU time, memory, delay, or count from the function itself.
Sum% – the running total of Flat% values from top to bottom.
Cumulative – total CPU time, memory, delay, or count from the function and all functions that it calls.
Cumulative% – the percentage of total CPU time, memory, delay, or count from the function and its callees.
Use this view to find the most expensive functions. Start with functions that have the highest Flat or Cumulative values.
Navigate to source code
Click a function in the table to open its source code.
Sort results
Click a column header to sort functions by the selected metric, for example Flat or Cumulative.
Search in the top
Type a function name to highlight matching blocks.
Graph
The Graph view shows the call graph of your application. It displays functions as nodes and calls between them as edges.
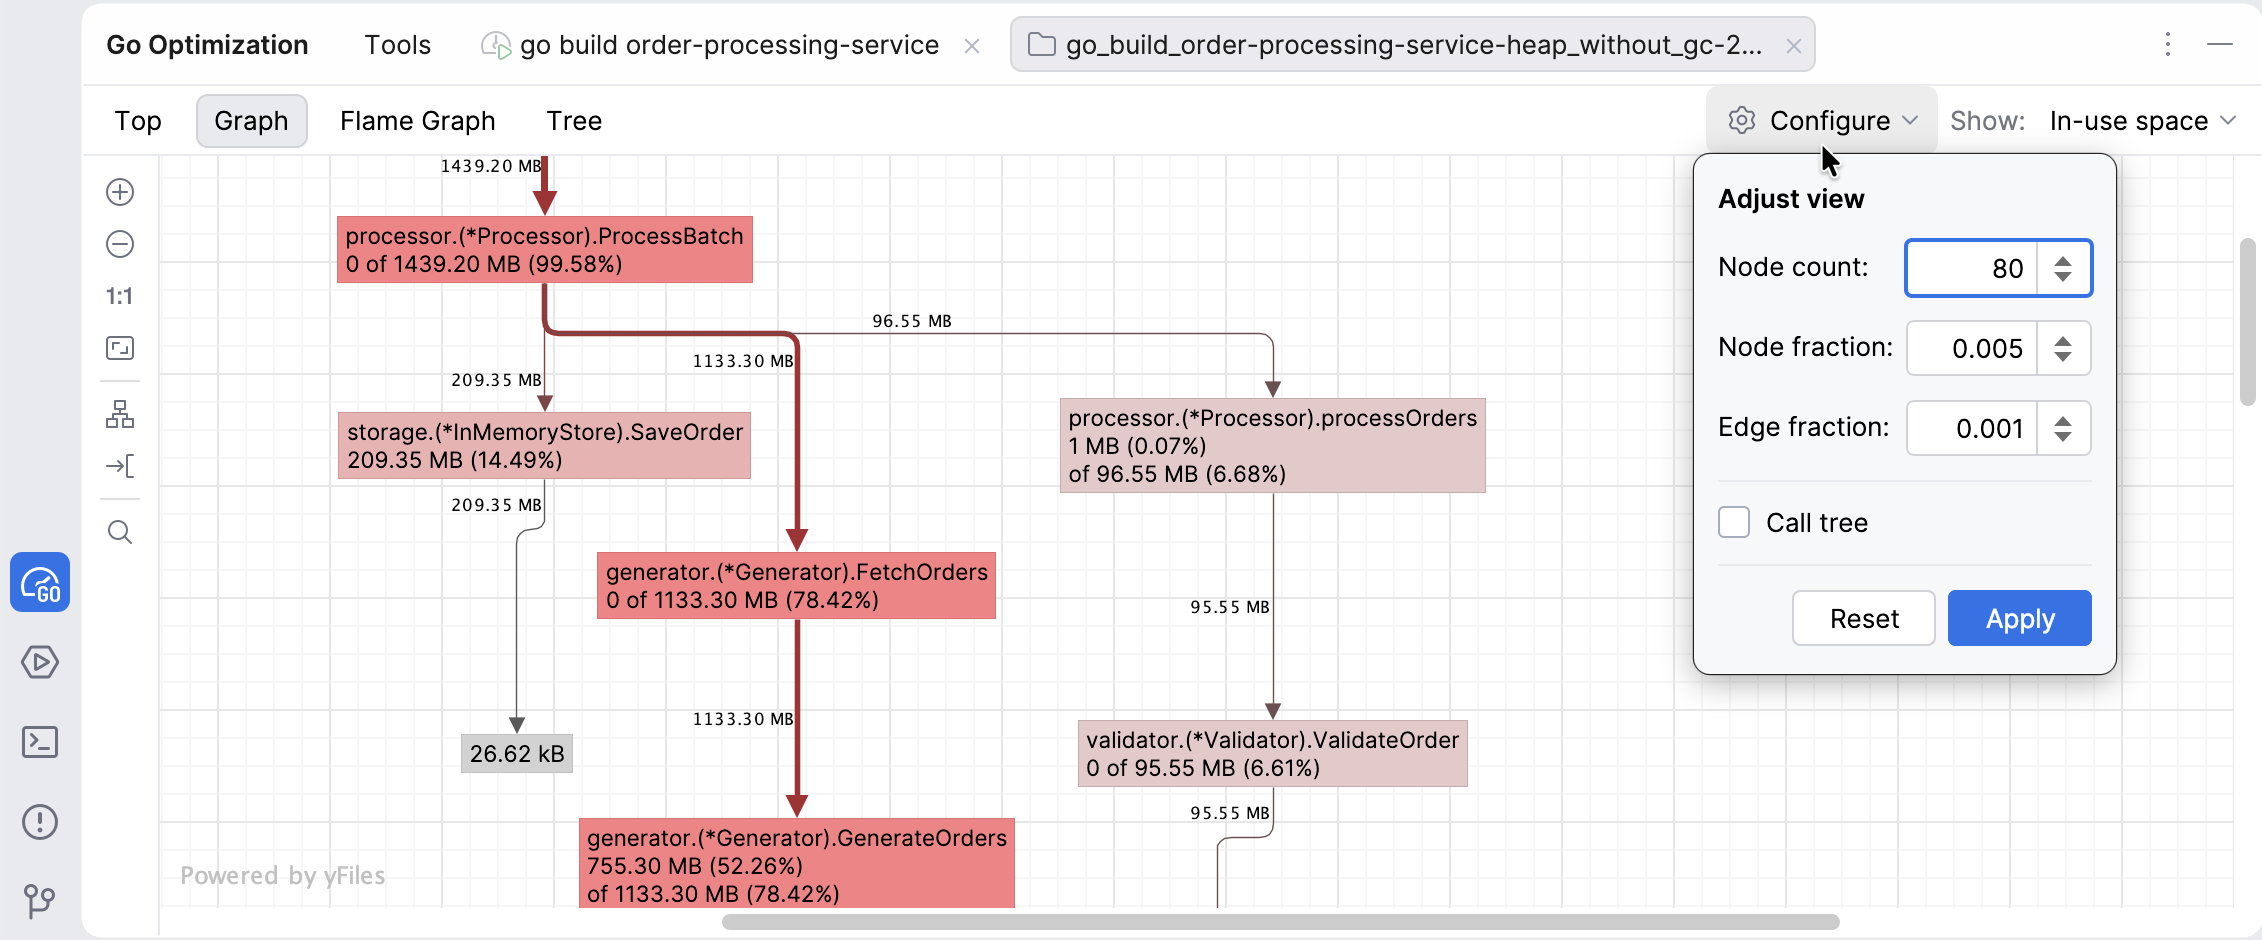
Each node represents a function. Each edge represents a call from one function to another.
In memory profiles, the graph can also include compact allocation nodes that show allocated memory blocks between function calls.
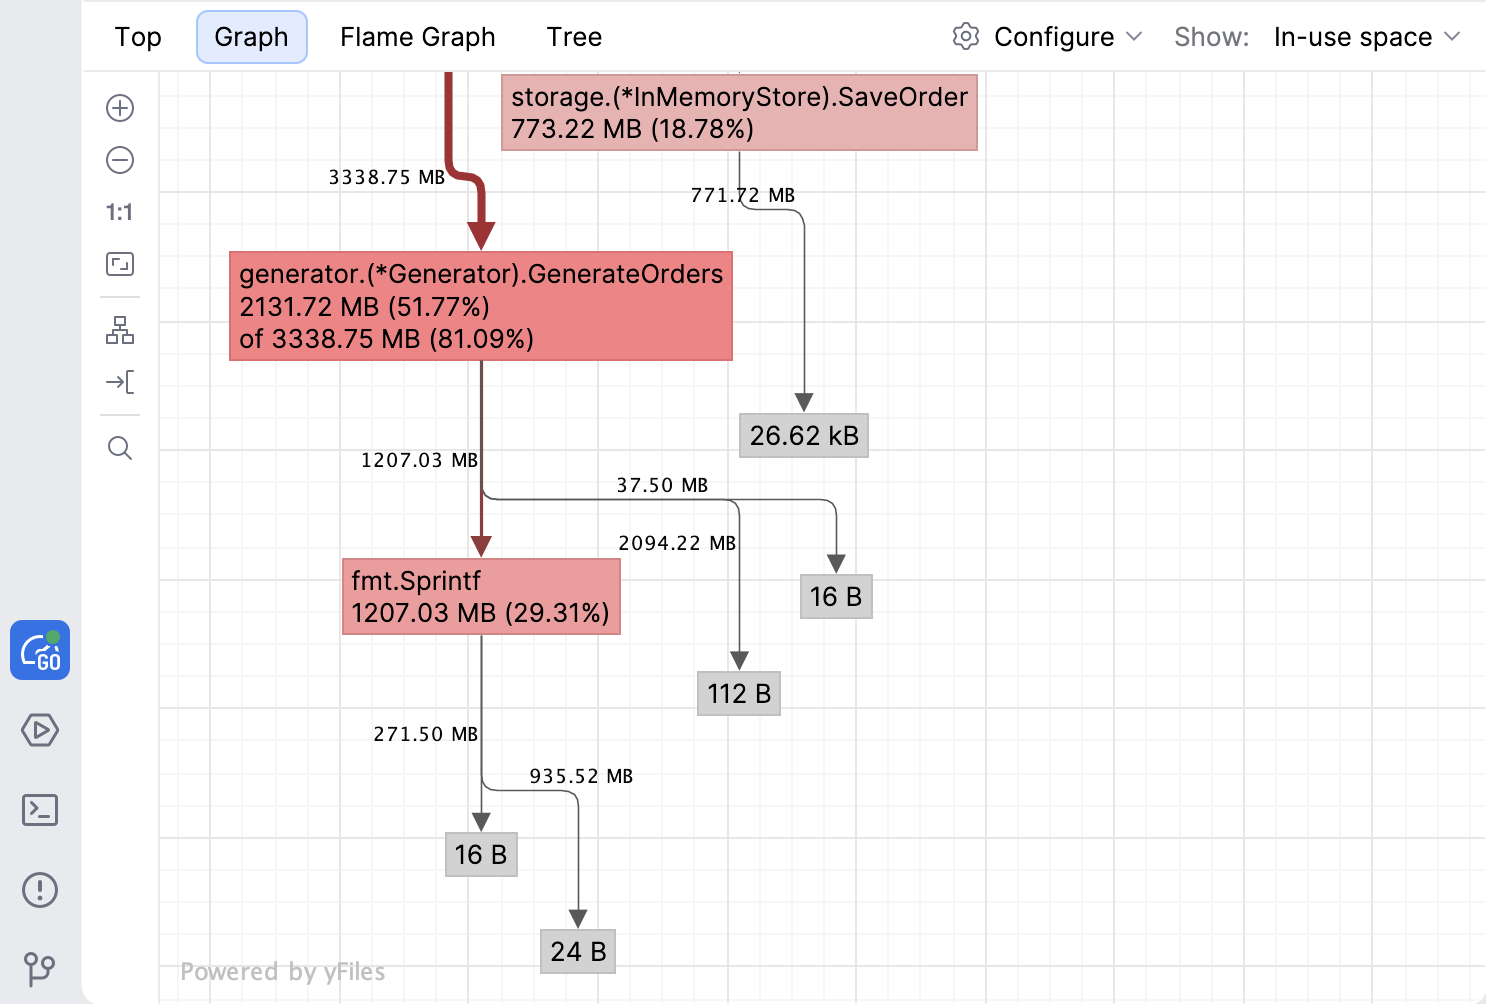
Each node label shows two values:
the value recorded in the function itself
the total value recorded in the function and all functions it calls
Use this view to understand how functions call each other and to identify expensive call paths.
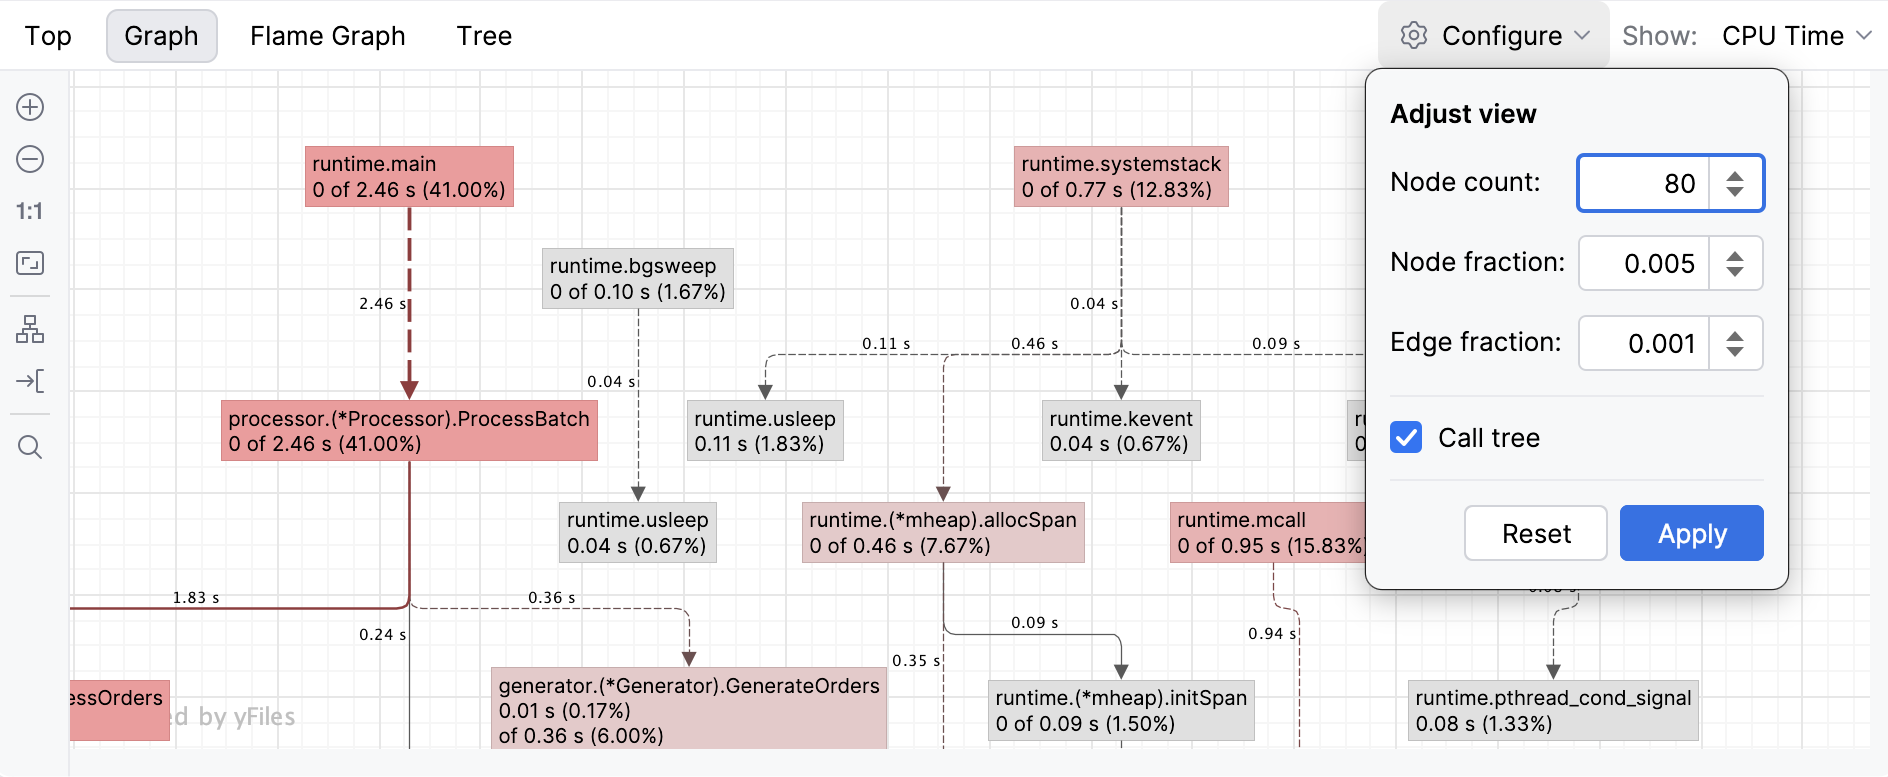
Configure the graph display
Click Configure in the top-right corner.
Configure the graph options:
Node count limits the number of displayed functions.
Node fraction hides functions that contribute less than the specified share of total samples.
Edge fraction hides calls that contribute less than the specified share of total samples.
Call tree controls how functions are displayed on the graph.
When this option is disabled, nodes with the same function are merged into a single node. When it is enabled, each call is shown separately, which helps you distinguish between different call paths.
For example, if the function
foo()is called from different places in your program, the default graph shows a single node forfoo(), but with Call tree enabled, each call tofoo()appears as a separate node.
Click Apply to update the graph.
Navigate the graph
Click a node to focus on a function and inspect its connections.
Double-click a node to open the function in the editor.
Drag the graph to move the view. You can use the right mouse button, or hold Ctrl and drag with the left or right mouse button.
Search in the graph
Press Ctrl+F or click Find in Graph (
 ) on the left toolbar.
Start typing the function name.
The search popup shows all graph nodes and navigates to the selected function.
Flame Graph
The flame graph shows the call stack as a set of rectangles. Each rectangle represents a function call. The width of a rectangle shows CPU time, memory, delay, or a count, depending on the selected sample type. Wider rectangles indicate heavier functions.
Parent functions appear below their children. This layout helps you understand how work flows through your code.
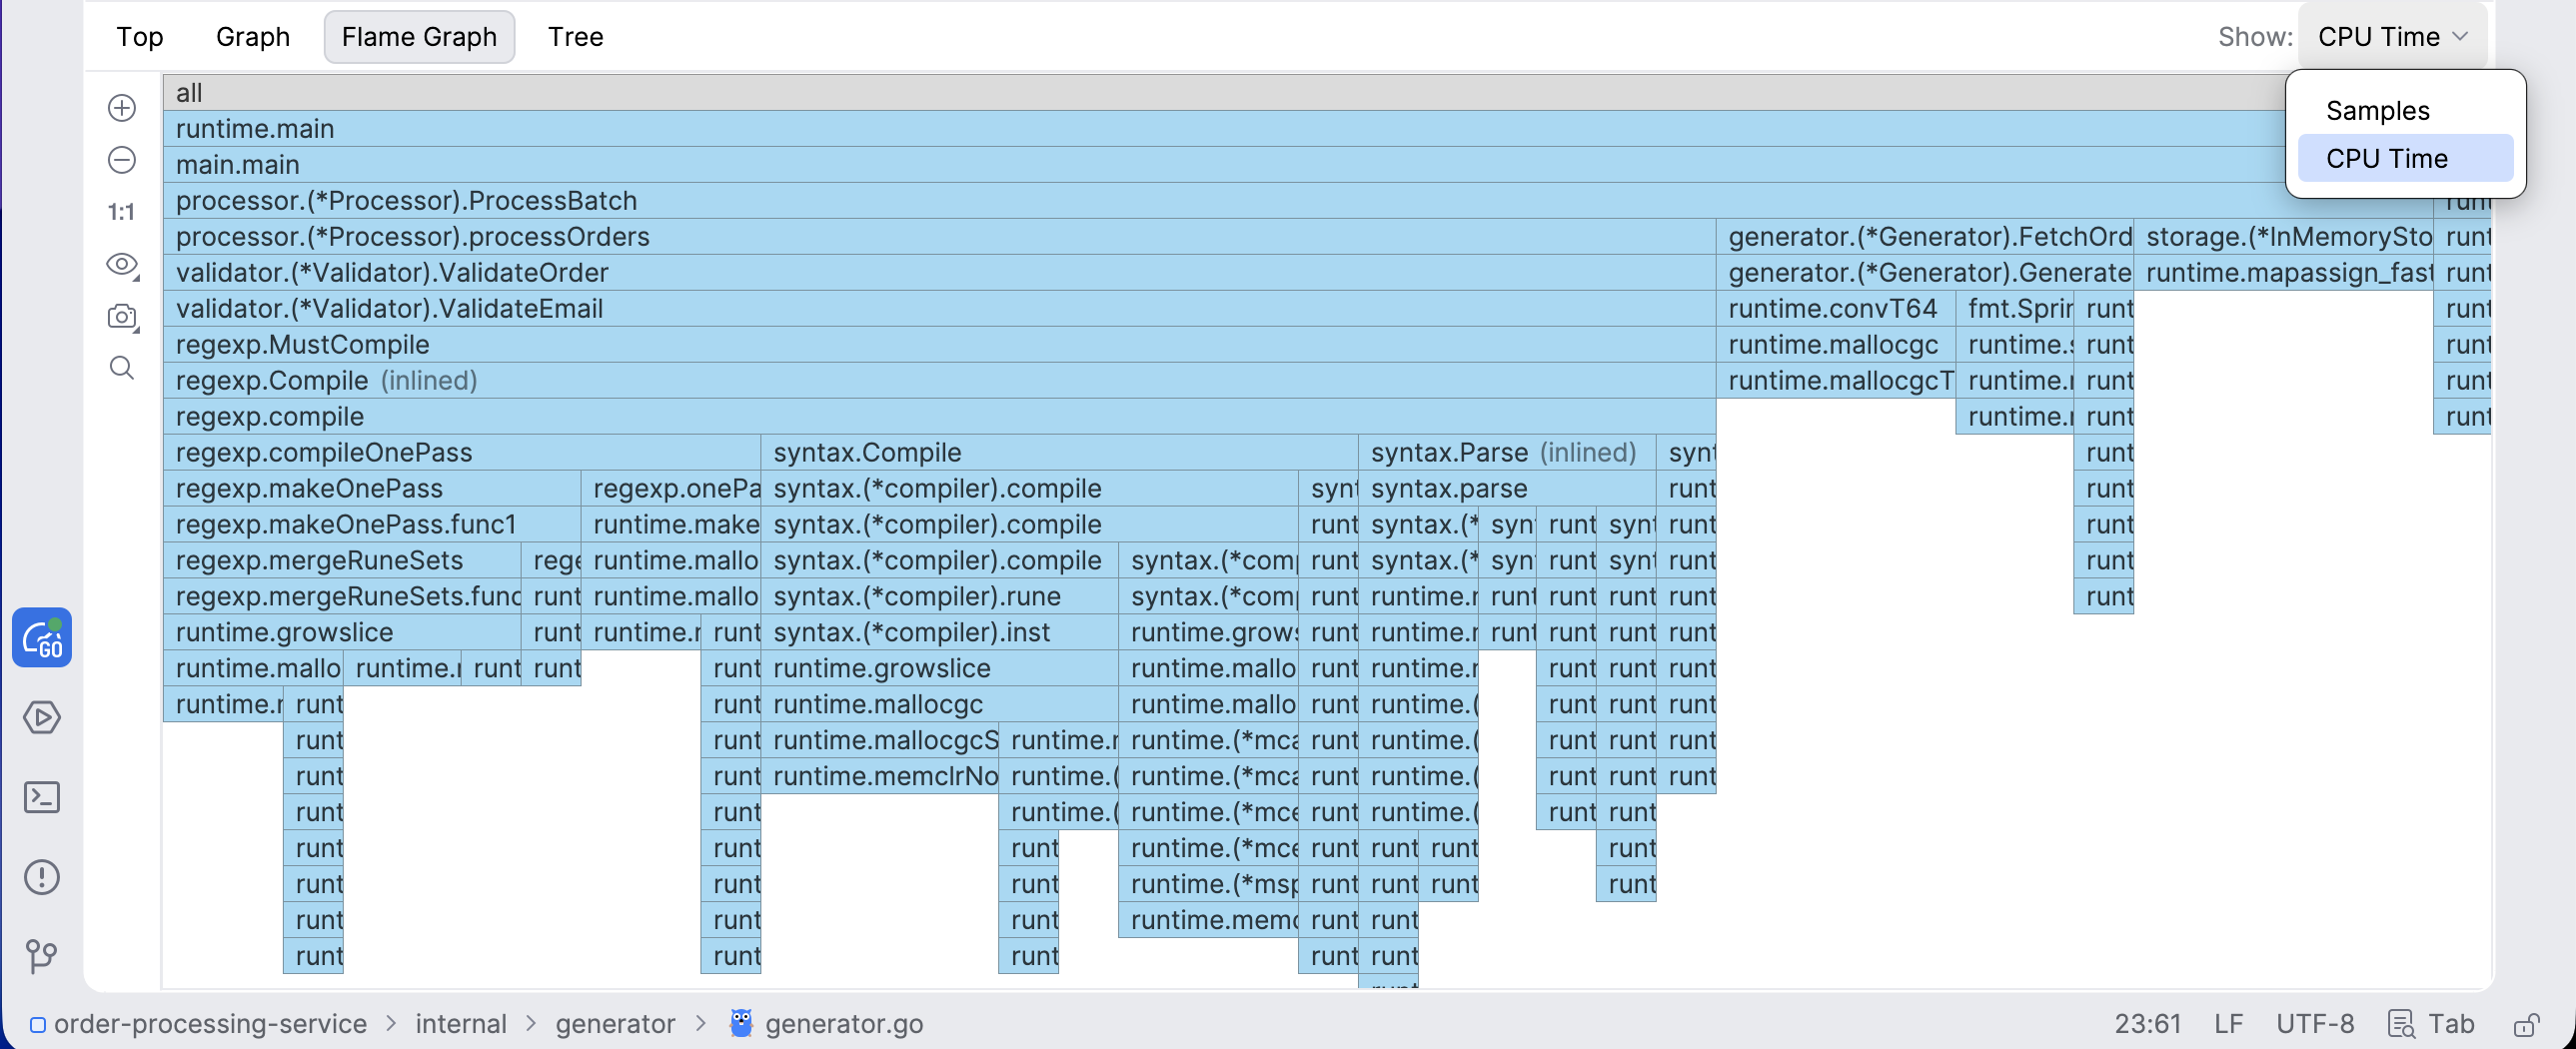
By default, GoLand shows the flame graph as an icicle graph, with the root frame at the top and the call stack going down as you move deeper into the code. You can flip the orientation, and switch to the New Flame Graph view for an alternative rendering, from the presentation settings of the graph.
Zoom the graph
Use the Zoom In (
 ) and Zoom Out (
 ) icons to zoom in or out.
Double-click a block to focus on a specific function.
Click the Reset Zoom (
 ) icon to reset the zoom level.
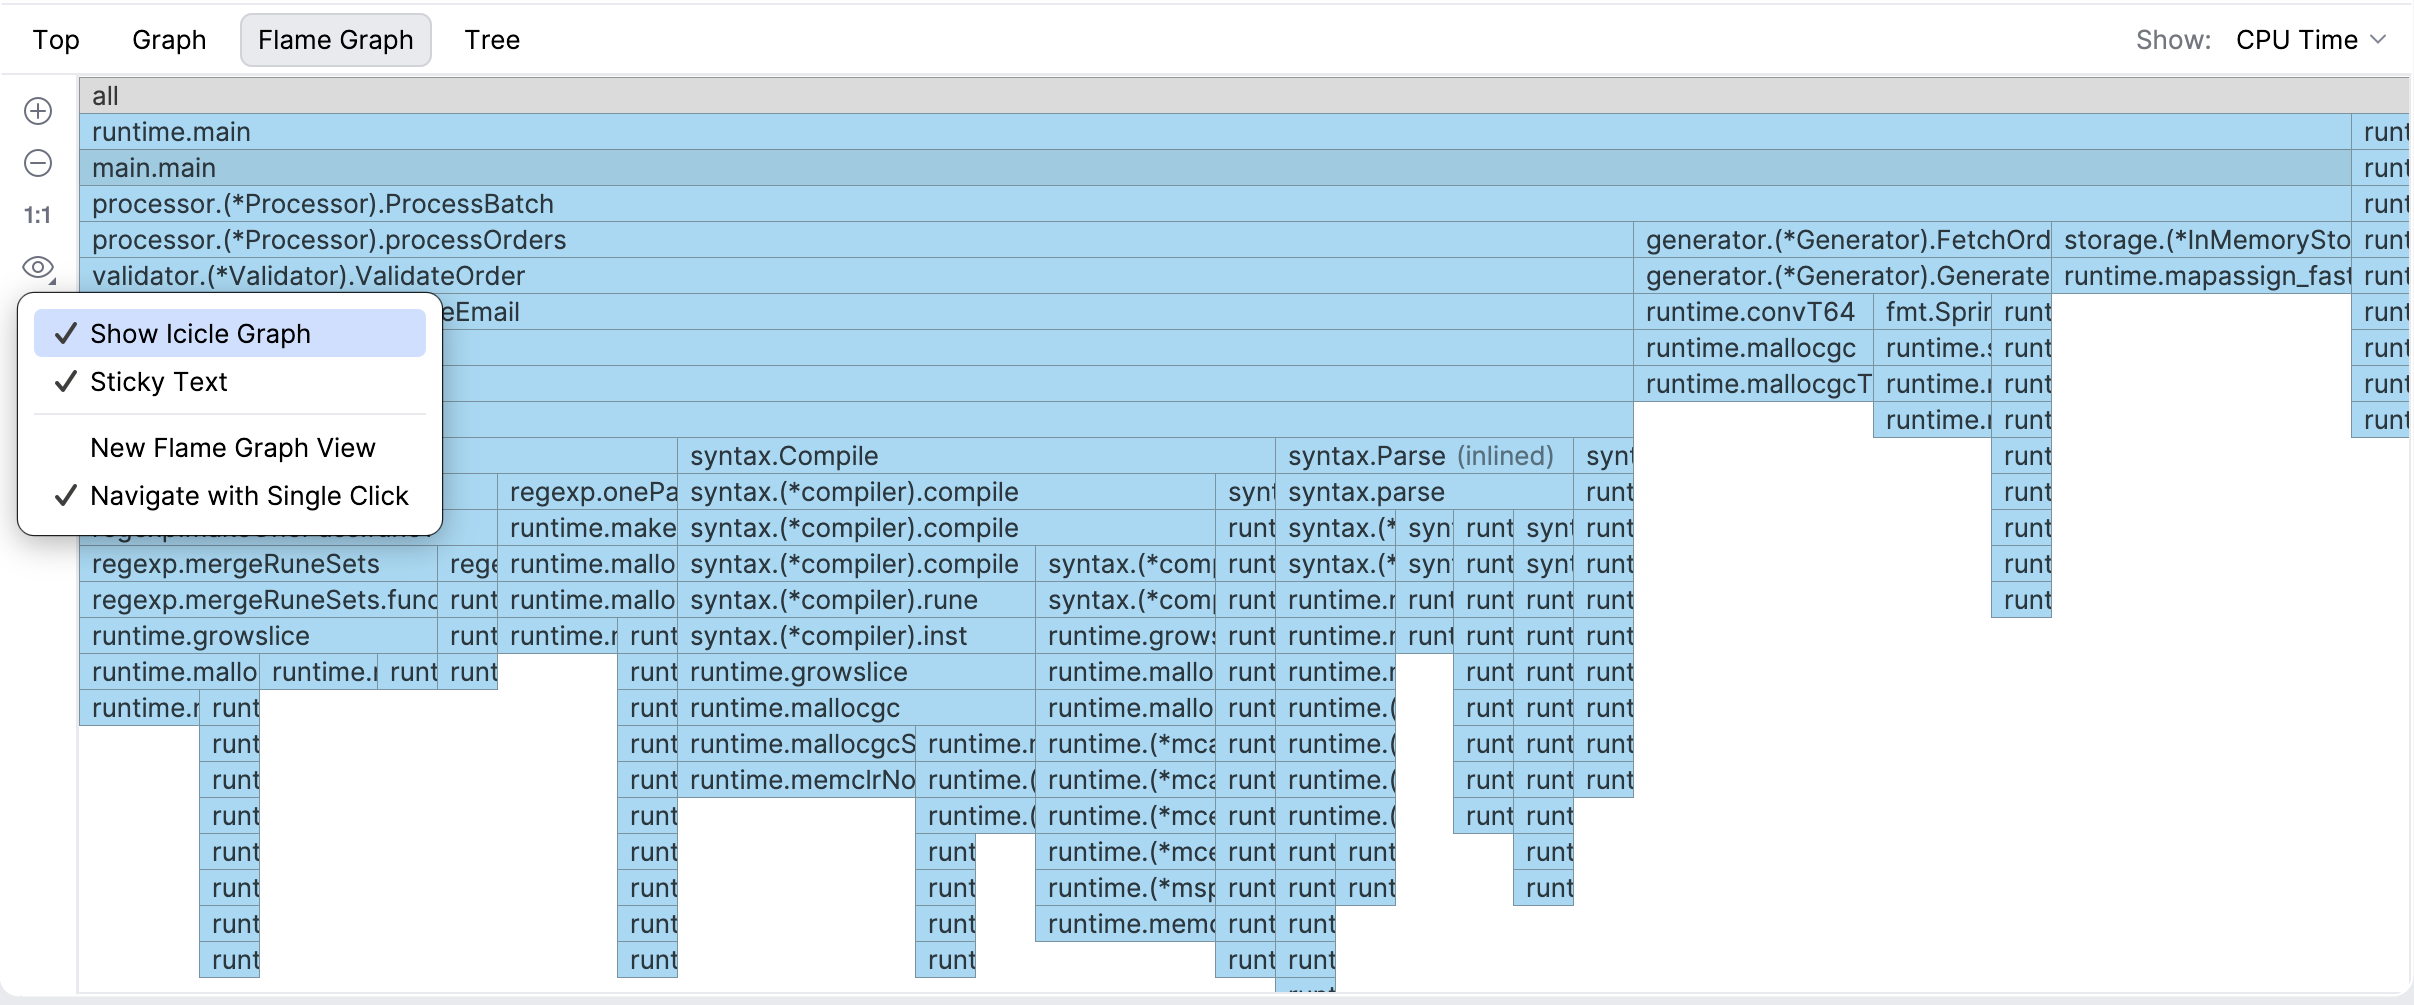
Configure view settings
Open the view settings menu in the toolbar.
Enable or disable the following options:
Show Icicle Graph: switches between flame and icicle layout.
Sticky Text: keeps function names visible when zooming.
New Flame Graph View: uses the updated rendering mode.
Navigate with Single Click: opens functions with one click.
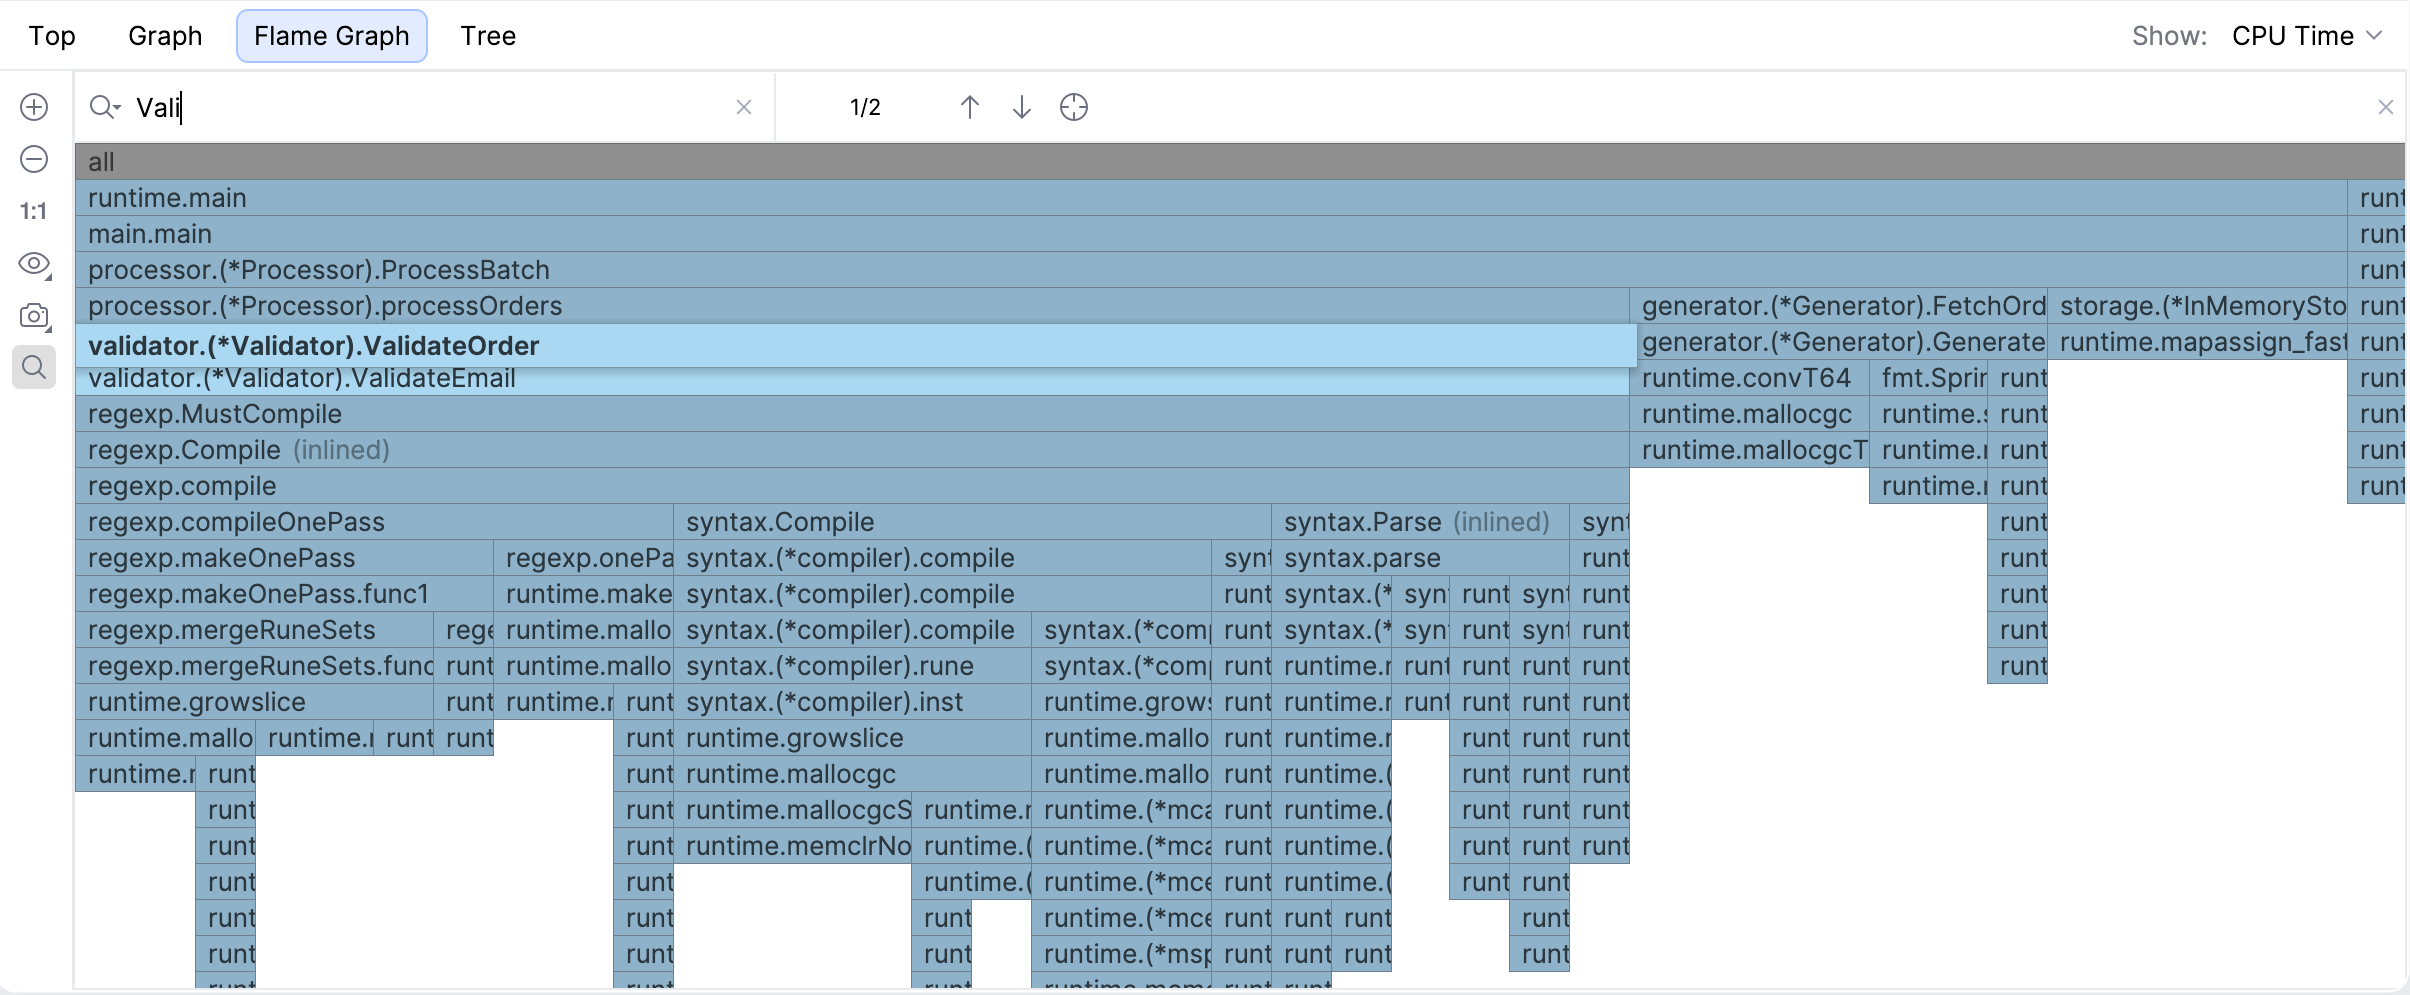
Search in the flame graph
Click the Show Search Toolbar (
) or press Ctrl+F.Type a function name to highlight matching blocks.
Use navigation controls to move between matches.
Get function details
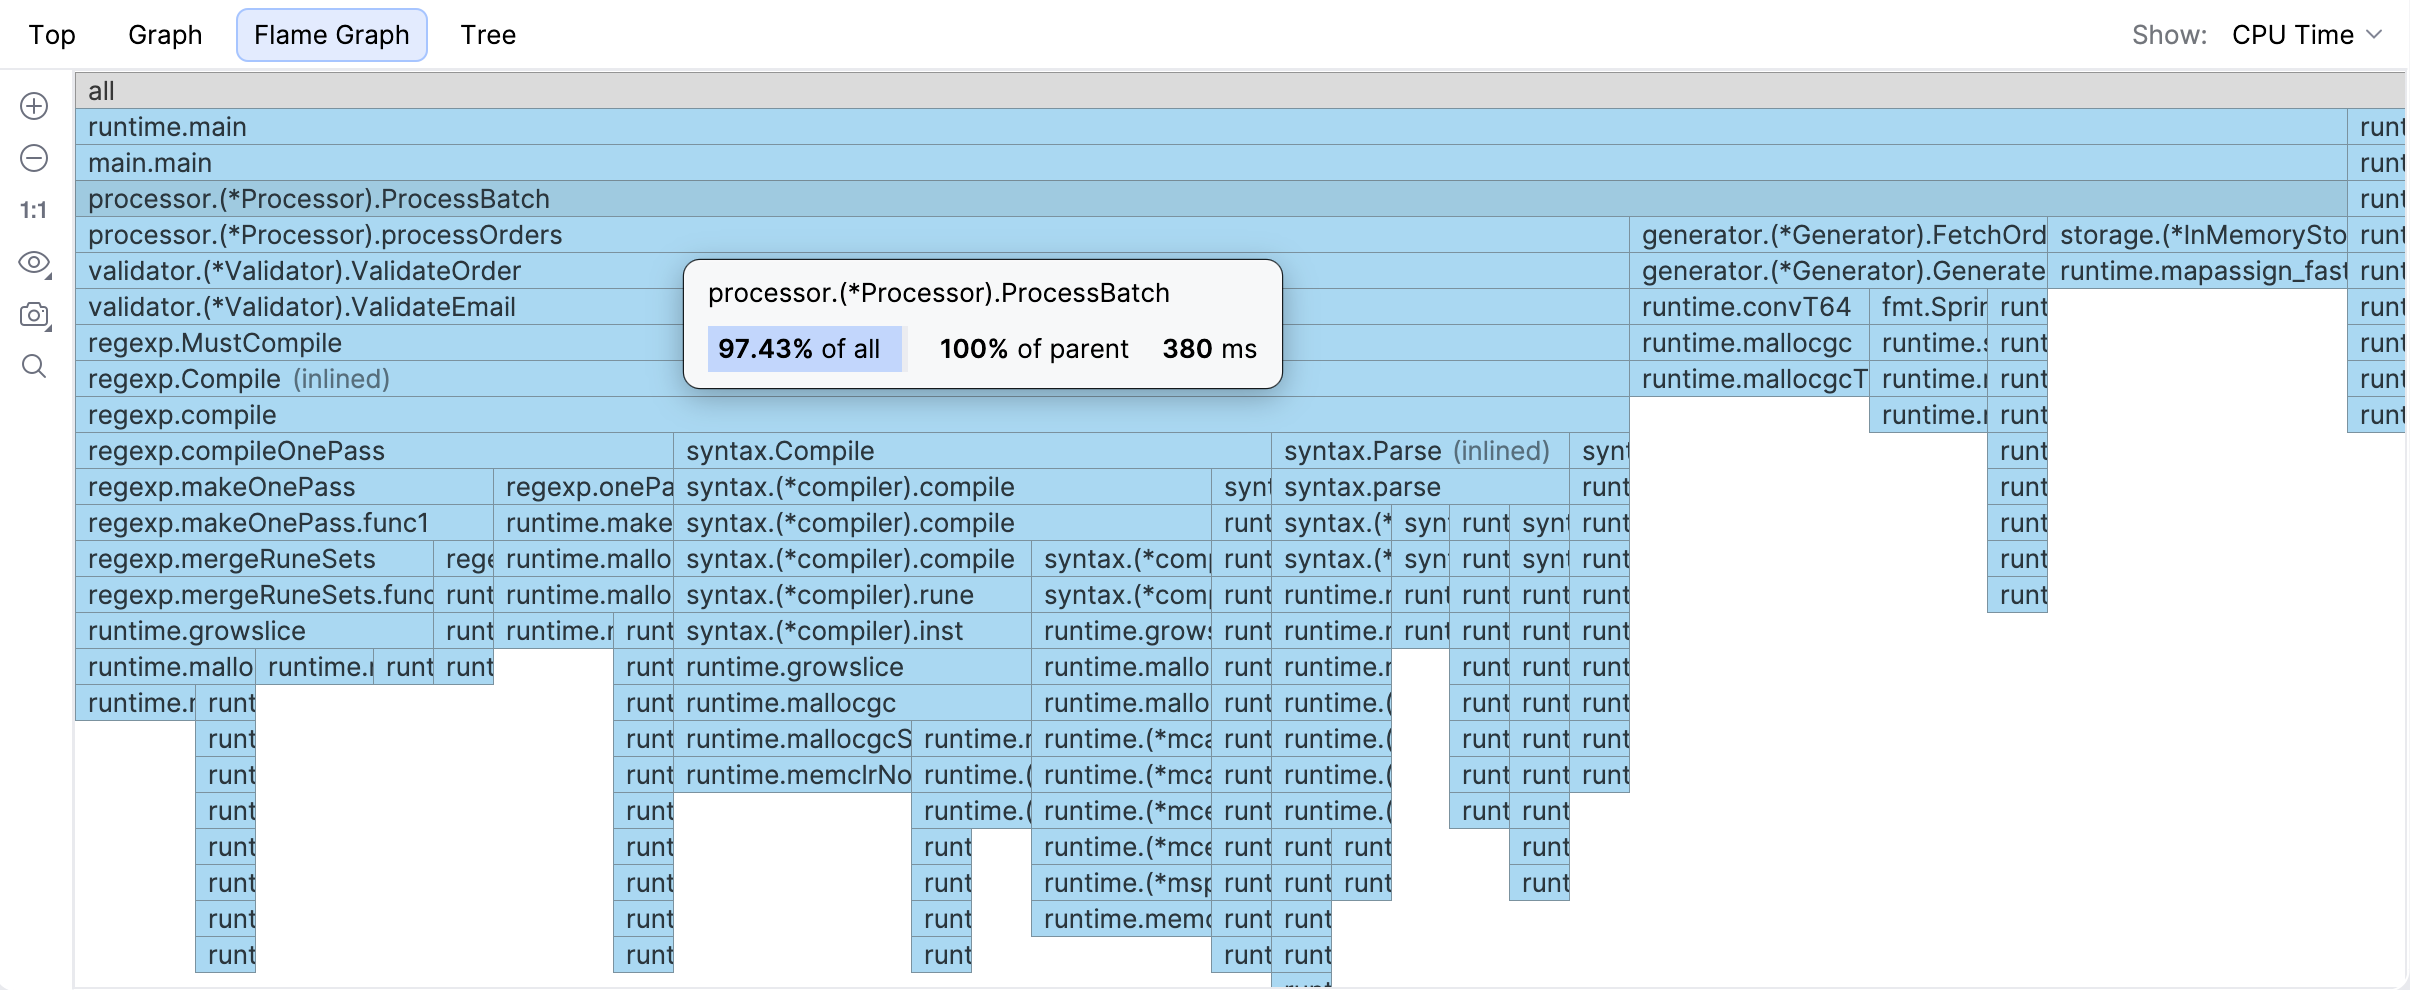
Hover over a block to see details.
Capture the graph
Click the Capture Image icon (
 ) in the toolbar.
Select one of the options:
Copy to Clipboard: copies the graph as an image.
Save: saves the graph as a PNG file.
Tree
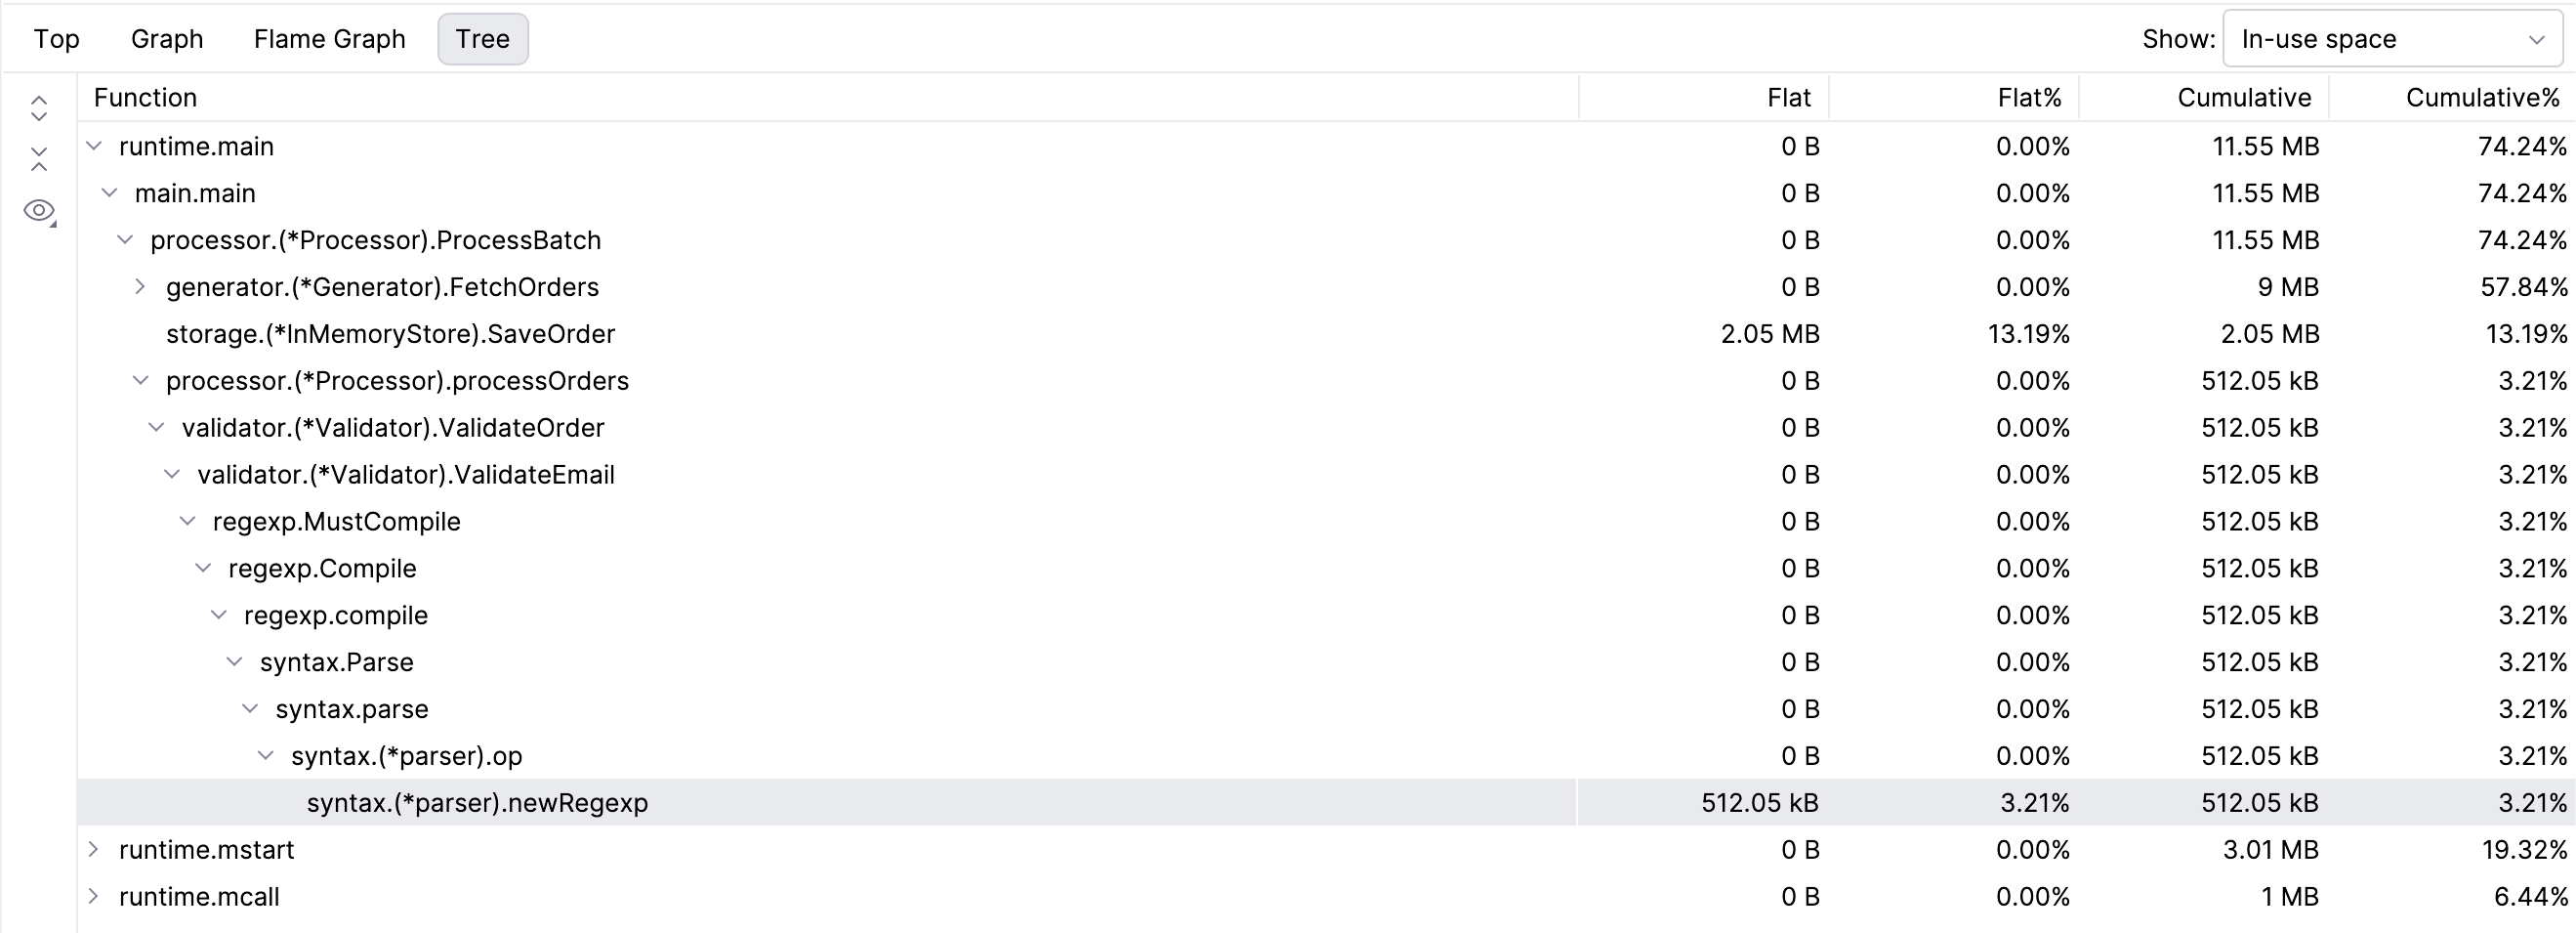
The tree view shows function calls as a hierarchy. Each row represents a function. Child rows show functions that were called by the parent.
This view helps you understand call paths and find functions that use the most CPU or memory, wait the longest, or appear in the most samples or goroutine stacks.
Configure view settings
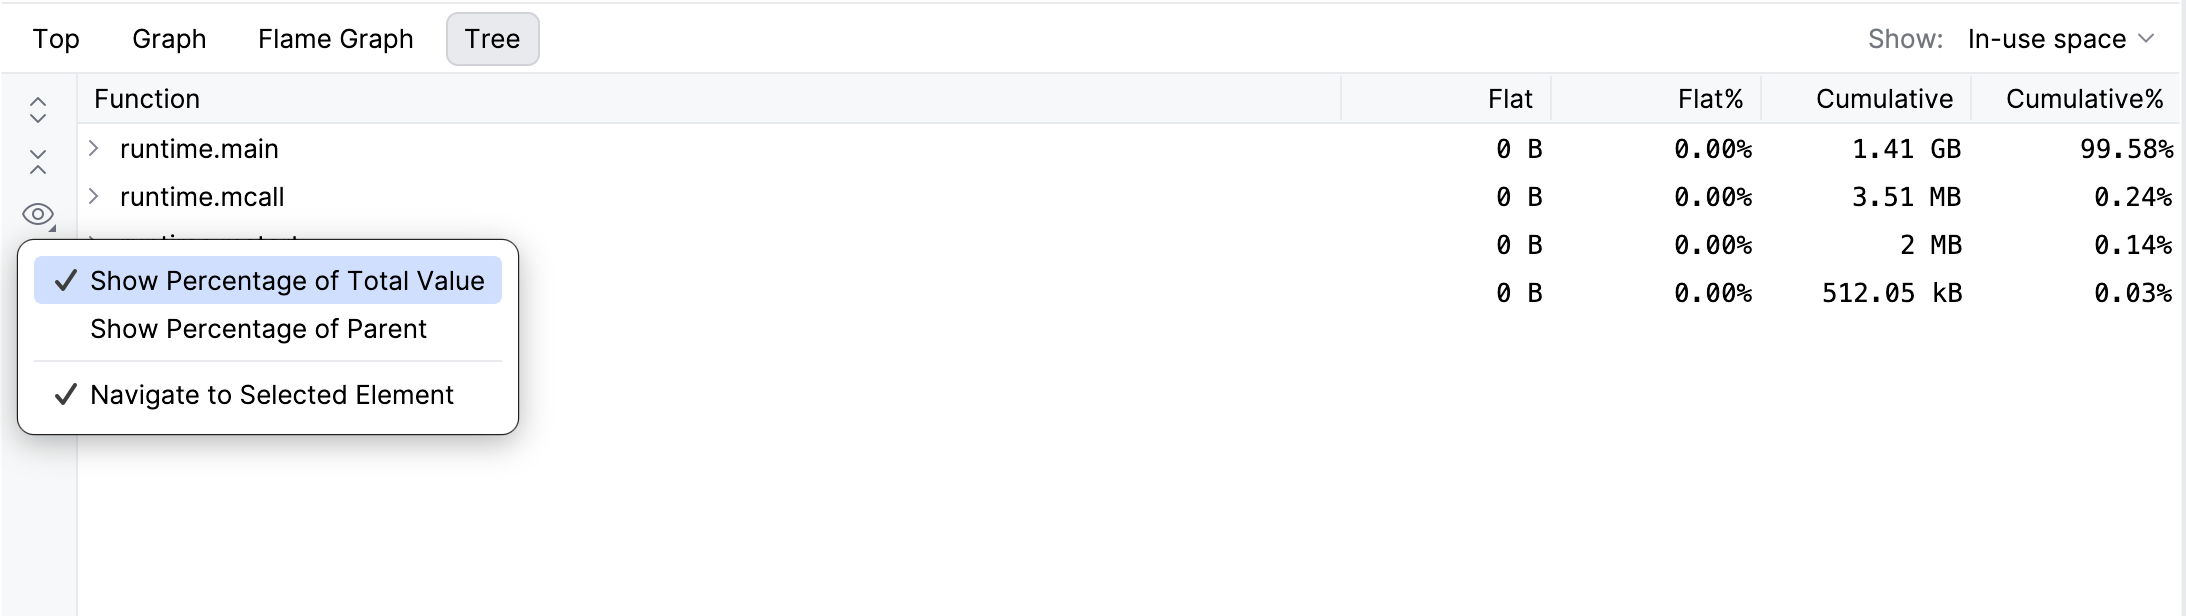
Open the view settings menu in the toolbar.
Enable or disable the following options:
Show Percentage of Total Value: shows the sum of all sample values.
Show Percentage of Parent: shows the share relative to the parent function.
Navigate with Single Click: opens code on a single click.
Navigate the tree
Expand or collapse nodes to explore call paths.
Select a function to view its metrics.
Interpret metrics
Use the columns to analyze resource usage:
Flat – CPU time, memory, delay, or a count from the function itself.
Flat% – the percentage of total CPU time, memory, delay, or count from the function itself.
Cumulative – total CPU time, memory, delay, or count from the function and all its callees.
Cumulative% – the percentage of total CPU time, memory, delay, or count from the function and its callees.
Search in the tree
Type a function name to highlight matching blocks.
Navigate the snapshot
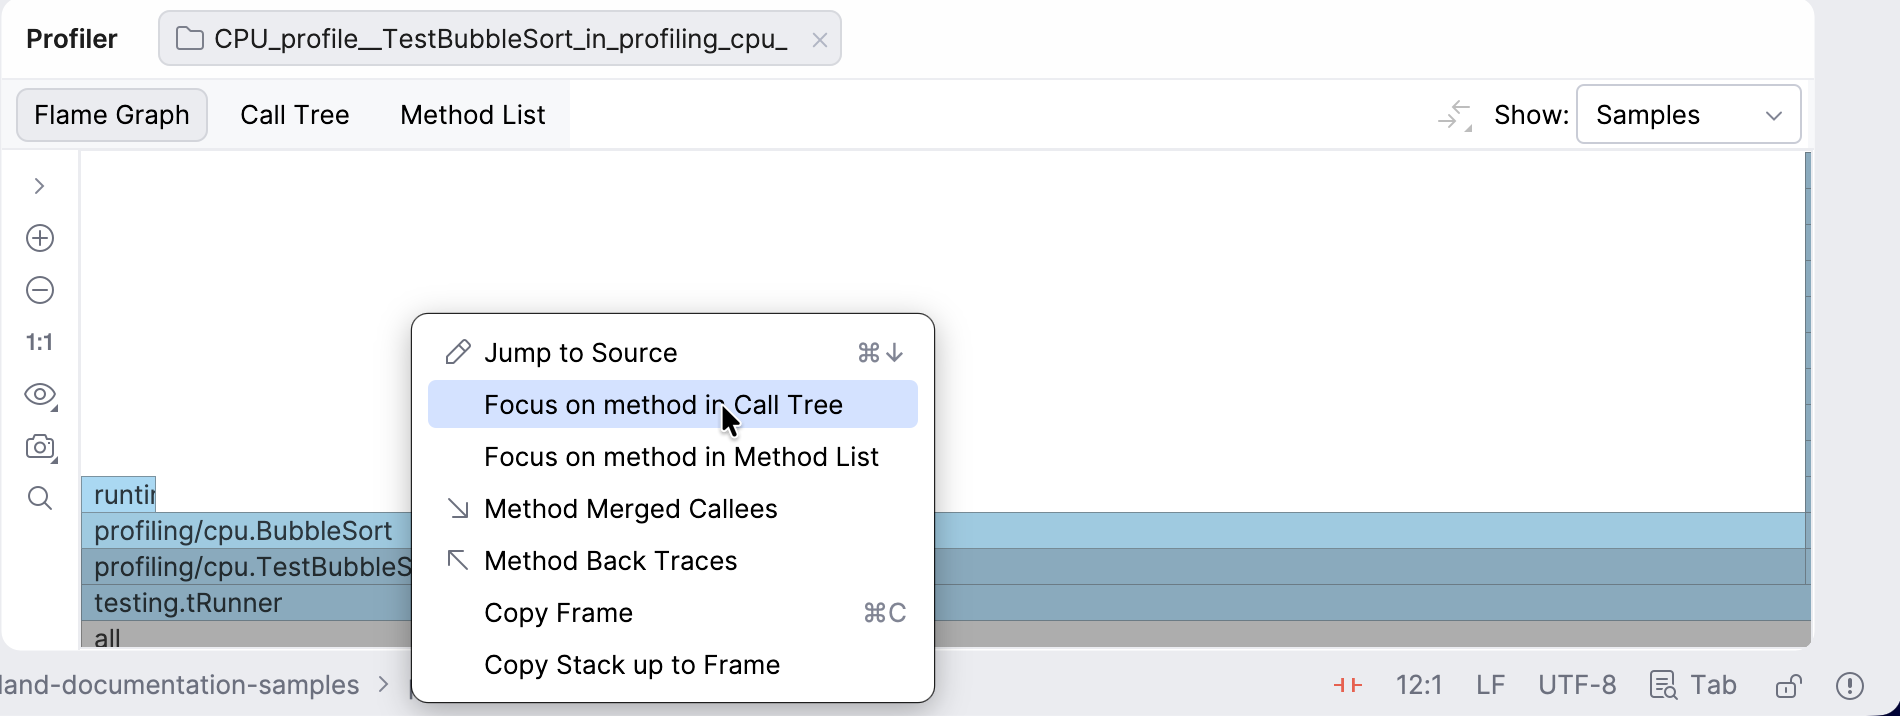
You can jump between the tabs while staying focused on a specific method. Right-click the necessary method and select another view in which you want to open it.
Line profiler
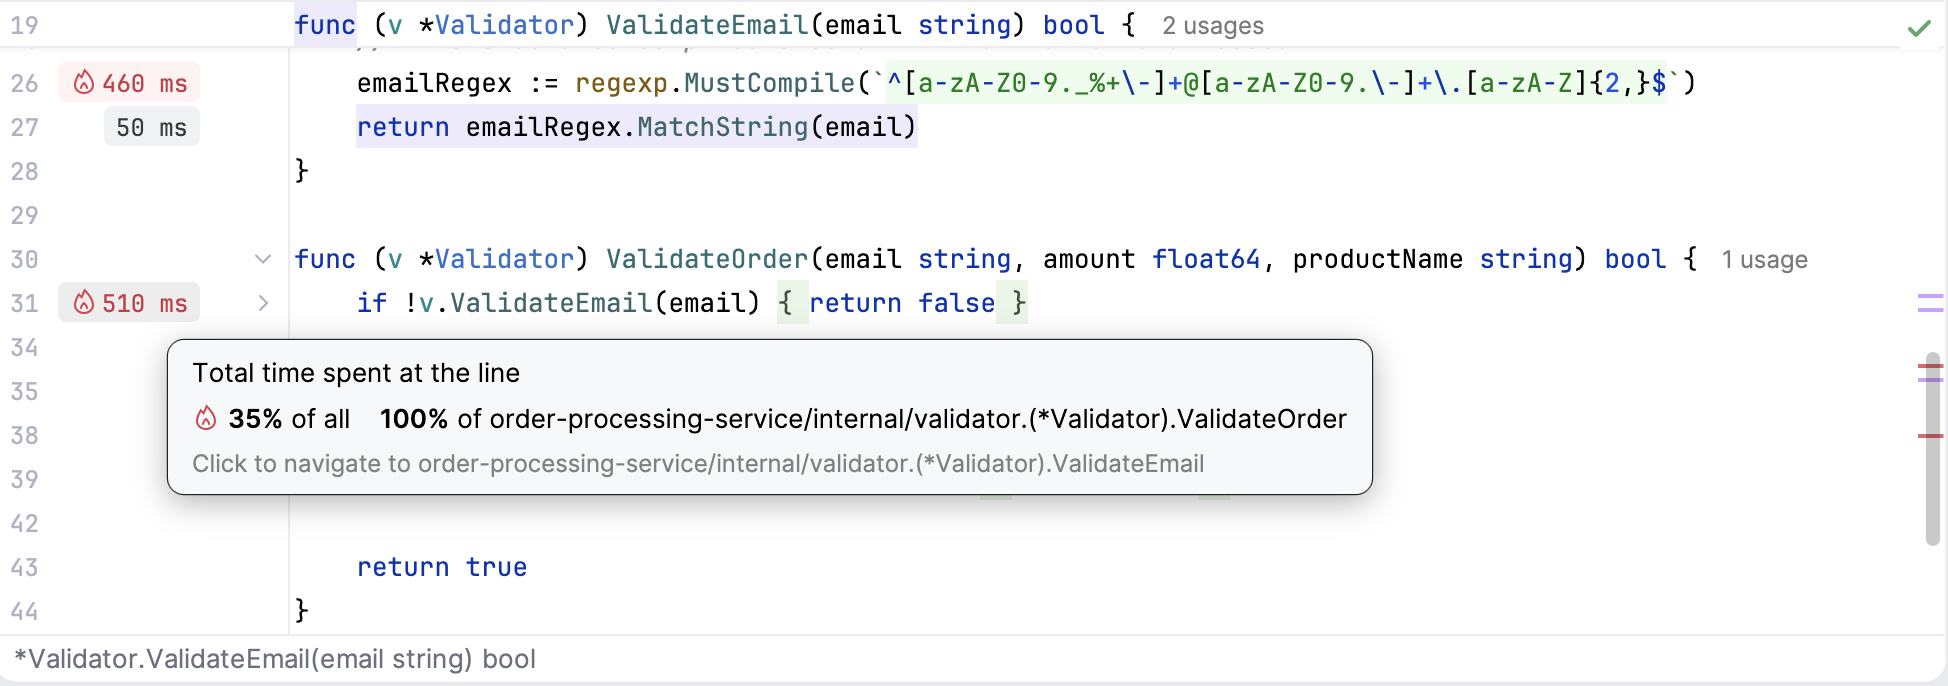
When you open a pprof-compatible profile, GoLand shows the Go Optimization tool window and adds runtime hints near the corresponding lines in the editor.
For an imported profile, GoLand uses the current source as a baseline. It displays a warning when it cannot verify that the profile and source lines match.
Lines with significant values get gray labels, while those with the highest values are marked with red labels with the fire icon.
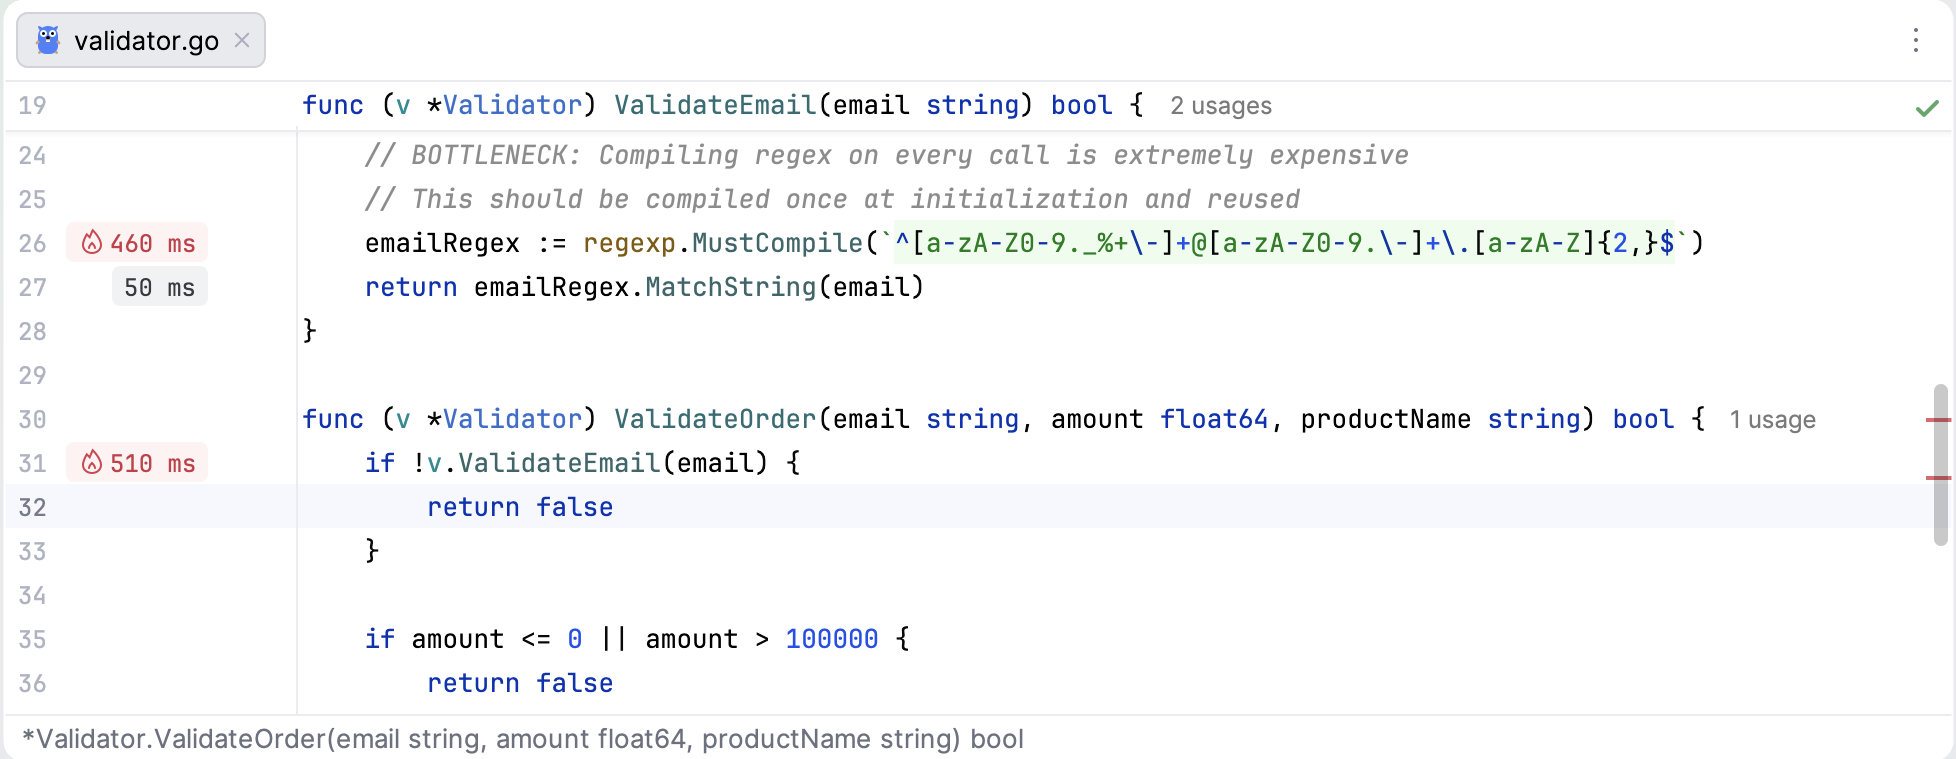
Switching the sample type in the Go Optimization tool window also changes the labels in the editor. The labels show the value for the selected sample type, such as CPU time, allocated memory, delay, or a count.
To inspect a labeled function, click its hint. The IDE opens the declaration, where you can inspect the lines that contribute to the selected value.