Escape analysis
Escape analysis is a compiler optimization that decides whether a value uses stack or heap memory. Heap allocations can increase memory use and add work for the garbage collector.
GoLand runs go build with -gcflags=-m=2 and -json=0,<path>. It reads the compiler diagnostics and shows them in the editor and the Go Optimization tool window. You can inspect messages and the flow that caused a value to escape.
Why values escape to the heap
The compiler uses stack memory for values whose lifetime it can determine. It uses heap memory for values whose lifetime it cannot determine. A value escapes to the heap when the compiler cannot prove that it is no longer needed after the current function returns. The garbage collector manages heap memory.
Escape decisions can change depending on how the code is structured, the Go version, the target platform, and other optimization decisions such as inlining. A handful of patterns account for most escapes:
Escapes can be transitive. If a value that contains a reference escapes, the value it references can also escape because it must remain valid for as long as the reference is used.
Returning pointers
Returning a pointer to a local value is one of the most common causes of an escape. The value is created inside the function, but the caller holds a reference after the function returns. The value cannot remain in that function's stack frame.
This pattern is safe and idiomatic in Go. Returning pointers is often the right choice for API clarity, regardless of whether the value escapes.
Closures and goroutines
A variable captured by a closure or a goroutine escapes when the closure or goroutine may outlive the function that created it. The compiler has to assume the captured value is still reachable, so it allocates it on the heap.
Interfaces and dynamic values
Passing a concrete value through an interface can contribute to a heap allocation. This often happens in formatting, logging, and interface-based APIs, where the compiler passes a value as an interface{} (any).
Passing a value through an interface does not always cause a heap allocation. Treat interface boundaries as something to check in the escape analysis output rather than avoid outright.
Slices, maps, and structs
A value can escape when it is stored in a data structure that outlives the current function. If a pointer is stored in a map, a slice, or a struct field, and that container lives longer than the function, the value it points to must remain valid for just as long.
Values with a runtime-determined size
A value can escape when the compiler cannot determine its size at compile time. For example, the backing array of a slice can escape when its size comes from a variable.
Not every escape is a problem. Programs of any complexity will have values that need to live on the heap, and escape analysis is most useful for investigating allocations on hot paths, not for eliminating every heap allocation.
Run escape analysis
You can run escape analysis for a file or for a package.
Run escape analysis for a file or package
Select from the main menu.
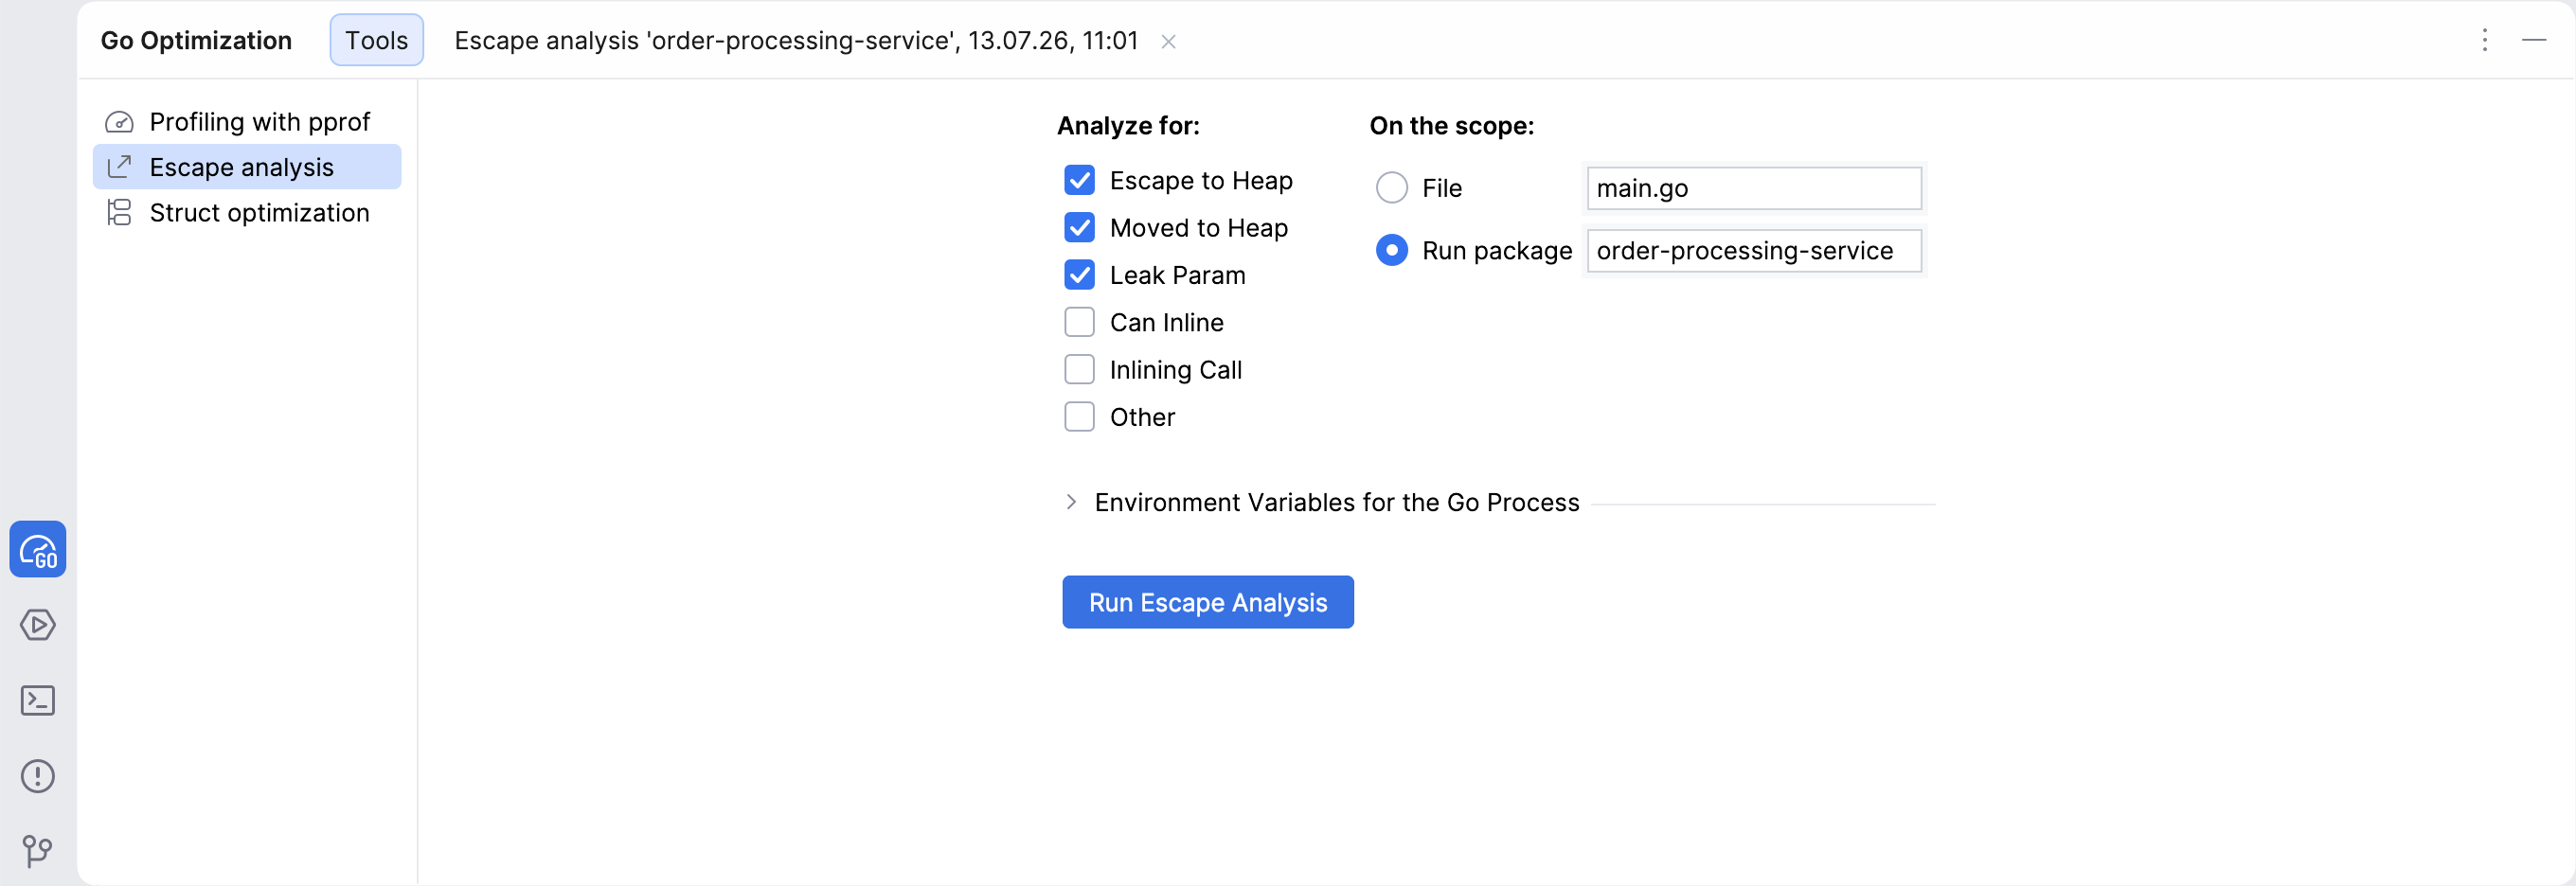
In the Go Optimization tool window, select Escape analysis.
Select the scope:
File: analyze the selected file.
Run package: analyze the selected package.
Select the escape analysis messages that you want to show.
(Optional) specify environment variables for the Go process.
For example, set
GOFLAGSto pass additional compiler flags, such as-Nto disable compiler optimizations or-lto disable function inlining. TheGOARCHandGOOSvariables can also affect the output, because some compiler decisions, such as inlining and allocation, are target-dependent.Click Run Escape Analysis.
View results in the editor
After the analysis finishes, GoLand shows escape analysis messages in the editor gutter.
If several messages belong to the same line, the gutter marker shows the number of logs for this line, for example, 2 logs.
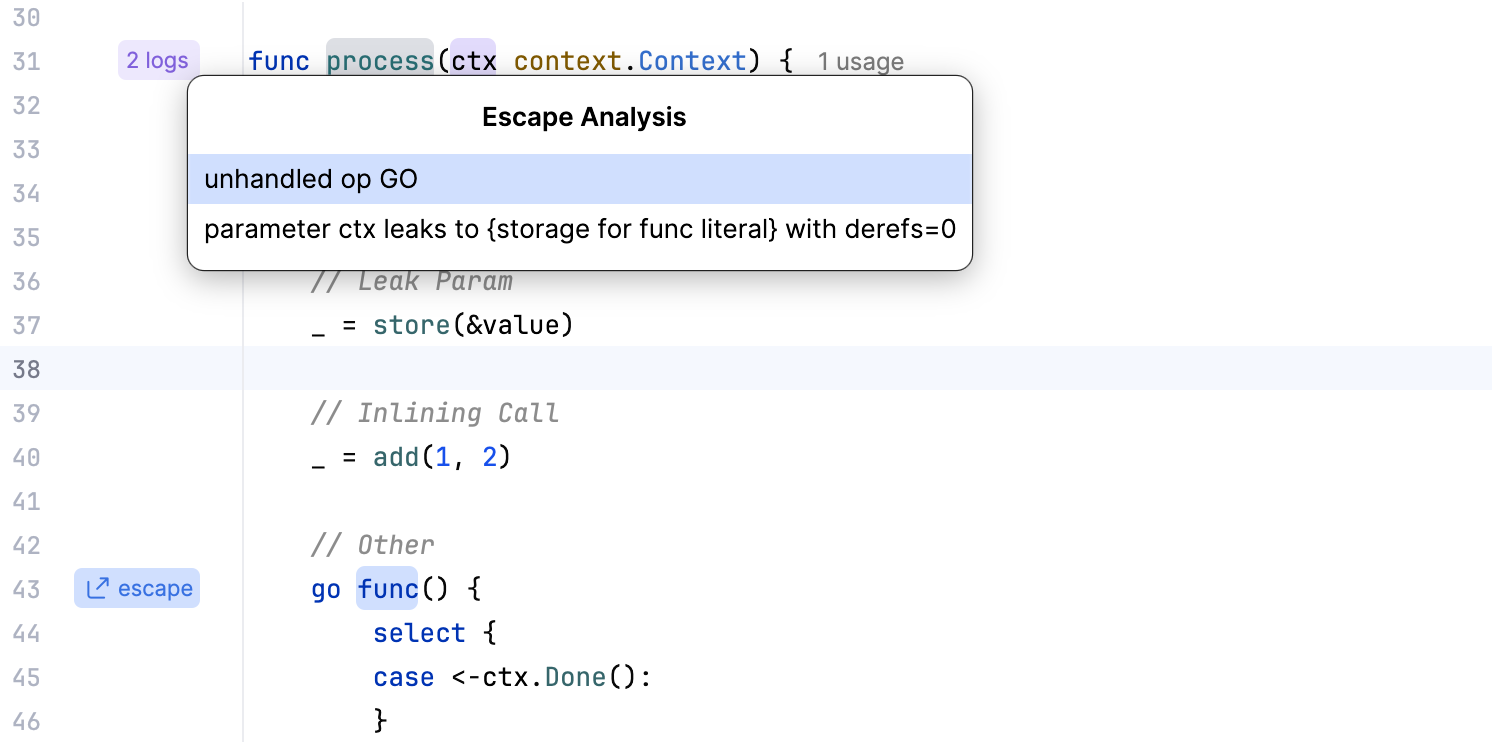
Inspect a gutter message
Hover over a gutter marker.
In the popup, review the compiler message and the escape flow.
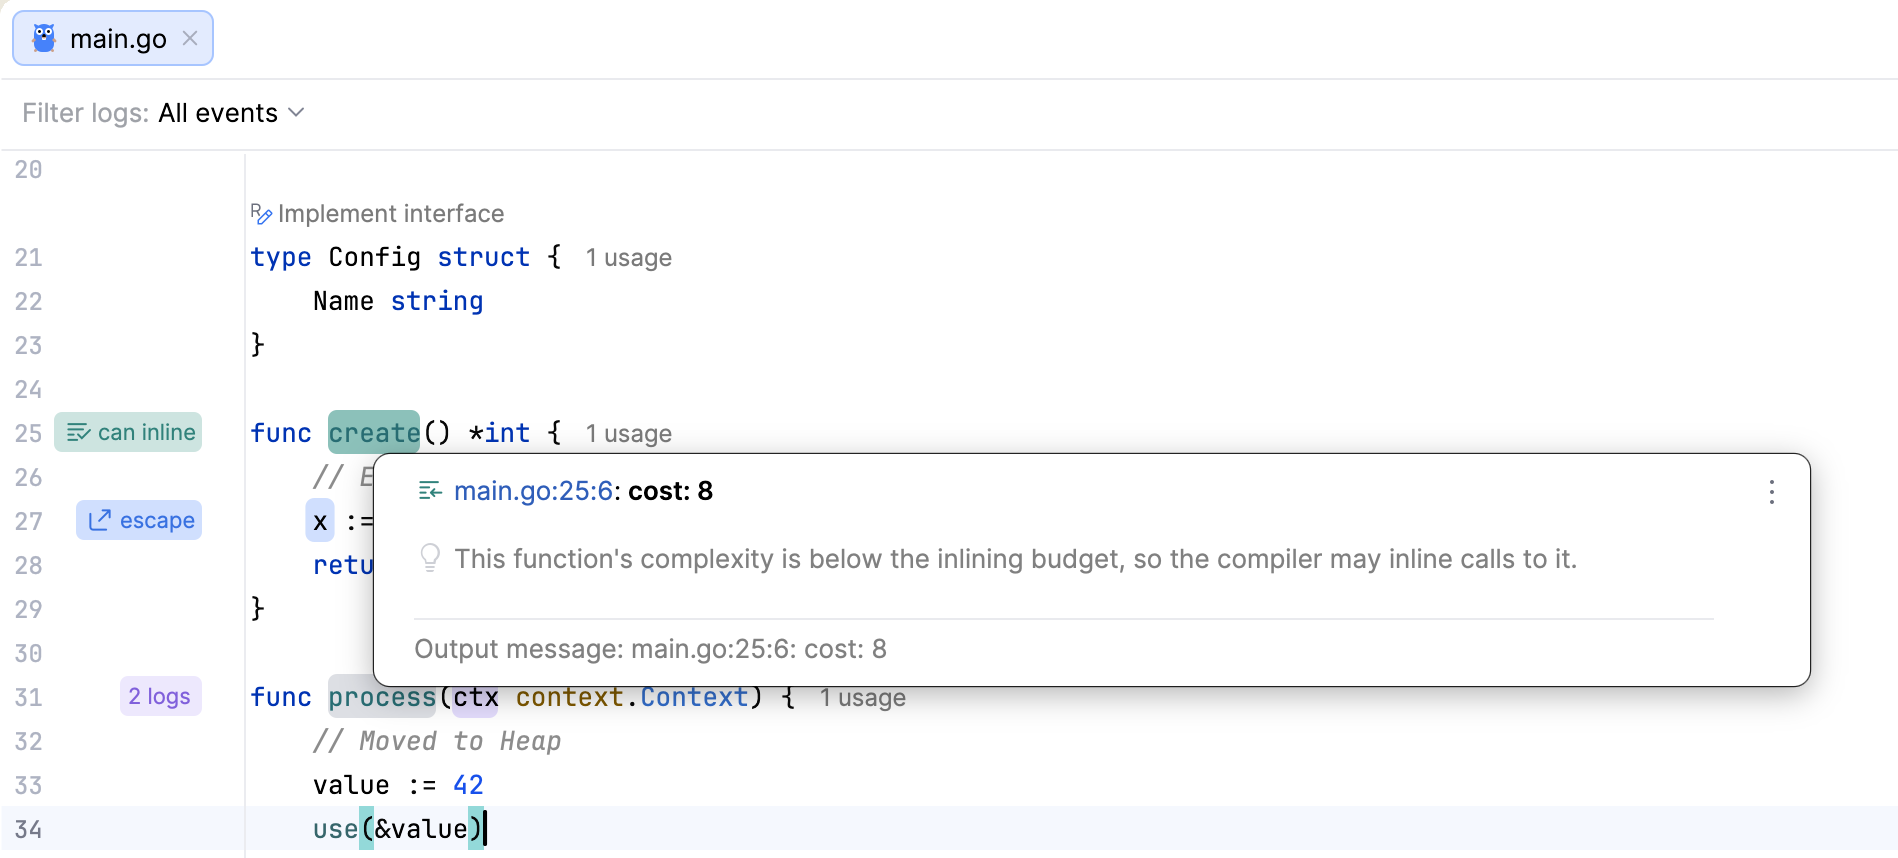
You can also hover over a function name to see escape analysis results for this function.
Navigate from results to code
GoLand also shows escape analysis results in the Go Optimization tool window.
Double-click a result, or select it and press Enter, to open the corresponding line in the editor.
Navigate to a result in code
Select from the main menu.
In the Go Optimization tool window, select events that you want to catch and click Run Escape Analysis.
On the results tab, expand a file, function, or message category.
Double-click a result, or select it and press Enter.
GoLand moves the caret to the corresponding line in the editor.
Filter and group results
You can filter escape analysis messages in the editor and in the tool window.
Filter escape analysis messages
After running the escape analysis, on the results tab, click Filter logs.
Select the message types that you want to display.
Change the results view
Click View.
Select one of the views:
Tree: the default view for parsed results. It groups results by files, functions, and message types.
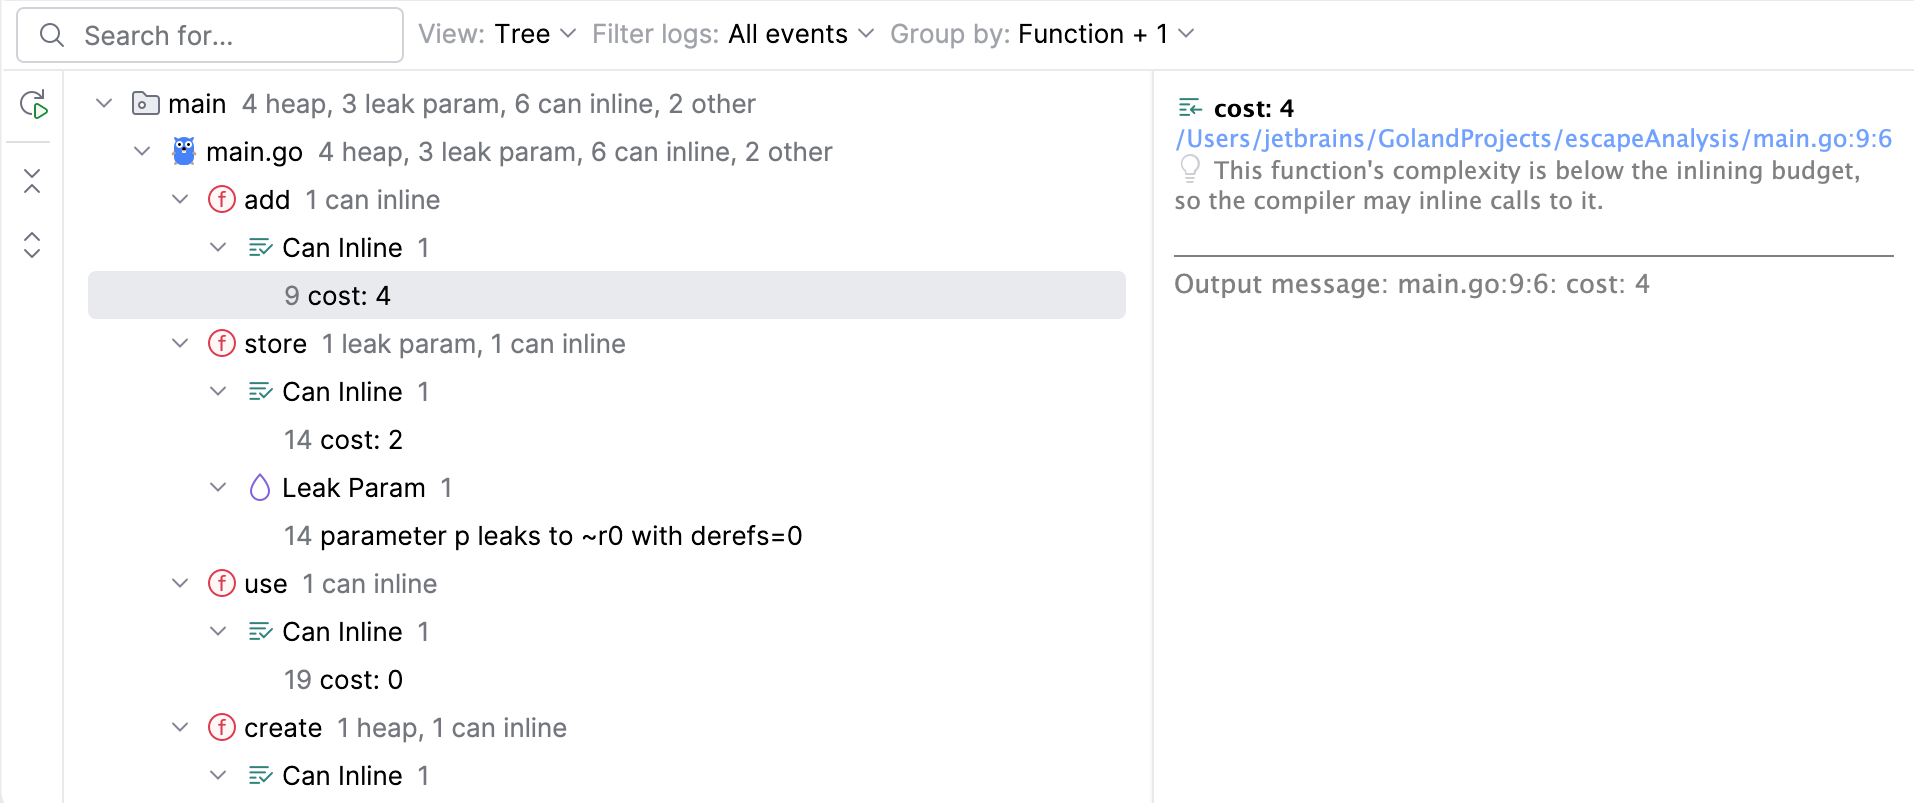
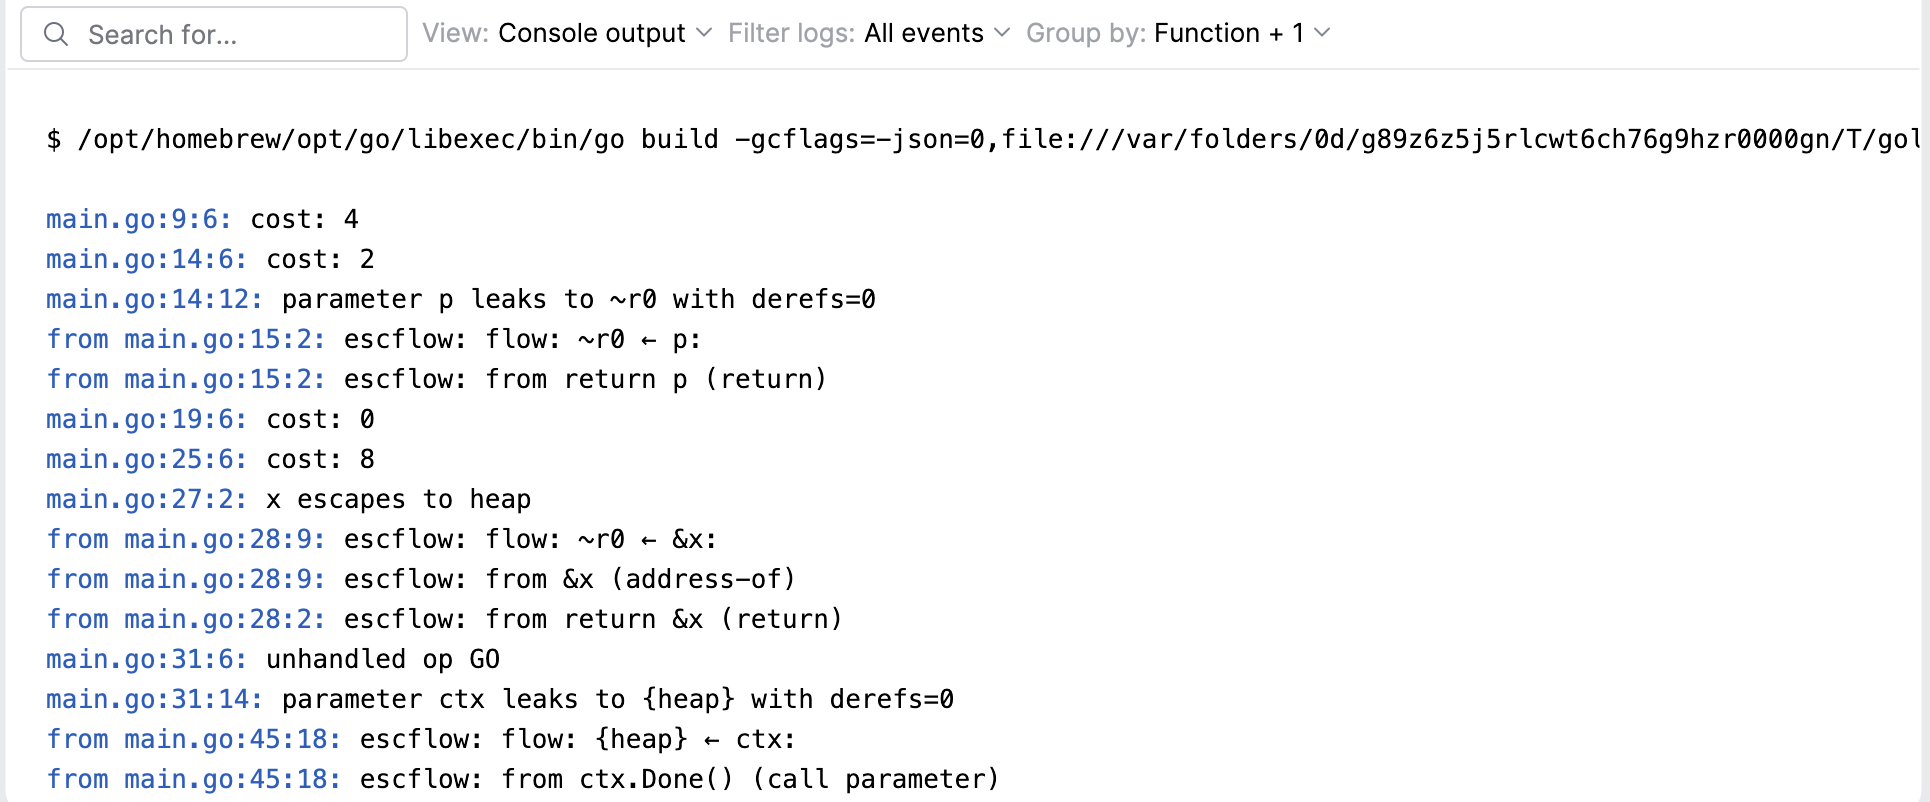
Console output: shows raw compiler output from the analysis run. You can navigate to the corresponding line from a result in this view.
Group results
Click Group by.
Select how GoLand groups the results, for example, by function or by category.
Compare escape analysis results
After you change your code, rerun escape analysis to check whether an allocation actually moved off the heap. Each run opens in its own tab in the Go Optimization tool window, so you can switch between the tabs to compare the results before and after the change.
Understand common escape analysis messages
Escape analysis determines whether values can be allocated on the stack or must be allocated on the heap.
Many heap allocations are required and are not performance problems. Use escape analysis together with benchmarks and profiling results to find allocations that affect performance-critical code.
Message type | Description |
|---|---|
Escape to Heap | Indicates that a value must be allocated on the heap because it is still needed after the current function returns.
func create() *int {
x := 10
return &x
}
In this example, the function returns the address of |
Moved to Heap | Indicates that the compiler allocated a value on the heap because it could not guarantee that the value would no longer be needed after the current function returns.
func process() {
value := 42
use(&value)
}
In this example, the address of |
Leak Param | Indicates that a function parameter escapes the current function and may need to remain valid after the function returns.
func store(p *int) *int {
return p
}
In this example, the function returns the parameter |
Can Inline | Indicates that the function is small and simple enough for the compiler to replace the function call with the function body during compilation.
func add(a, b int) int {
return a + b
}
In this example, the function contains a simple operation and has a small body. The compiler can inline the function to reduce function call overhead and improve optimization opportunities. |
Inlining Call | Indicates that the compiler replaced a function call with the function body during compilation.
func add(a, b int) int {
return a + b
}
func main() {
_ = add(1, 2)
}
In this example, the compiler replaces the call to Can Inline indicates that a function is eligible for inlining. Inlining Call indicates that the compiler actually inlined a specific function call. |
Other | Displays additional compiler diagnostics related to escape analysis and optimization decisions. |