Code inspections
In GoLand, there is a set of code inspections that detect and correct abnormal code in your project before you compile it. The IDE can find and highlight various problems, locate dead code, find probable bugs, spelling problems, and improve the overall code structure.
Inspections can scan your code in all project files or only in specific scopes (for example, only in production code or in modified files).
Every inspection has a severity level — the extent to which a problem can affect your code. Severities are highlighted differently in the editor so that you can quickly distinguish between critical problems and less important things. GoLand comes with a set of predefined severity levels and enables you to create your own.
Inspections and their settings are grouped in profiles. Each profile contains the information on the enabled inspections, a scope of files that they analyze, and their severity levels.
Access all available inspections and their settings
In the Settings dialog (Ctrl+Alt+S) , go to .
You can also press Ctrl+Alt+Shift+H and select Configure Inspections in the popup that opens.

Use to filter the inspection list. For example, you can filter inspections by severity or by language.
Data flow analysis
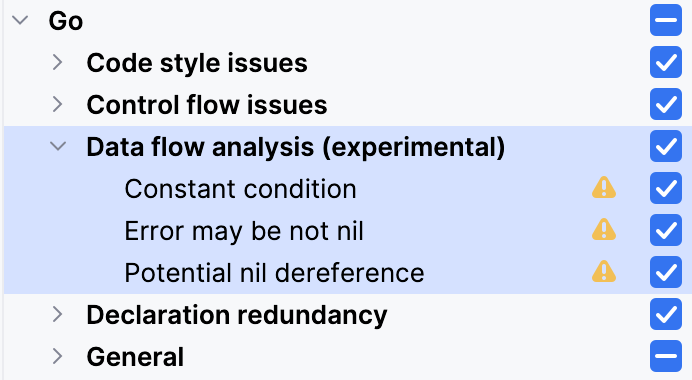
Data flow analysis (DFA) is a method used in programming to understand how data moves through a program. Imagine your program as a map with different points, where each point is a part of your code (like a statement or instruction). These points are connected by lines that show the path the program takes as it runs. In GoLand, Data flow analysis looks at this map to analyze your code.
Data Flow Analysis (DFA) inspections offer advanced features compared to regular code inspections. The key enhancements include:
Code Reachability: DFA inspections can track and identify unreachable code segments, helping developers streamline their codebase.
Condition Evaluation: They are capable of detecting unexecutable conditions within the code, ensuring more robust and error-free program execution.
Variable Data Tracking: DFA inspections understand the potential data each variable might receive, which aids in preventing data-related errors.
From a user perspective, the primary difference lies in the settings interface. DFA inspections are grouped under a separate subcategory within the settings. Apart from this, they operate similarly to other types of code inspections, maintaining a familiar user experience.

Code inspections with Qodana
Install the Qodana plugin
This functionality relies on the Qodana plugin, which you need to install and enable.
Press Ctrl+Alt+S to open settings and then select .
Open the Marketplace tab, find the Qodana plugin, and click Install (restart the IDE if prompted).
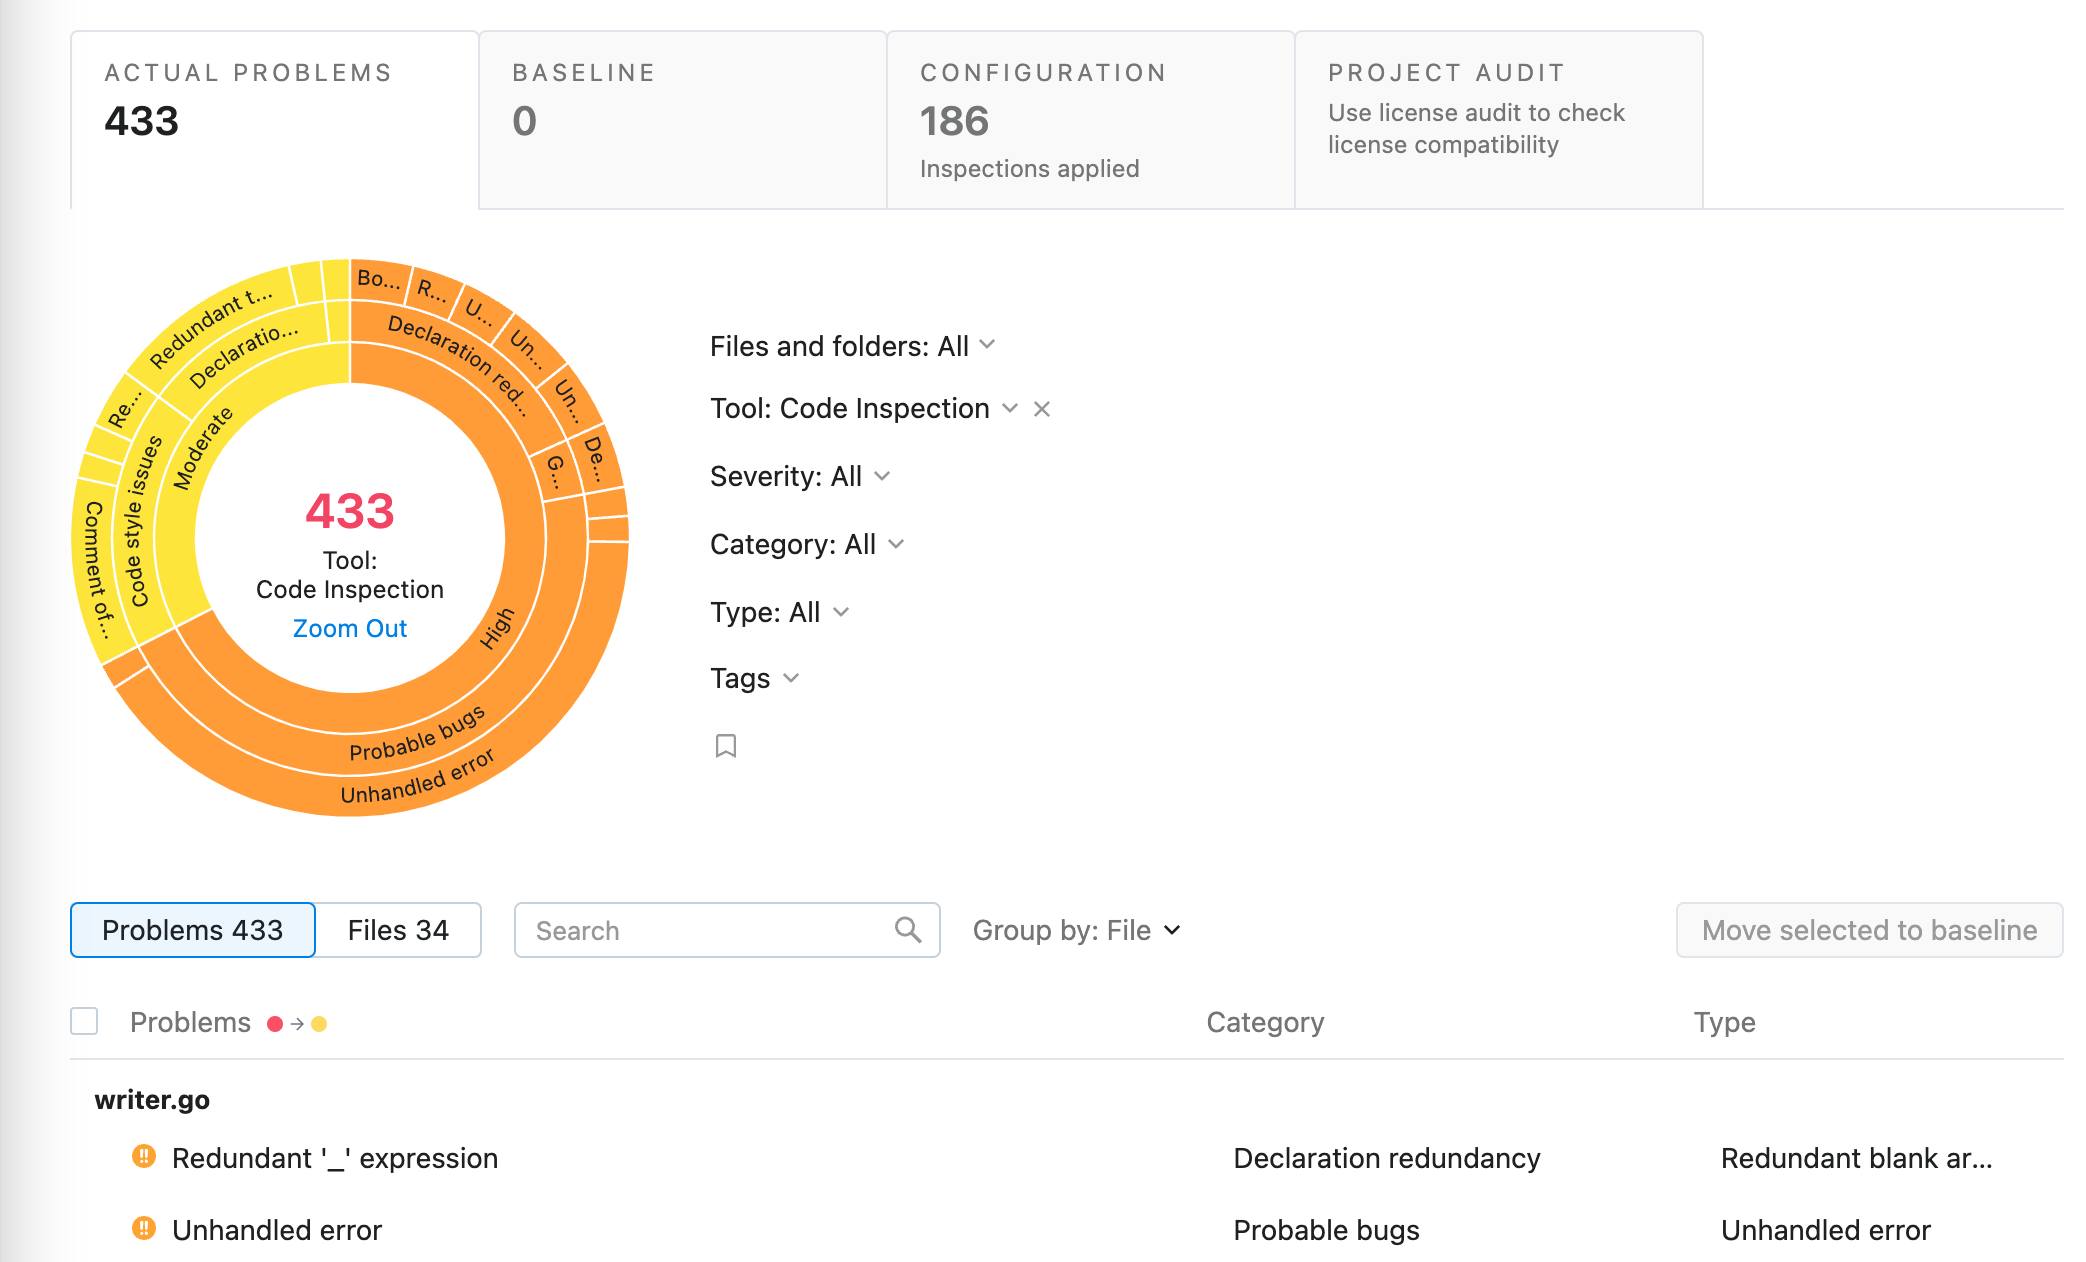
On top of running code inspections in your IDE, you can inspect your code using Qodana:
Run GoLand inspections locally, including your IDE, and as a part of CI/CD pipelines.
Run resource-consuming inspections using your CI/CD infrastructure.
Enforce quality standards with quality gates in your CI system.
Share the same inspection profile, both within the IDE and the CI tool.
Access inspections that are available only in Qodana, such as security checks and license audits.
Access historical overviews of inspection results.
You can compare inspection results between commits to better understand your progress.
For more information, refer to Qodana.
