High CPU usage
If you can continue working with the IDE, but the IDE hangs, repeatedly stops responding, displays you warnings about memory consumption, try to close large files (for example, SQL files with thousands of rows), and restart the IDE.
Otherwise, capture the CPU snapshot and IDE logs and send them to the JetBrains support team.
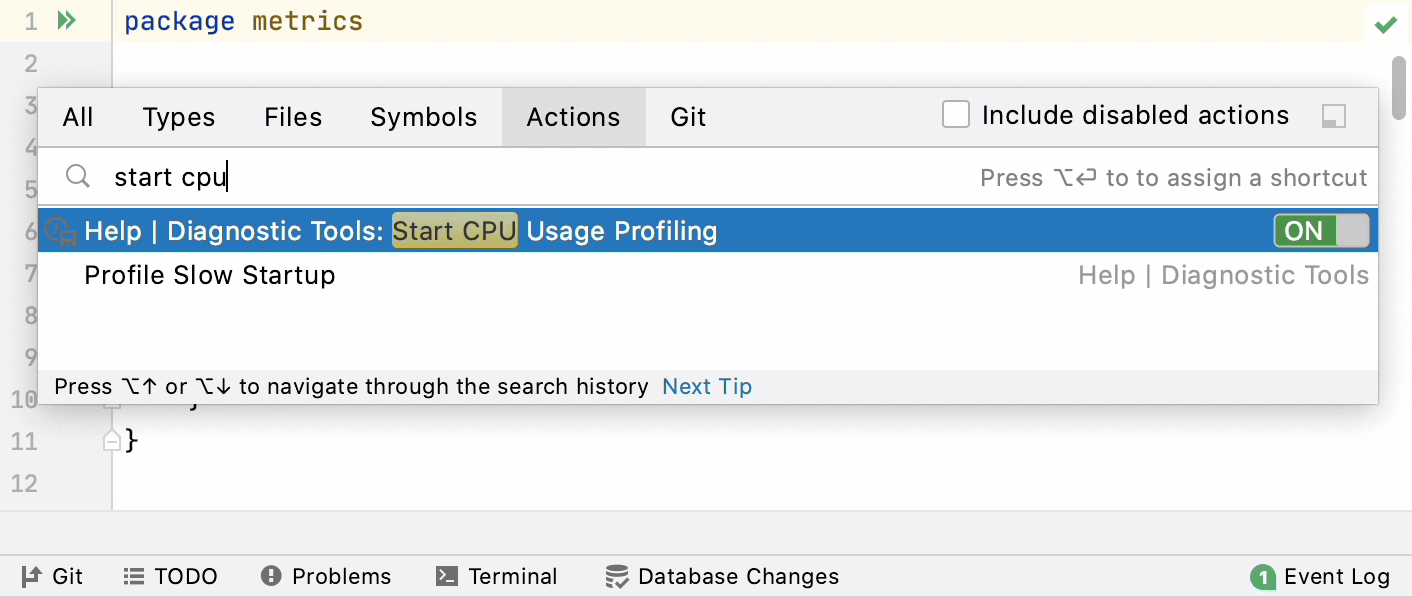
Start CPU usage profiling
Click .
GoLand might ask you to restart IDE to add necessary VM options. If you see this notification, restart the IDE and start the CPU usage profiling again.
Perform the actions that cause performance issues. Try to reproduce the performance problem several times while the snapshot is being recorded.
Click .
GoLand saves the snapshot file in the user home directory. If you do not see the notification, enable balloon notifications for Profiling in settings. Open settings by pressing Ctrl+Alt+S and navigate to . In the list of components, find profiler notifications and ensure that the Popup type is Balloon.