Jest
Jest is a testing platform for client-side JavaScript applications and React applications specifically. Learn more about the platform from the Jest official website.
You can run and debug tests with Jest right in GoLand. You can see the test results in a treeview and easily navigate to the test source from there. Test status is shown next to the test in the editor with an option to quickly run it or debug it.
Before you start
Download and install Node.js.
Make sure the JavaScript and TypeScript plugin is enabled in the settings. Press Ctrl+Alt+S to open settings and then select . Click the Installed tab. In the search field, type JavaScript and TypeScript. For more information about plugins, refer to Managing plugins.
Install and configure Jest
In your command-line shell or in the embedded Terminal (Alt+F12) , type:
npm install --save-dev jest
Learn more from Getting Started and Configuring Jest on the Jest official website.
Run tests
With GoLand, you can quickly run a single Jest test right from the editor or create a run/debug configuration to execute some or all of your tests.
For more information about creating Vitest tests for JavaScript and TypeScript code, refer to Vitest features on the Vitest official website.
Run a single test from the editor
Click
 or
or  in the gutter and select Run <test_name> from the list.
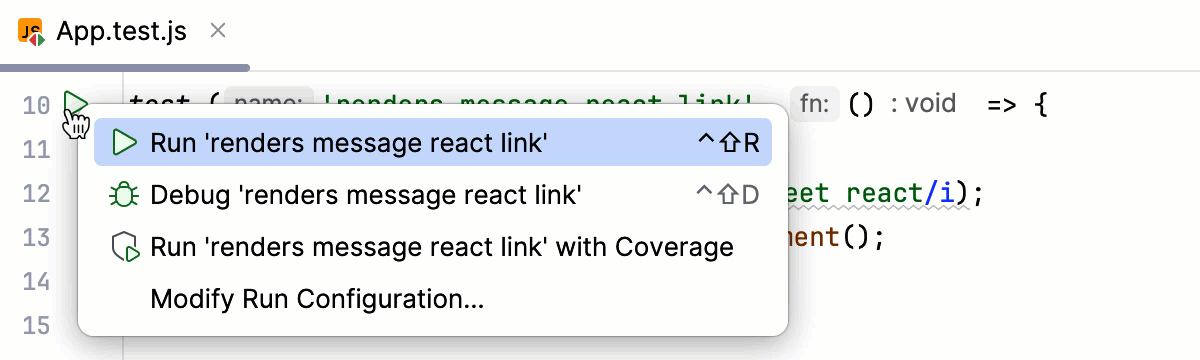
You can also see whether a test has passed or failed right in the editor, thanks to the test status icons
 and
and  in the gutter.
Run all tests in a folder from the Project tool window
In the Project tool window (Alt+1) , select the folder with the tests, and then select Run 'Tests in <folder name>'.

Create a Jest run configuration
Open the Run/Debug Configuration dialog ( in the main menu), click
 in the left-hand pane, and select Jest from the list. The Run/Debug Configuration: Jest dialog opens.
Specify the Node.js runtime to use.
If you choose the Project alias, GoLand will automatically use the project default interpreter from the Node runtime field . In most cases, GoLand detects the project default runtime and fills in the field itself.
You can also choose another configured local interpreter or click
 and configure a new one.
Specify the location of the jest, react-scripts, react-script-ts, react-super-scripts, or react-awesome-scripts package.
Specify the working directory of the application. By default, the Working directory field shows the project root folder. To change this predefined setting, specify the path to the desired folder.
Specify the tests to run. This can be a specific test or suite, an entire test file, or a folder with test files.
Optionally:
Specifyy the jest.config.js or jest.config.ts file to use: select the relevant file from the list, or click
and select it in the dialog that opens, or just type the path in the field.If the field is empty, GoLand looks for a package.json file with a
jestkey. The search is performed in the file system upwards from the working directory. If no appropriate package.json file is found, then a Jest default configuration is generated on the fly.Optionally:
Configure rerunning tests automatically on changes in the related source files. To do that, add the
--watchflag in the Jest options field.You can also turn the watch mode on later by pressing the Watch for Changes toggle button in the Run tool window during a test session, refer to Rerun test automatically on changes (watch mode) below.
Optionally:
Specify the environment variables for executing commands. GoLand will show these variables in completion lists for
process.env.
In the Node options field, optionally type the Node.js-specific command-line options to be passed to the Node.js executable file. The acceptable options are:
Use
--require coffeescript/registerto have CoffeeScript files compiled into JavaScript on the fly during run.This mode requires that the register.js file, which is a part of the
coffeescriptpackage, is located inside your project.Use
--inspector--inspect-brkparameter for Chrome Debugging Protocol support.To use ECMAScript Modules in your project, add the
—experimental-vm-modulesflag to the Node options field.
Run tests via a run configuration
Select the Jest run/debug configuration from the list of configurations and click
 in the list or on the toolbar.
Monitor test execution and analyze test results in the Test Runner tab of the Run tool window. For more information, refer to Explore test results.
Rerun failed tests
Click
 on the test results toolbar. GoLand will execute all the tests that failed during the previous session.
 To rerun a specific failed test, select on its context menu.
For more information, refer to Rerunning tests.
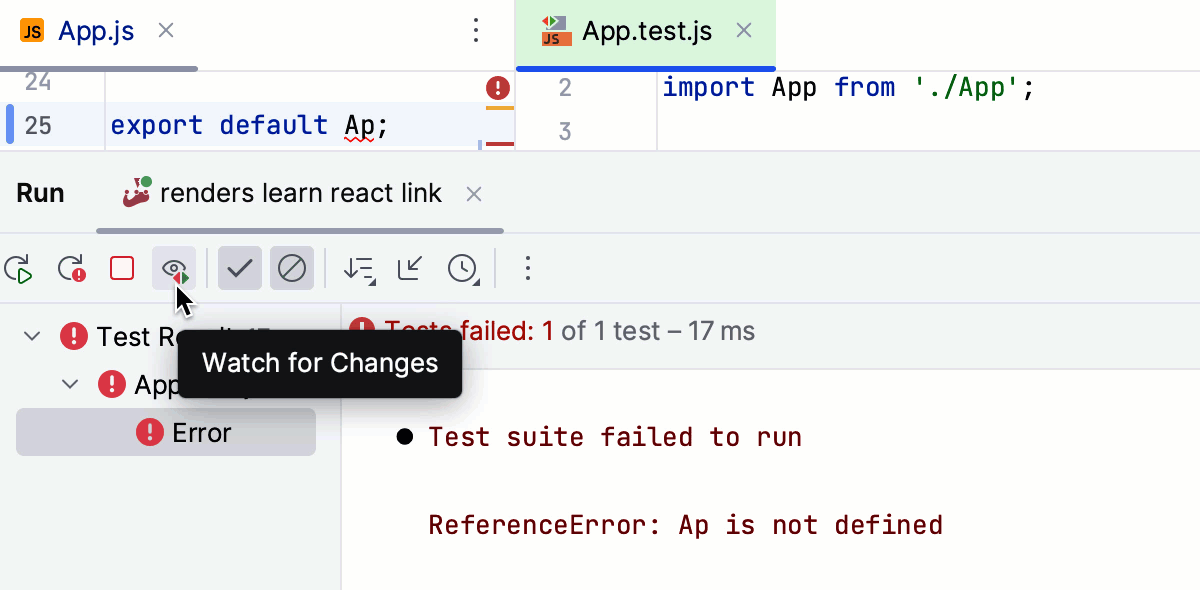
Rerun tests automatically on changes (watch mode)
GoLand supports the watch mode in which a test is rerun automatically as soon as any changes are made to the test-related source file. As a result, you can just make changes to your code without having to rerun tests manually or restart the Jest run/debug configuration.
In the Test Runner tab, press the Watch for Changes toggle button.
Alternatively, add the
--watchflag in the Jest options field of the run/debug configuration, refer to Create a Jest run configuration above.
Navigation
With GoLand, you can jump between a file and the related test file or from a test result in the Test Runner Tab to the test.
With GoLand, you can jump between a file and the related test file and between a test or suite definition and its result in the Test Runner Tab.
To jump between a test and its subject or vice versa, open the file in the editor and select or from the context menu, or just press Ctrl+Shift+T.
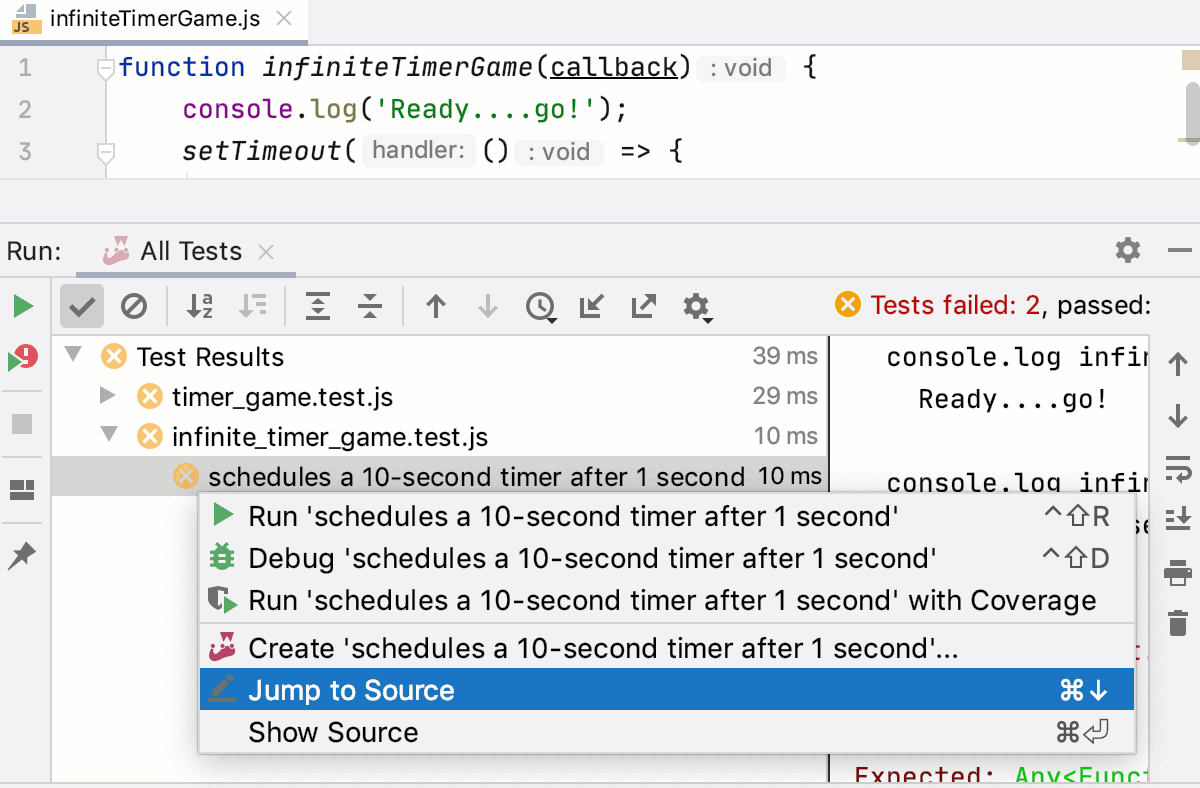
To jump from a test result to the test definition, click the test name in the Test Runner tab twice, or select from the context menu, or just press F4. The test file opens in the editor with the caret placed at the test definition.
To jump from a test or suite definition to its result in the Test Runner tab, click
or in the gutter and choose Select <test_name> in Test Tree from the list.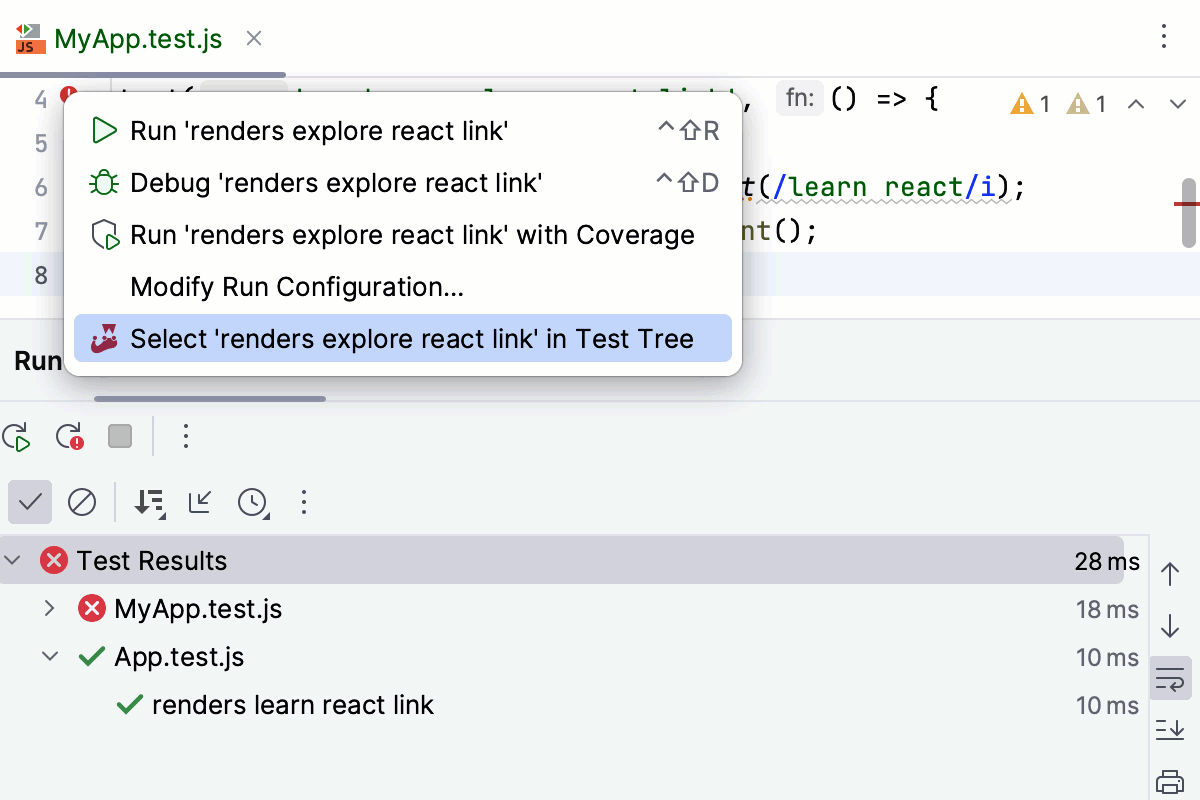
For failed tests, GoLand brings you to the failure line in the test from the stack trace. If the exact line is not in the stack trace, you will be taken to the test definition.
Snapshot testing
GoLand integration with Jest supports such a great feature as snapshot testing.
When you run a test with a .toMatchSnapshot() method, Jest creates a snapshot file in the __snapshots__ folder. To jump from a test to its related snapshot, click ![]() in the gutter next to the test or select the required snapshot from the context menu of the
in the gutter next to the test or select the required snapshot from the context menu of the .toMatchSnapshot() method.

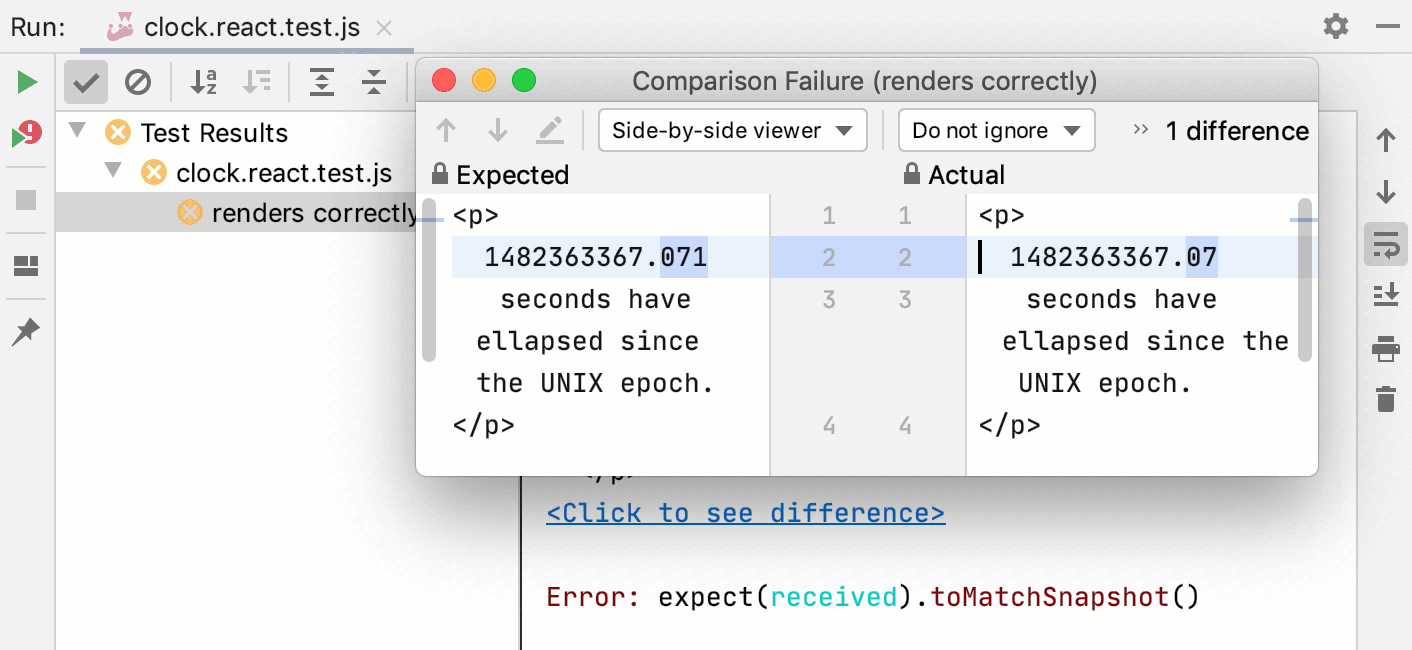
If a snapshot does not match the rendered application, the test fails. This indicates that either some changes in your code have caused this mismatch or the snapshot is outdated and needs to be updated.
To see what caused this mismatch, open the GoLand built-in Diff Viewer via the Click to see difference link in the right-hand pane of the Test Runner tab.
You can update outdated snapshots right from the Test Runner tab of the Run tool window.
To update the snapshot for a specific test, use the Click to update snapshot link next to the test name.
To update all outdated snapshots for the tests from a file, use the Click to update failed snapshots next to the test filename.

Debug tests
With GoLand, you can quickly start debugging a single Jest test right from the editor or create a run/debug configuration to debug some or all of your tests.
Set the breakpoints where necessary.
To start debugging a single test from the editor, click
or in the gutter and select Debug <test_name> from the list.To start debugging all tests in a folder, select the folder in the Project tool window, and then select Debug 'Tests in <folder name>' from the context menu.

To launch test debugging via a run/debug configuration, create a Jest run/debug configuration as described above.
Then select the Jest run/debug configuration from the list of configurations and click
 in the list or on the toolbar.
In the Debug tool window that opens, proceed as usual: step through the program, stop and resume program execution, examine it when suspended, explore the call stack and variables, set watches, evaluate variables, view actual HTML DOM, and so on.
To ignore source maps and step through the actually executed code, press ![]() on the toolbar of the Debug tool window.
on the toolbar of the Debug tool window.
Monitor code coverage
With GoLand, you can also monitor how much of your code is covered with Jest tests. GoLand displays this statistics in a dedicated Coverage tool window and marks covered and uncovered lines visually in the editor and in the Project tool window (Alt+1) .
Run tests with coverage
Create a Jest run/debug configuration as described above.
Select the Jest run/debug configuration from the list on the main toolbar and click
 to the right of the list.
Alternatively, quickly run a specific suite or a test with coverage from the editor: click
or in the gutter and select Run <test_name> with Coverage from the list.
Monitor the code coverage in the Coverage tool window. The report shows how many files were covered with tests and the percentage of covered lines in them. From the report you can jump to the file and see what lines were covered – marked green – and what lines were not covered – marked red.

Run Jest tests with Node.js inside a Docker container
With GoLand, you can run Jest tests inside a Docker container just in the same way as you do it locally.
Before you start
Install the Node.js and Node.js Remote Interpreter plugins on the Settings | Plugins page, tab Marketplace, as described in Installing plugins from JetBrains Marketplace.
Download, install, and configure Docker as described in Docker.
Configure a Node.js remote runtime in Docker or via Docker Compose and set it as default in your project. Also make sure the package manager associated with this remote runtime is set as project default.
Open your package.json and make sure Jest is listed in the
devDependenciessection:{ "name": "node-express", "version": "0.0.0", "private": true, "dependencies": { "cookie-parser": "~1.4.4", "debug": "~2.6.9", "express": "~4.16.1", "http-errors": "~1.6.3", "morgan": "~1.9.1", "pug": "^3.0.2" }, "devDependencies": { "eslint": "^8.1.0", "http-server": "^14.0.0", "jest": "^27.3.1" } }Right-click anywhere in the editor and select Run '<package manager> install' from the context menu.
Run tests
Create tests according to the instructions from the Jest official website.
Proceed as with local development: run and debug single tests right from the editor or create a run/debug configuration to launch some or all of your tests as described in Run tests and Debug tests above.