Database Output tool window
Enable the Database Tools and SQL plugin
This functionality relies on the Database Tools and SQL plugin, which is bundled and enabled in IntelliJ IDEA by default. If the relevant features are not available, make sure that you did not disable the plugin.
Press Ctrl+Alt+S to open settings and then select .
Find the Database Tools and SQL plugin and click Enable.
The Database Output tool window displays execution output, query results, and query execution plans. You can use it to switch between results from query consoles and SQL files, view the queries that produced them, and open result sets in separate editor tabs.
The tool window opens automatically when you run a query, a database run configuration, an SQL file, or generate a query execution plan. By default, it opens at the bottom of the IDE.
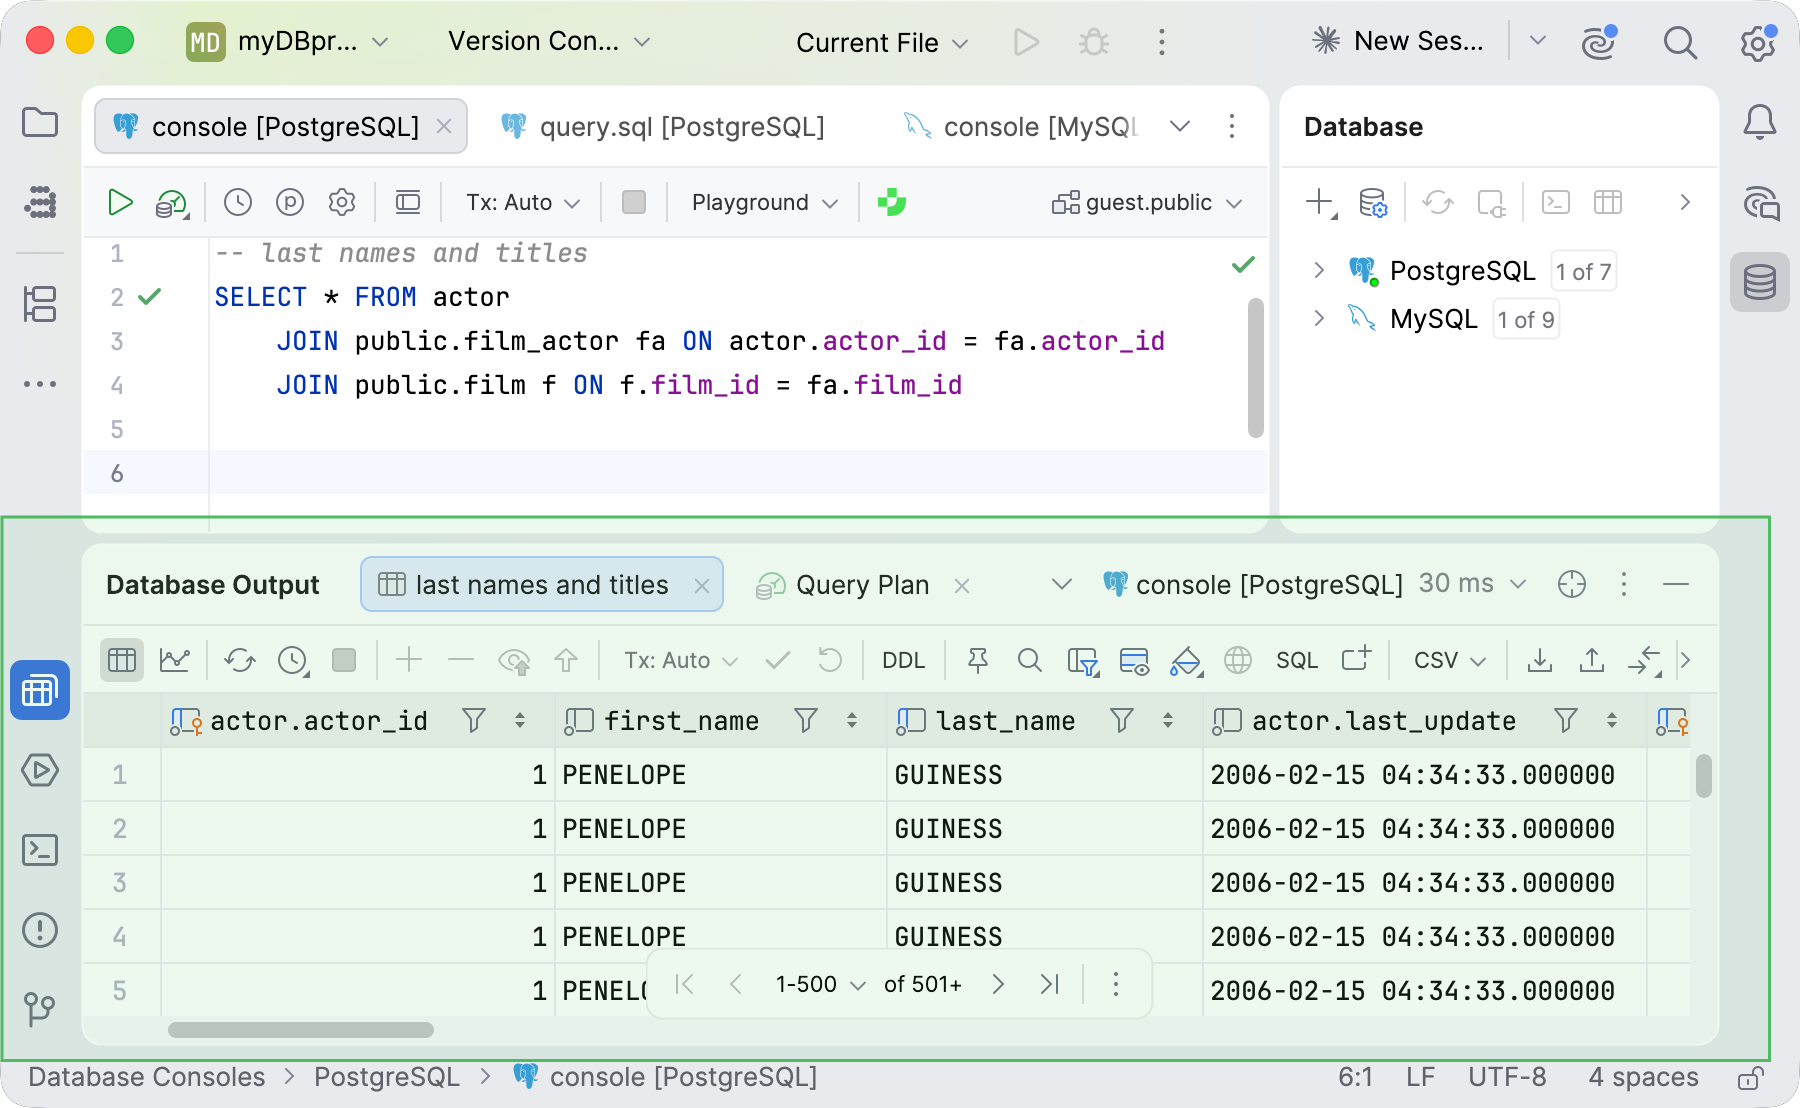
You can switch from displaying query results in the Services tool window to displaying them in the Database Output tool window. To do this, press Ctrl+Alt+S to open settings and select Tools | Database | Query Execution | Output and Results. In Show results in, select Database Output tool window.
Session management remains in the Services tool window.
Contents overview
The tool window contains the following elements:
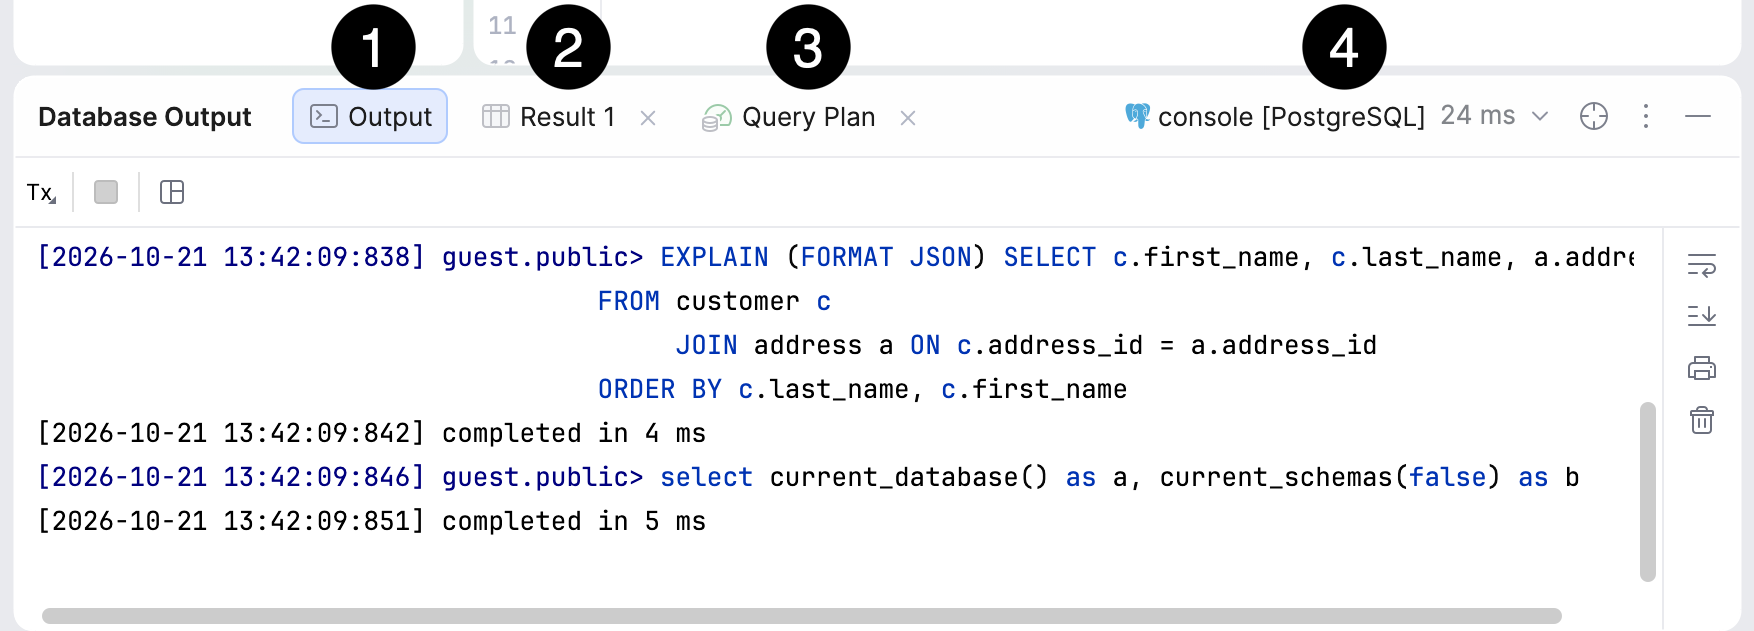
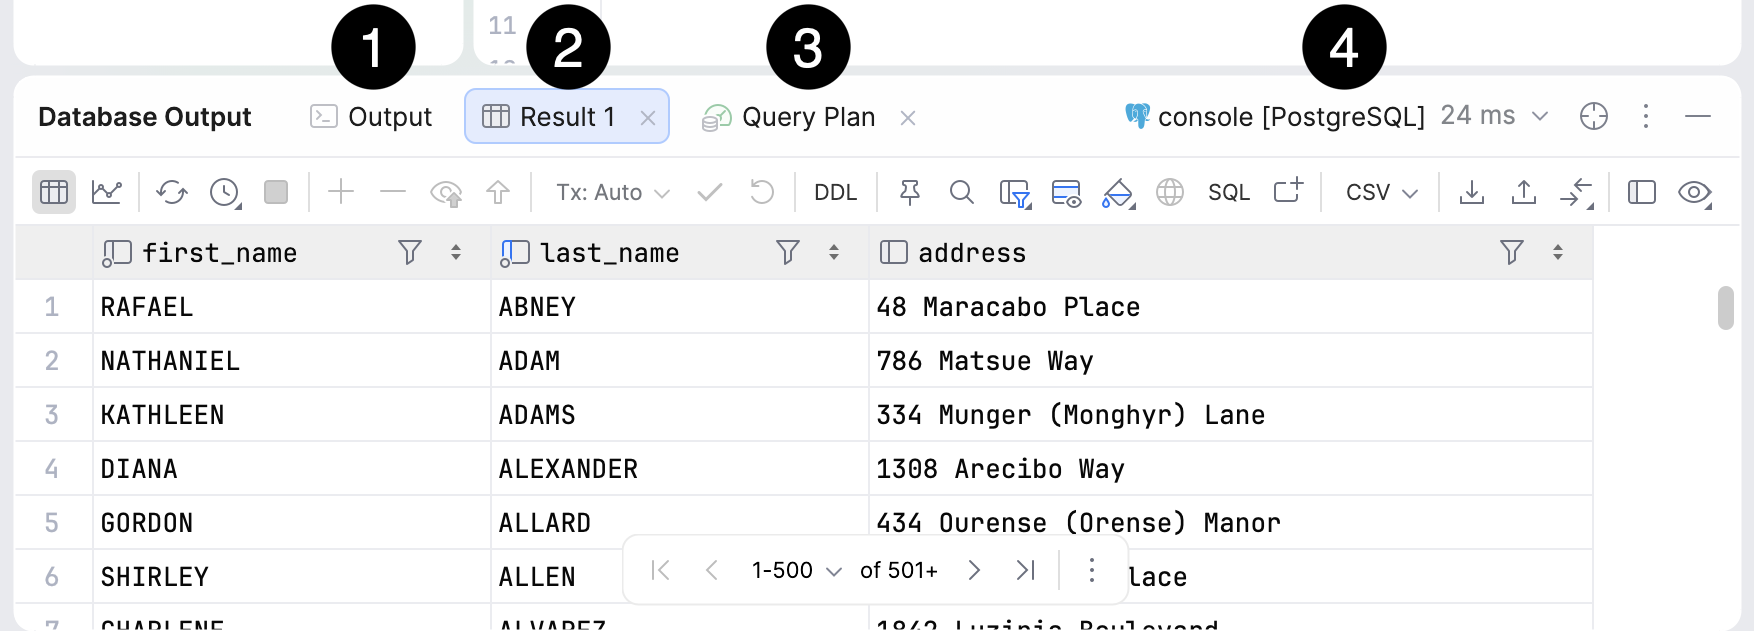
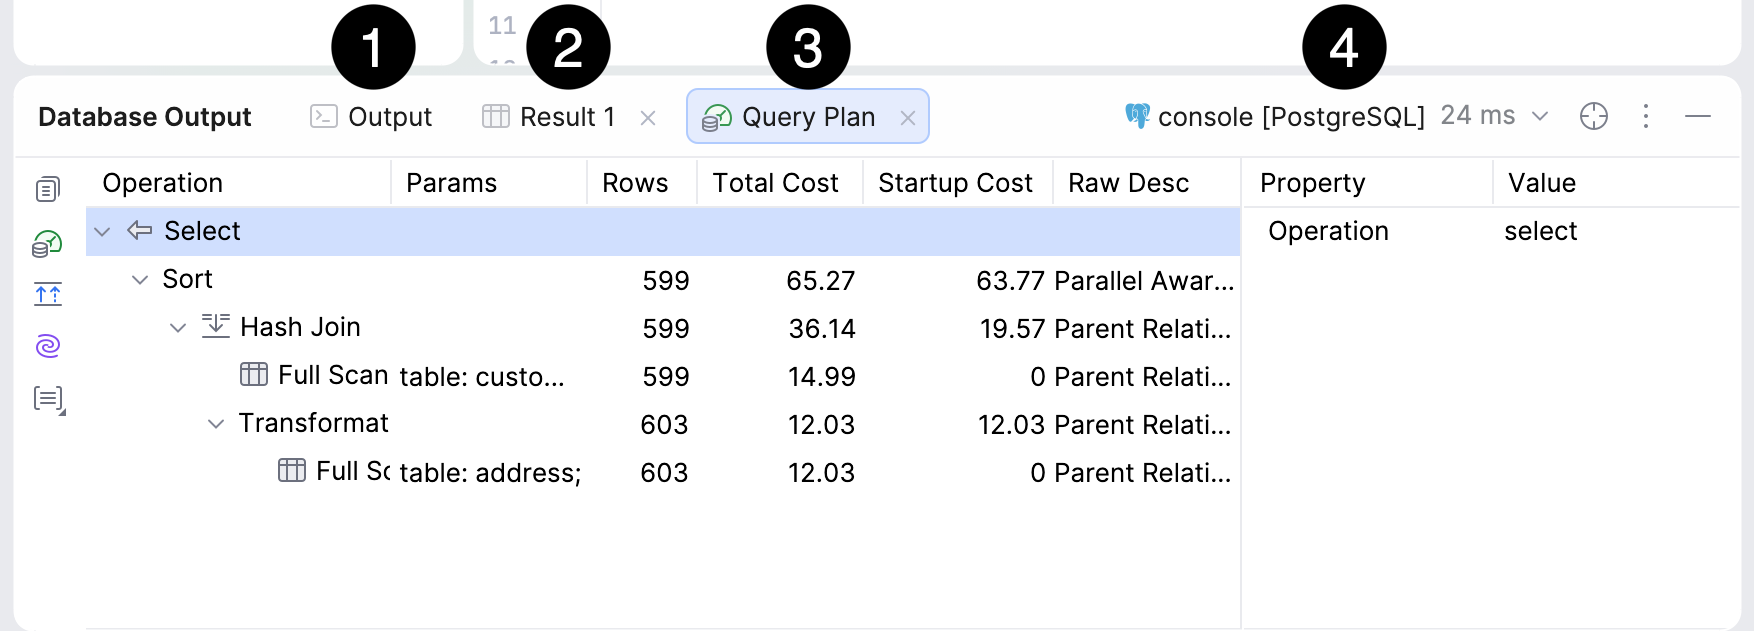
By default, the contents of the tool window follow the active editor tab, showing the corresponding output, query results, and query plan. When you switch to a query console that has no results, the tool window displays its Output tab. Running a query automatically selects the relevant result tab.
Open session details
To open session details for the selected query console or file, open the sessions dropdown on the right side of the toolbar and select Manage Sessions.
IntelliJ IDEA opens the corresponding session details in the Services tool window.
For more information about managing sessions and attaching clients to them, refer to Sessions.
Output tab
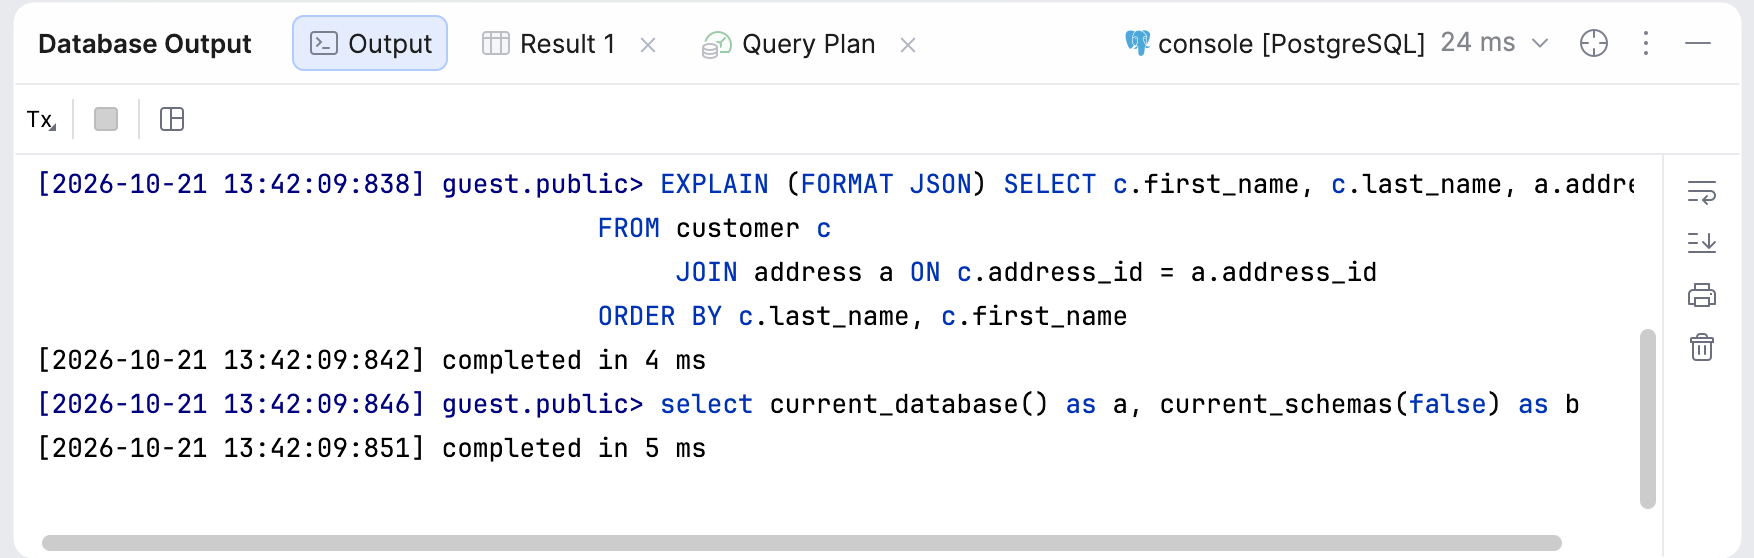
The Output tab displays a log of executed SQL statements and database operations, including execution messages and errors. Depending on the operation and output settings, the log can also include timestamps, affected row counts, and execution times.
The tab also displays output from queries that IntelliJ IDEA runs when you open a database table in the data editor. For output settings, refer to Output and Results.
Toolbar
-
TxTransaction Mode and Transaction Isolation Select the isolation level for database transactions and the way the transactions are committed.
Auto: the current transaction is committed automatically when you submit your local changes to the database server.
Manual: the changes submitted to the database server are accumulated in a transaction that can either be committed or rolled back explicitly by means of
 Submit and Commit or
 Roll Back buttons on the toolbar.
For more information about database transaction modes and isolation, refer to Submit changes to a database.
 Cancel Running Statements Ctrl+F2
Terminate execution of the current statement or statements.
 Restore Default Layout
Restore default positions of visual elements in the tab.
Right toolbar
 Soft-Wrap
Wrap long lines of text.
 Scroll to End
Scroll the output log to the end.
 Print…
Print a console file, a selected text, or all the files in a directory.
 Clear All
Clear the Output tab.
Result tab
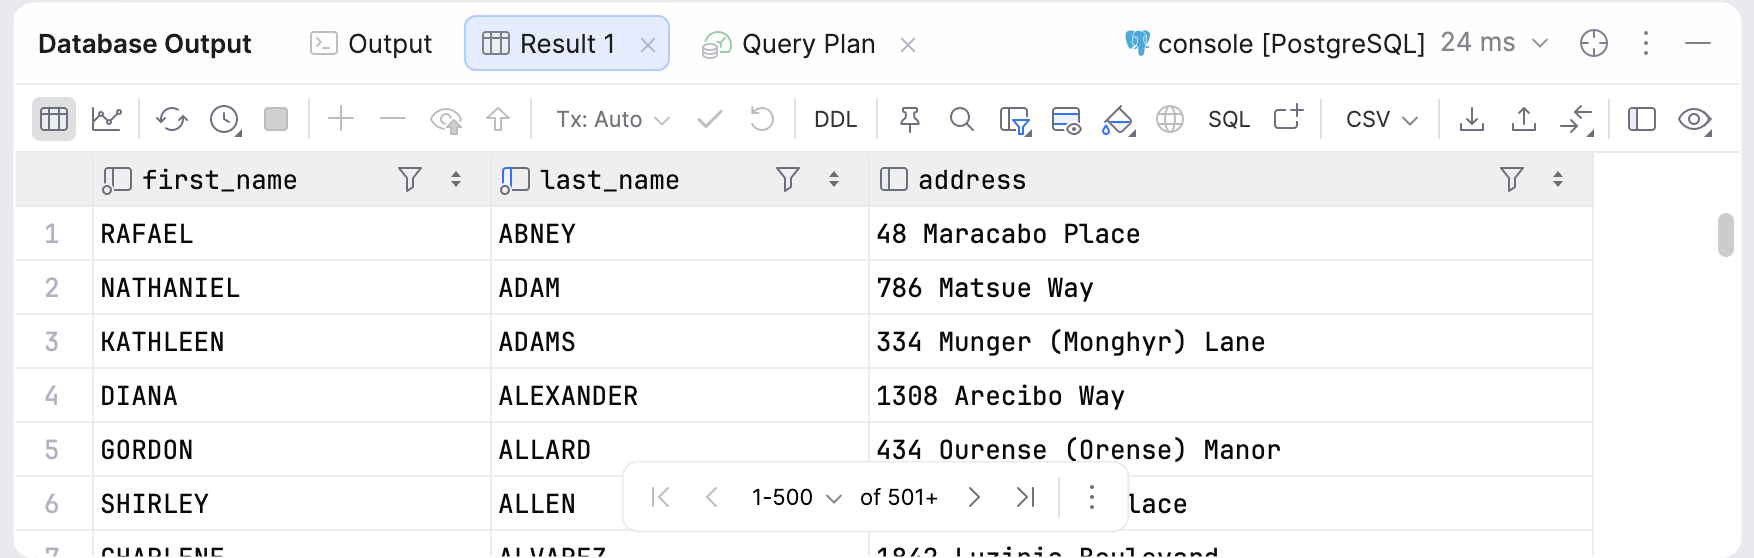
Each Result tab displays a query result set in a data editor. You can browse the data and use the data editor controls to work with it. For more information about data editor and viewing and working with result sets, refer to Data editor and viewer and Query results.
Query Plan tab
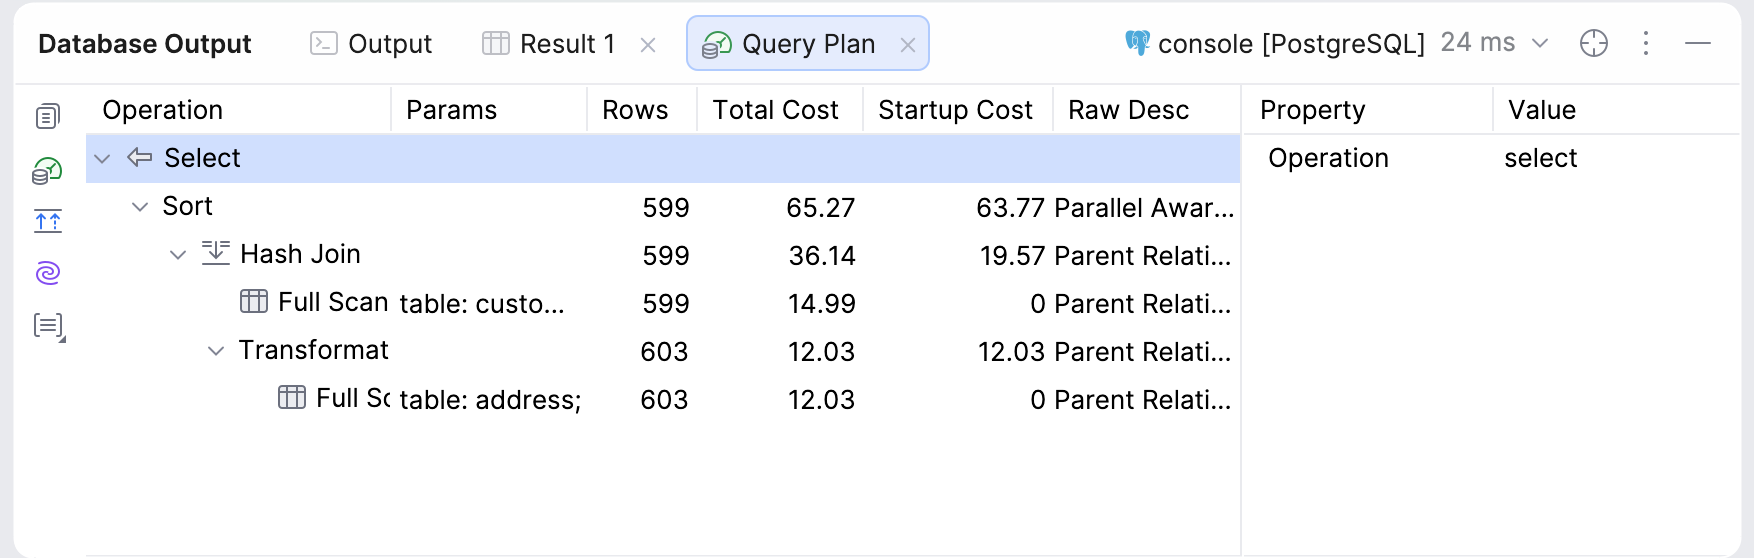
The Query Plan tab displays the execution plan generated by an Explain Plan or Explain Analyse action. For more information about generating plans and working with their tree, raw, and graphical representations, refer to Query execution plan.
Session clients dropdown
In the session clients dropdown, you can select a session client, such as a query console or SQL file, to view its output, query results, and query plans. Clients are grouped by data source. Selecting a client in this dropdown does not change the active editor tab.
Select Manage sessions to open session details for the selected client in the Services tool window.
For more information about sessions and session clients, refer to Sessions.