Exploring Go core dumps
Sometimes when you debug a program, you need to examine the code execution flow and understand the current state of a program. Go core dump is a file that contains the memory dump of running processes and their status during the life of a program. You can debug core dumps when the program finished its execution or while it is still running.
Create a Go core dump file on Linux
Open a terminal in the directory with the file .
Set the
ulimitparameter tounlimited:ulimit -c unlimited.Build the program by running
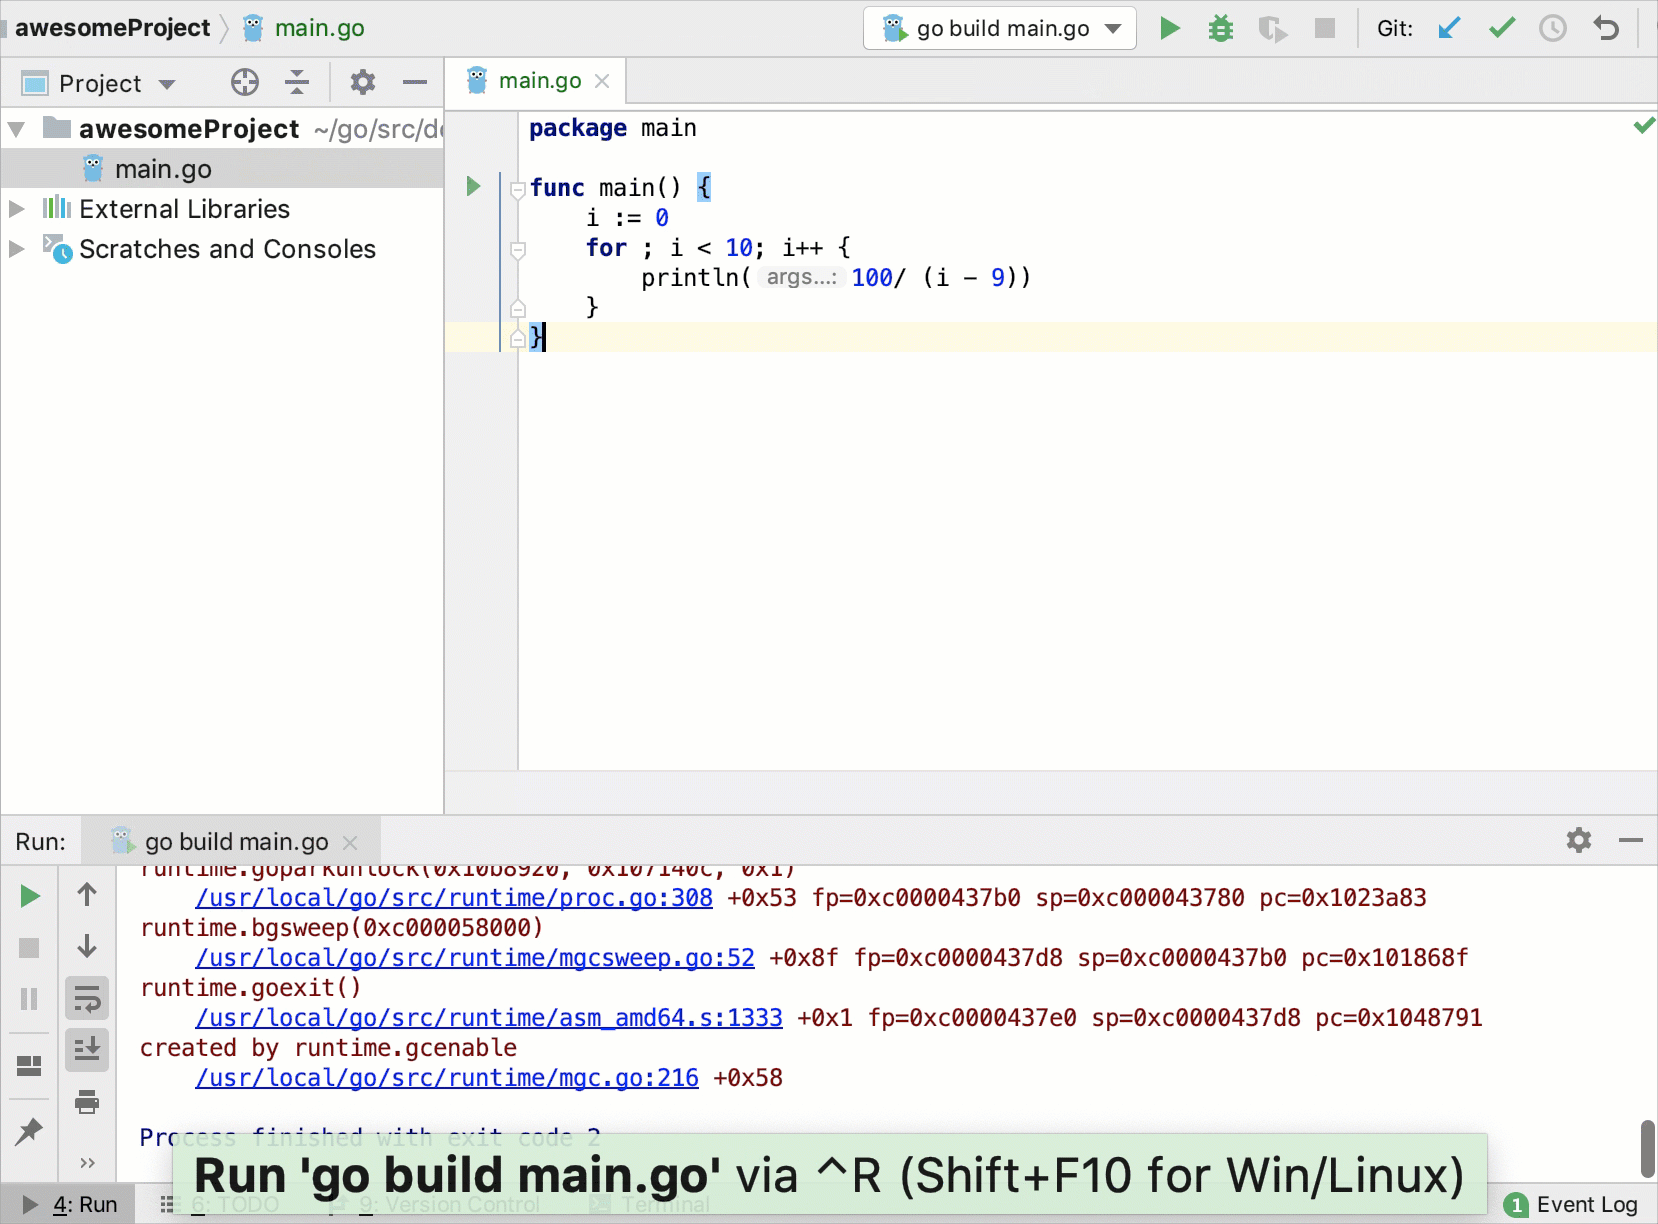
go build .in the terminal. Thebuildcommand creates a binary file in the current project folder (for example, awesomeProject).To create a core dump file, run
GOTRACEBACK=crash ./<binary_file_name>(for example,GOTRACEBACK=crash ./awesomeProject). This command creates a core file in the current project folder.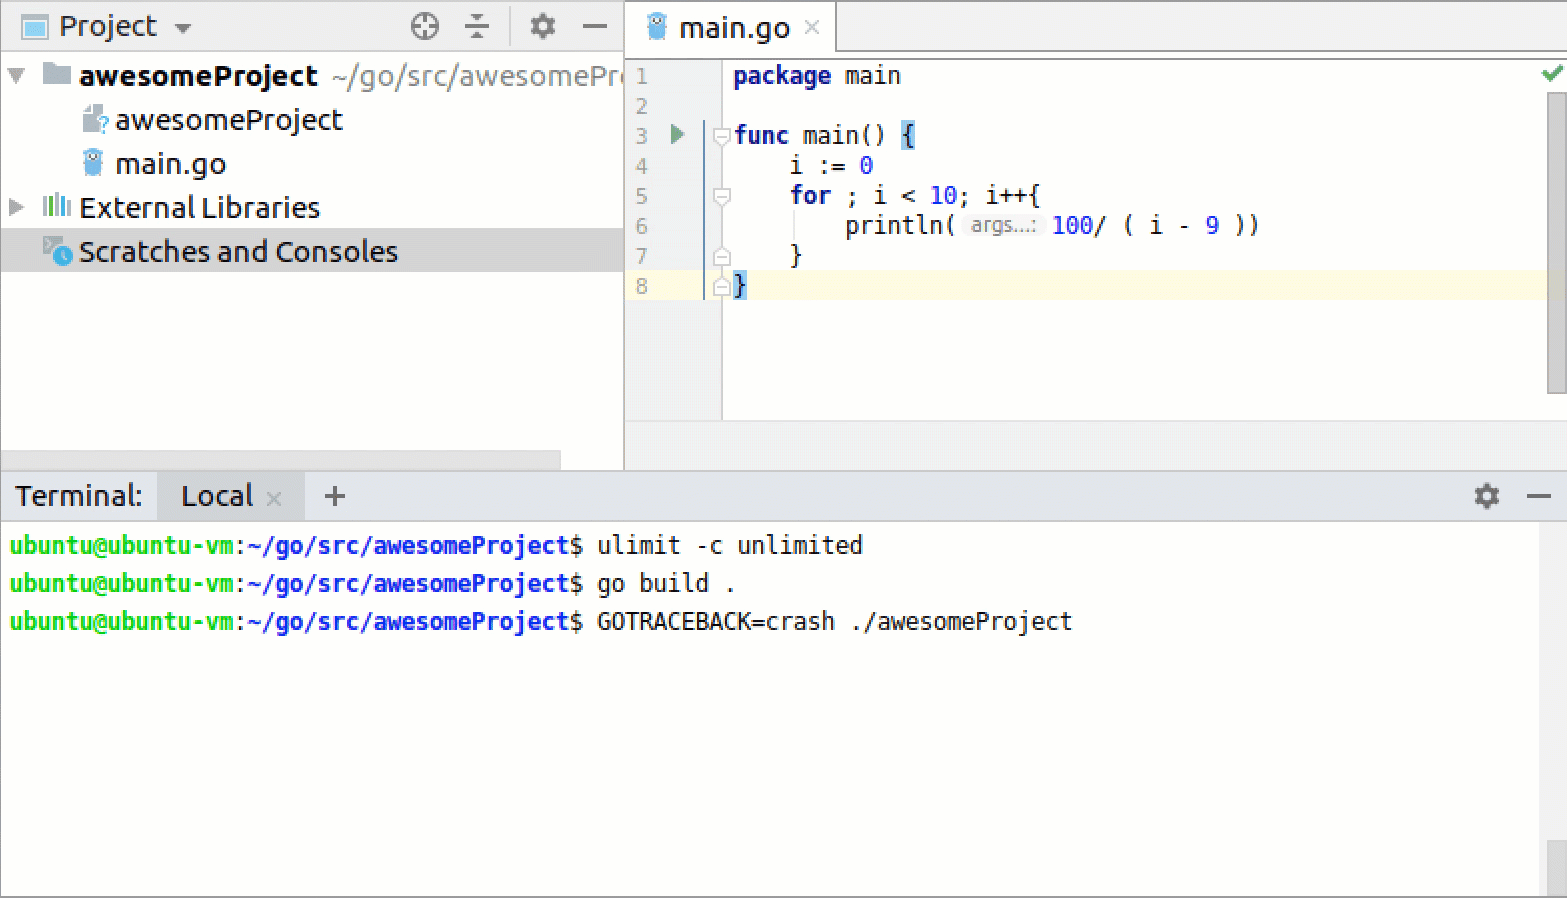
View the dump log
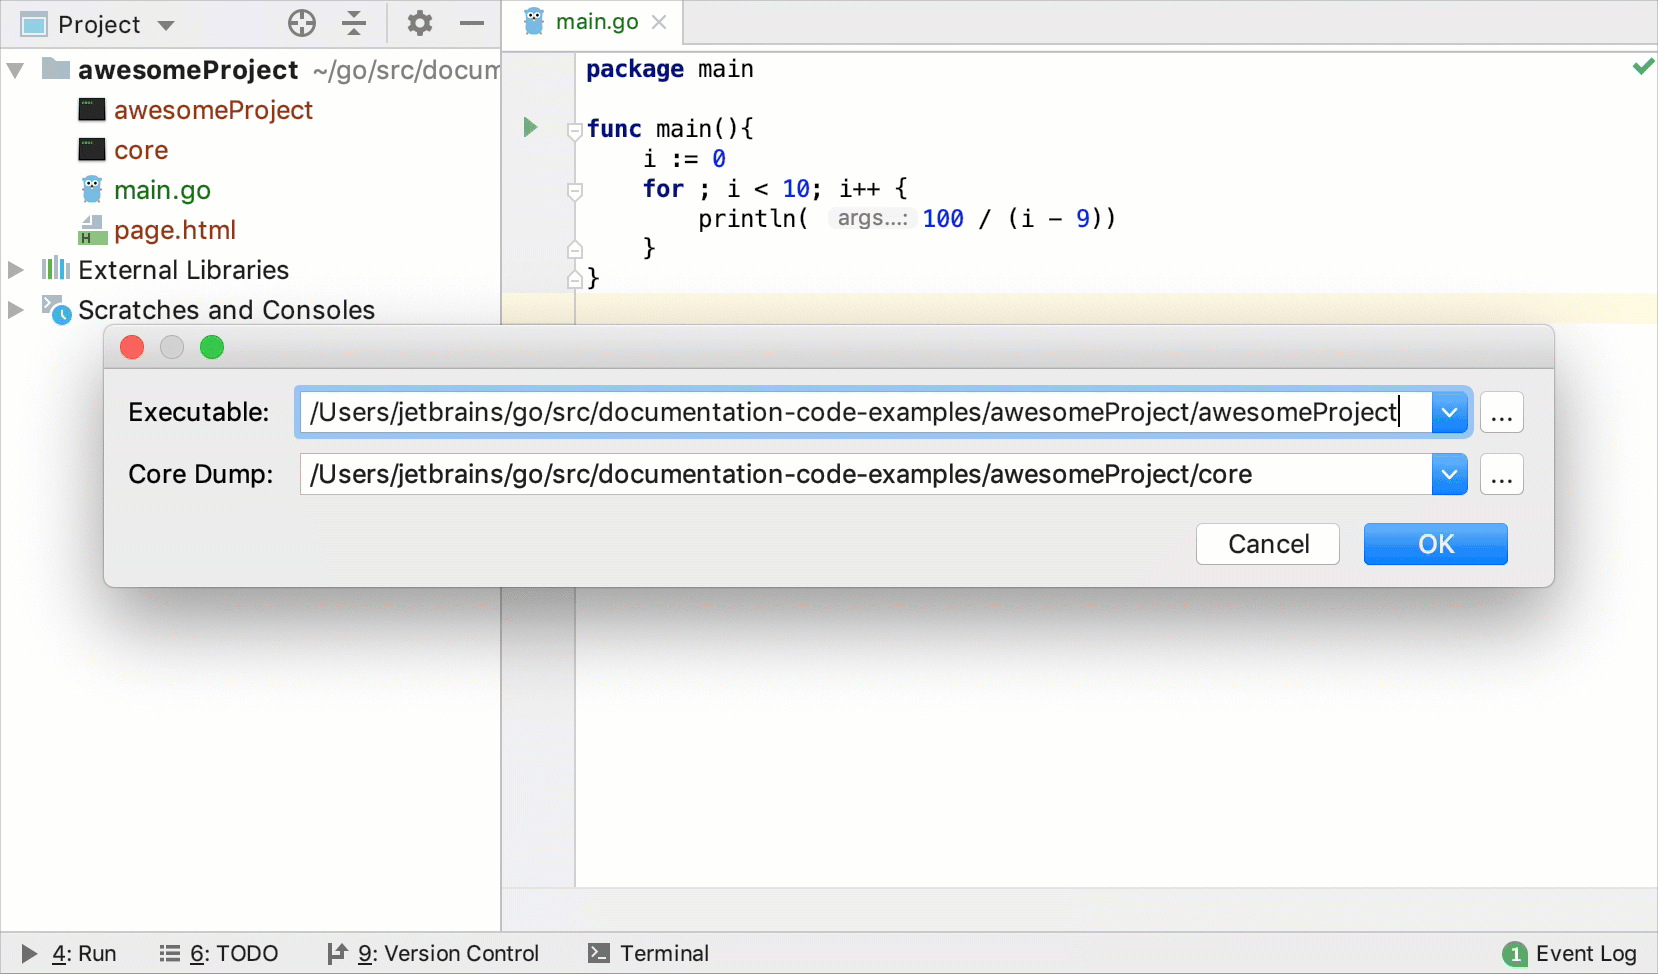
Navigate to .
In the Executable field, specify a path to the binary file (for example, awesomeProject).
In the Core Dump field, specify a path to the
corefile (for example, core).Click OK. In the Debug tool window, select a frame that you want to inspect.
View the Go core dump in IntelliJ IDEA
Open or create the Go Build configuration for the Go file.
In the Environment field, click the folder (
 ).
).In the Environment Variables dialog, click the Add icon (
 ).
).Click the Name field and type
GOTRACEBACK.Click the Value field and type
crash.Save all changes and click OK.
Run the program Shift+F10. The output for the program is displayed in the debugger window.