Remote debugging via SSH tunnel
This tutorial describes how to use an SSH tunnel (also known as SSH port forwarding) to set up a secure connection between a remote server running Xdebug and your development machine running PhpStorm. This can be useful for debugging code on a remote machine when there are firewalls in between, or a NAT router prevents direct connection, or the ISP or network infrastructure does not allow incoming TCP connections to the developer machine.

When the remote server can connect to the developer machine directly (for example, with a Vagrant machine), an SSH tunnel may not be needed.
Prerequisites
1. Debugger is set up on the remote server
Before you start debugging, make sure that you have a debugging engine installed and configured properly on the web server where your PHP application is executed.
PhpStorm supports debugging with two most popular tools: Xdebug and Zend Debugger. These tools cannot be used simultaneously because they block each other. To avoid this problem, you need to update the php.ini file of the relevant PHP interpreter as described in Configure Xdebug and Configure Zend Debugger.
For example, with Xdebug, make sure that the following settings are specified in php.ini on the server:
zend_extension: the setting indicating that the Xdebug debugging engine shall be used. Set toxdebugor use the full path to thexdebug.sofile, such as/usr/lib/php/20190902/xdebug.so.xdebug.mode: the setting controlling which Xdebug features are enabled. Set todebugfor debugging.xdebug.client_host: the IP address or hostname at which PhpStorm is running and listening for incoming connections from Xdebug.xdebug.client_port: the port to which Xdebug tries to connect on the host where PhpStorm runs. The default port is9003.
2. Listening to incoming debugger connections is enabled in PhpStorm
In PhpStorm, enable listening to incoming debug connections by doing any of the following:
Click
on the toolbar/the status bar.
Select in the main menu.
This ensures that PhpStorm reacts when a debugging session is started on the web server and opens the Debug tool window automatically. Before starting a debugging session, make sure that either a breakpoint is set or the Break at first line in PHP scripts option is enabled on the Debug page of the Settings dialog Ctrl+Alt+S.
Set up an SSH tunnel
When you start a debugging session, it's Xdebug that initiates a TCP connection from the remote server to the port on the developer machine where PhpStorm is listening to it.
The idea of SSH port forwarding is to create a "virtual" TCP port on the remote server that sends its traffic to a TCP port on your developer machine, tunneling traffic over SSH.
Set up an SSH tunnel
To set up SSH port forwarding, run the following ssh command on the command line:
9003:in9003:localhost:9003is the port on the SSH server (the forwarding host) from which Xdebug connections will be forwarded tolocalhost.localhost:9003in9003:localhost:9003is the IP address of the SSH client (the machine running PhpStorm) and the port on it to which Xdebug connections will be forwarded.localhostis essentially the machine where you are running thissshcommand from.username@hostnameis the address of the SSH server (the forwarding host) and the username required for SSH authentication on it.
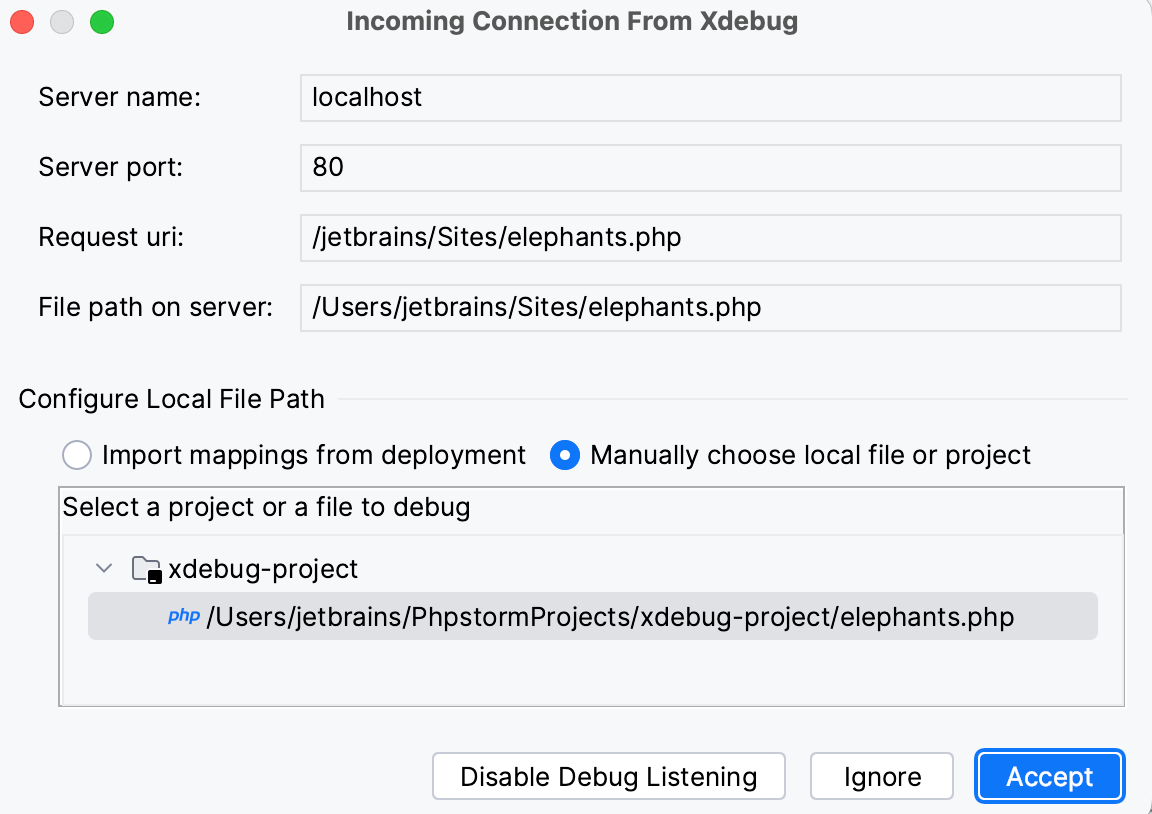
To check that an SSH tunnel has been successfully set up, start a debugging session on the remote server by using PhpStorm bookmarklets, a Browser Debugging Extension, or the techniques outlined in Debugging PHP CLI scripts with PhpStorm. As soon as PhpStorm detects the incoming connection, it displays the Incoming Connection from Xdebug dialog prompting you to accept it.

For more information about the debugging process in PhpStorm, see Zero-configuration debugging and Examine a suspended program.
Debug PHP CLI scripts with remote PHP interpreters or via SSH tunnel
When a remote PHP interpreter is properly configured, it's possible to create a run/debug configuration taking advantage of the remote PHP interpreter for debugging.
When the SSH tunnel is up and running, we can also debug PHP CLI scripts. Since the debugger runs on a remote machine, starting a CLI debugging session can be done by using PHP command line switches or using environment variables (on the remote machine). This workflow is not the officially recommended way of debugging, though it might be useful in some cases when the debugging session is needed to be established from the remote server side.
Troubleshooting
The debugger never connects or refuses connection
When the debugger never connects or refuses the connection, check the following:
Make sure Xdebug is configured to connect to 127.0.0.1 and port 9000 (for Xdebug 2) or port 9003 (for Xdebug 3).
When using Zend Debugger, make sure the PhpStorm bookmarklets or Browser Debugging Extension is configured to connect to 127.0.0.1.
Make sure PhpStorm is listening for incoming debugger connections prior to setting up the SSH tunnel.
When a machine is rebooted or the connection is lost, the SSH tunnel has to be reestablished.
Remote file path is not mapped to a file path in the project
In some cases, the debugger can connect, but we get the error messages indicating that no mapping between the remote and project files is defined. This means that PhpStorm cannot determine which local file corresponds to the file being debugged.

We can solve this problem by clicking Click to set up path mappings and providing the necessary path mappings. Additionally, we can configure these mappings using the techniques outlined in Connect to a web server.