Run tests with code coverage
PhpStorm provides a dedicated action for running tests with the code coverage measurement.
Run tests with coverage using an existing configuration
To run tests with coverage using a previously created run configuration, do one of the following:
Press Alt+Shift+F10 to open the popup, select the required configuration, click
 to the right of it, and then select
  Cover.
From the toolbar, select the required run configuration from the configurations list, click
to expand its options and select .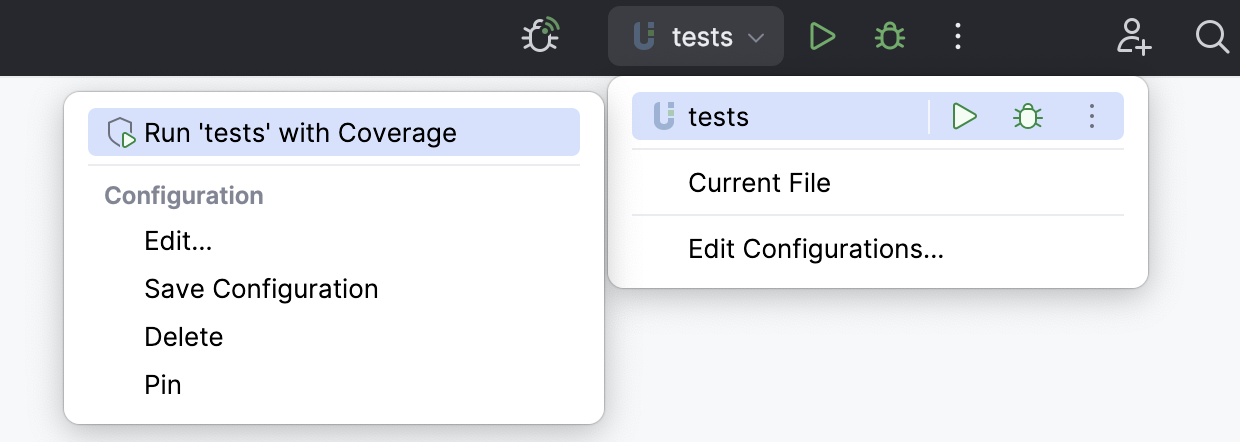
Run tests with coverage from the Project view
To run a test or multiple tests with coverage from the Project view, do the following:
Right-click a specific test file or a directory containing the required tests.
From the context menu, select the corresponding run command, for example,
.
Run tests with coverage from the editor
Click
 Run in the gutter next to the required test class or method and from the context menu that opens, select .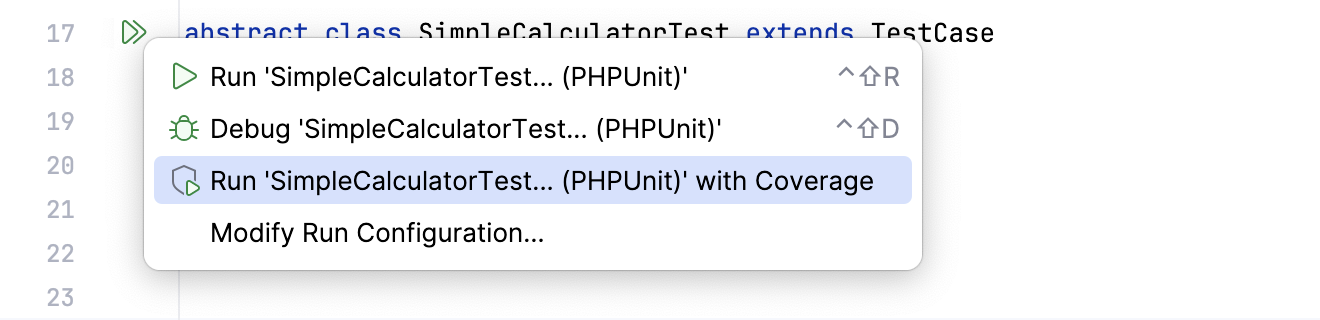
If the Show options before applying coverage to the editor checkbox has been selected in Settings Ctrl+Alt+S Coverage, a dialog appears where you can choose whether you want to replace the active coverage suites, add the collected data to the active suites, or not apply coverage data. You can also opt to skip this dialog in the future. In case any other option has been selected, the respective action will be performed silently.
Now you can explore the collected coverage data in the Coverage tool window, the Project tool window, or in the editor.
Manage coverage suites
A coverage suite is a collection of code coverage data from a specific run. Each coverage suite stores data from either a single run configuration (if it was run with coverage) or from an imported coverage data file.
PhpStorm stores coverage suites in the coverage folder of the IDE system directory:
%LOCALAPPDATA%\JetBrains\PhpStorm2026.2\coverage
~/Library/Caches/JetBrains/PhpStorm2026.2/coverage
~/.cache/JetBrains/PhpStorm2026.2/coverage
PhpStorm can display results from one or more coverage suites at the same time, and you can select which suites to show. If multiple suites are selected, the IDE displays their merged results: this means that a line is considered covered if it was executed in at least one of the suites.
Manage suites
In the main menu, go to (Ctrl+Alt+F6).
In the Choose Coverage Suite to Display menu:
Use the checkboxes to select active suites. Active suites define the coverage data that is currently displayed in the IDE.
Use
 Add to import a external suite file, for example, generated in the CI server or sent to you by someone else.
 Use
 Remove to remove a suite from the list but keep the file in the storage.
Use
 Delete to remove a suite from the list and delete the file from the storage.
View code coverage results
Code coverage results are displayed in the Coverage tool window, in the Project tool window, and in the editor after you run at least one test configuration with coverage.
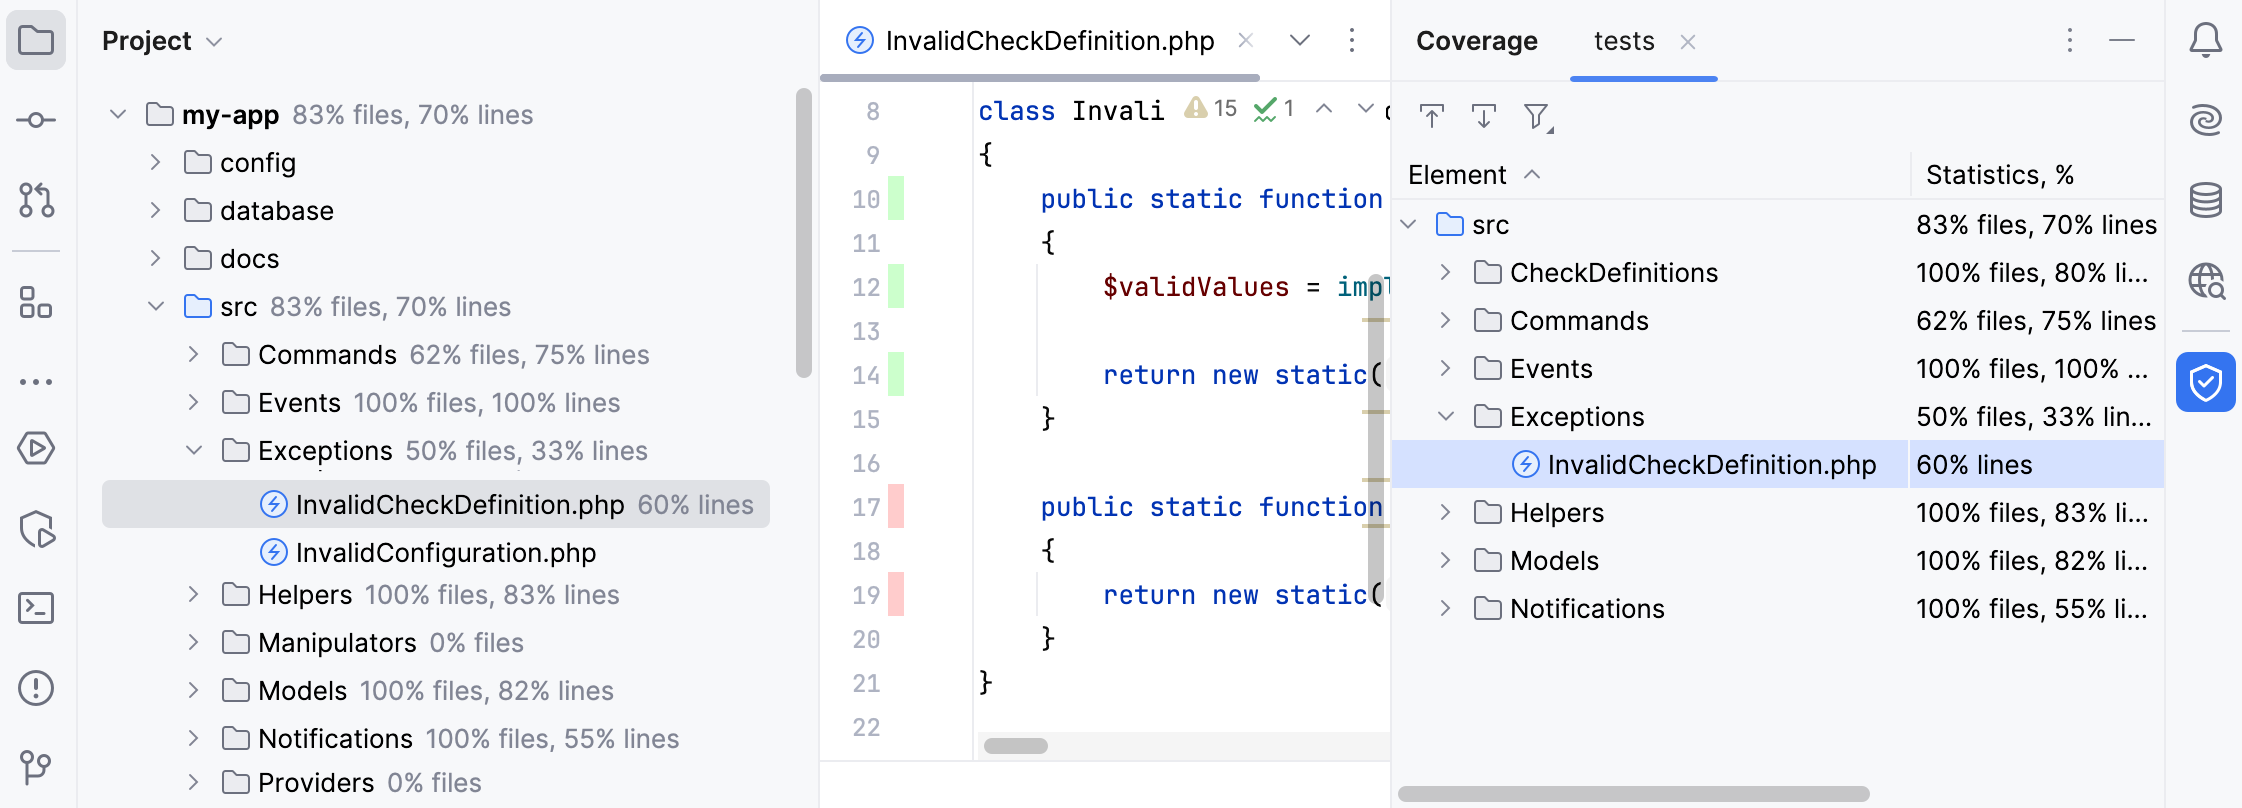
Additionally, these results are saved to the coverage folder in the IDE system directory.
Coverage tool window
The Coverage tool window opens right after you run a test configuration with coverage. The report shows:
For a directory: the percentage of the covered files and lines.
For a file: the percentage of the covered lines.
The Coverage tool window has the following options:
Item | Description |
|---|---|
| If this option is on, PhpStorm automatically opens the selected item in the editor. Otherwise, you need to double-click items to open them. |
| If this option is on, PhpStorm automatically locates in the tool window the files that you open in the editor. |
| Import a coverage suite from disk. |
| Filter coverage results. You can choose to view only the classes with uncommitted changes to focus on recent updates or hide the classes that are fully covered with tests. |


If you want to reopen the Coverage tool window, go to in the main menu, or press Ctrl+Alt+F6.
Code coverage results in the Project tool window
The Project tool window shows:
For a directory: the percentage of the covered files and lines.
For a file: the percentage of the covered lines.
Code coverage results in the editor
In the editor, lines of code are coloured in the gutter according to their code coverage status:
Green (
 ): the code line was executed.
Red (
 ): the code line was not executed.
To find out how many times a specific code line has been run, or hide coverage results from the editor, click its gutter color indicator.
