Hot Spots
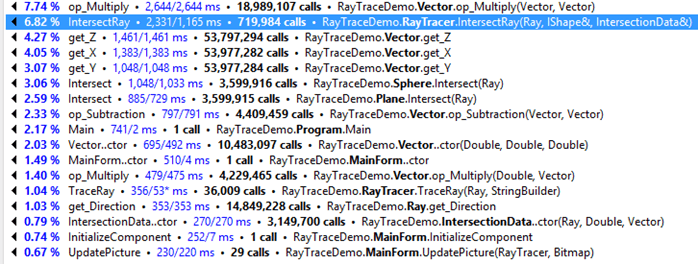
The Hot Spots view lists functions with highest execution time in the profiled application code. The call execution time is calculated as a sum of own method's time and times of all system methods it calls (down to the first user method in the stack).
By default, methods in Hot Spots are sorted by execution time (the Own+System Time button). You can also sort methods by a number of call instances (in case a method was called from a number of places). To do this, click the Instance Count button. This will show you the "most frequently used" methods.
To open the Hot Spots view
Click the corresponding icon
![ThemedIcon.ModeHotspotsView.Screen.[-].png ThemedIcon.ModeHotspotsView.Screen.[-].png](https://resources.jetbrains.com/help/img/dotnet/2026.1/ThemedIcon.ModeHotspotsView.Screen.%5B-%5D.png) on the left panel.
on the left panel.

This view provides back traces* for each function, so you can see not only where time was spent in your code but also which paths lead to the selected hot spot.
Each node of the Hot Spots view contains the following information:

Percentage of time spent by the top-level function in the current call stack relative to the time spent in all calls shown in the Hot Spots view.
Short name of the called function.
Own time including time spent in system functions / Own time only.
Number of calls made to this function during profiling.
Full name of the called function.
Contribution of the top-level function to the sum of times in this call stack.
Contribution of the top-level function to the sum of calls in this call stack.