Threads Tree
The Threads Tree view serves many purposes. Typical use cases include the following:
View what kind of threads are being spawned by your application.
Monitor all threads and their activities.
Analyze each thread's activity.
Find and examine critical execution paths.
To open the Threads Tree view
Click the corresponding icon
![ThemedIcon.ModeStraightViewPerThread.Screen.[-].png ThemedIcon.ModeStraightViewPerThread.Screen.[-].png](https://resources.jetbrains.com/help/img/dotnet/2026.1/ThemedIcon.ModeStraightViewPerThread.Screen.%5B-%5D.png) on the left panel.
on the left panel.
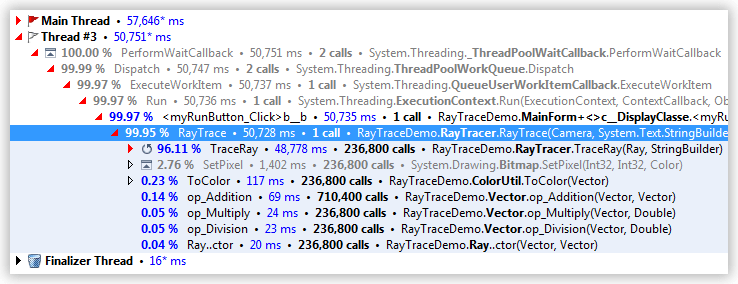
The Threads Tree view lists all threads in your application. They are sorted by their execution time. Each thread is identified by its name or ID. The main thread is marked with the ![]() icon. The finalizer thread is marked with the
icon. The finalizer thread is marked with the ![]() icon. Other threads are worker threads. If a thread pumps messages, it has the
icon. Other threads are worker threads. If a thread pumps messages, it has the ![]() icon, otherwise not.
icon, otherwise not.

You can expand a thread node and search the call stack for expensive functions. The appearance of this view depends on the current filters settings.

Each node in the Thread Tree view contains the following information:

The percentage of time spent in this call related to time spent executing the thread.
Short name of the function being called.
Total time spent in this function and its subtree.
Number of calls made in this call stack.
Full name of the called function.